Article Content
INTRODUCTION (PDF)
In high voltage power equipment, gaseous media are commonly used for insulation and arc extinguishing. Owing to the superior insulating strength and arc-extinguishing capability, SF6 has long been recognized as a preferred insulating and arc-interrupting gas in the electrical power sector. However, due to its potent greenhouse effect, SF6 has been classified as a regulated gas under the Kyoto Protocol. Accordingly, the development of environmentally sustainable replacements for SF6 has become a prominent focus in the field of electrical insulation.
Ideal alternatives to SF6 need to be characterized by low warming potential (GWP), low or no toxicity, non-flammability, strong insulating and arc-extinguishing capabilities, stability, and easy availability.1 In recent years, the alternative gases that have been studied and pilot applied can be classified into three main categories:2 (1) conventional gases, such as dry air, nitrogen(N2), and carbon dioxide (CO2); (2) SF6 gas mixtures, including SF6/N2 and SF6/CO2; and (3) fluoronitrile mixture gases. Employing SF6 gas mixtures offers a temporary alleviation of its greenhouse impact; however, this approach falls short of addressing the fundamental environmental concerns associated with SF6 in the long run.3 Fluoronitrile mixture gases require complex and costly recovery, recycling at the end of life,4 and the production involves complicated techniques and high costs.5
Compared to the above-mentioned gases, N2/O2 gas mixtures considered an ideal insulating medium for power equipment due to the advantages of zero GWP, economic viability, easy availability, and benign environmental profile.6 Siemens and Pinggao etc.7,8 have developed and launched power equipment combining clean air and vacuum interruption. Lim and Bae9 investigated the surface insulation characteristics of compressed air, dry air, and N2/O2 gas mixtures in GIS, comparing them from five aspects and concluding that dry air is the best alternative to SF6. Park et al.10 conducted a detailed analysis of the discharge and flashover phenomena of N2/O2 gas mixtures under severe field non-uniformity and proposed a more detailed discharge mechanism compared to previous studies. Tao et al.11 employed the Boltzmann equation and electron transport parameters to calculate the critical electric field for N2/O2 mixtures with varying ratios and further assessed their gap insulation performance when the electric field is mildly non-uniform. Zouaghi et al.12 investigated the performance of dry air in DC under non-uniform field conditions. The experimental work has been compared to a numerical study of the breakdown electric field based on a streamer criterion using COMSOL Multiphysics numerical software. At present, there seems to have been relatively few studies on the insulating properties of N2/O2 gas mixtures. There are currently no definite conclusions regarding the effect of O2 content on the gap insulation properties of N2/O2 gas mixtures. Research on the electric field sensitivity of N2/O2 gas mixtures remains limited. In addition, the prediction and calculation of breakdown voltage are important, which can help in a better use of insulating gases in practice and optimization of insulation structures.
Therefore, this study focused on the gap breakdown characteristics of the N2/O2 gas mixture. The effects of factors such as gas pressure and O2 content on the breakdown characteristics under different electric field uniformities were investigated through breakdown experiments and analysis. Through comparative analysis of breakdown experiments under different electric fields, the electric field sensitivity of N2/O2 gas mixtures was studied. Numerical simulations of the breakdown voltage were conducted using COMSOL Multiphysics and BOLSIG+, which were based on the streamer initiation criterion. The simulation results were compared to experimental data and subsequently corrected. Furthermore, the applicability of the breakdown voltage calculation model was discussed, providing reference for the design of environmentally friendly gas insulation power equipment.
II. EXPERIMENTAL SETUP AND METHOD
A. Experimental setups
Figure 1 shows the schematic of the experimental setup and associated measurement circuit, which consists of an AC high-voltage power supply, an experimental chamber, a capacitive voltage divider, and a gas filling and discharging gas system. The chamber was made of 304 stainless steel with a height of 740 mm and an inner diameter of 300 mm, as shown as Fig. 2. There were three windows for observing physical phenomena inside the cavity. The fourth side was the filling and discharging gas pipeline, including two filling and deflating valves and a vacuum valve. The AC power supply WXYD-10/15 generated a standard power frequency voltage, with a maximum output voltage of 150 kV. An oscilloscope was used to observe the breakdown voltage. To prevent laboratory environmental interference with the oscilloscope signals, an uninterruptible power supply was used to independently power the oscilloscope.
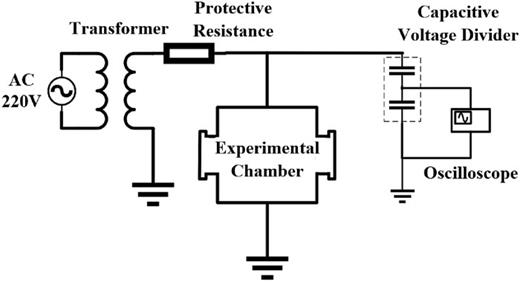
Experimental setup and schematic diagram.
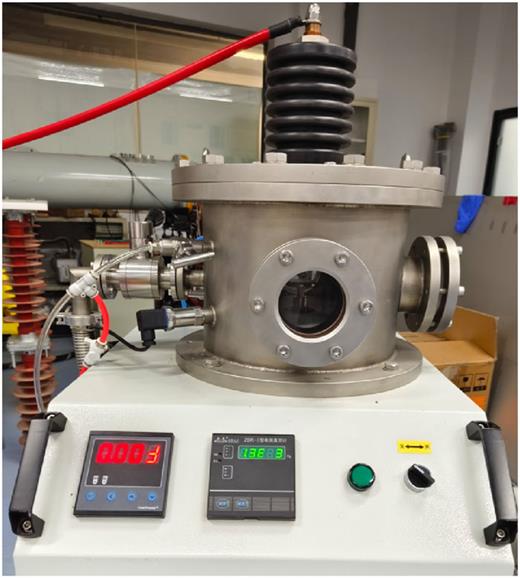
Experimental chamber.
B. Electrode arrangements
The electrode configuration adopted in this study is depicted in Fig. 3. The plane electrode had a diameter of 50 mm and the needle electrode had a tip radius with curvature of 0.3 mm. Both electrodes were made of brass. Plane–plane electrodes with a gap of 5 mm and needle–plane electrodes with a gap of 10 mm were used to simulate the field distribution with different field uniformity.
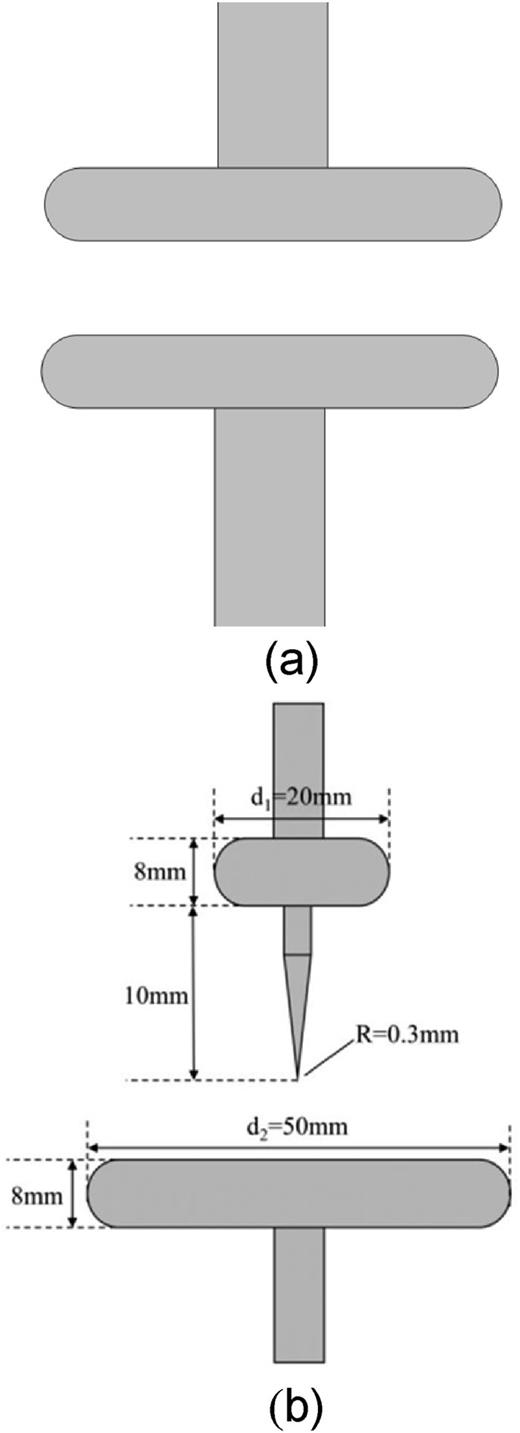
Electrode arrangement. (a) Plane–plane electrodes. (b) Needle–plane electrodes.
The field inhomogeneity is related to both the electrode structure and the electrode spacing, which can be numerically expressed by the field inhomogeneity coefficient f. f is defined as in
(1)
Here, Eav is the mean field intensity and Emax is the maximum field intensity. U is the voltage applied to the electrodes, and d is the distance between the two electrodes. Usually, the field inhomogeneity coefficient f can be used to classify the electric field as uniform electric field (f = 1), slightly non-uniform electric field (1 < f < 2), and highly non-uniform electric field (f > 4). Figure 4 shows the electric field simulation results obtained from COMSOL Multiphysics. The inhomogeneity coefficients f calculated by COMSOL Multiphysics were 1.31 for the plane–plane electrodes (slightly non-uniform field) and 16.8 for the needle–plane electrodes (highly non-uniform field).
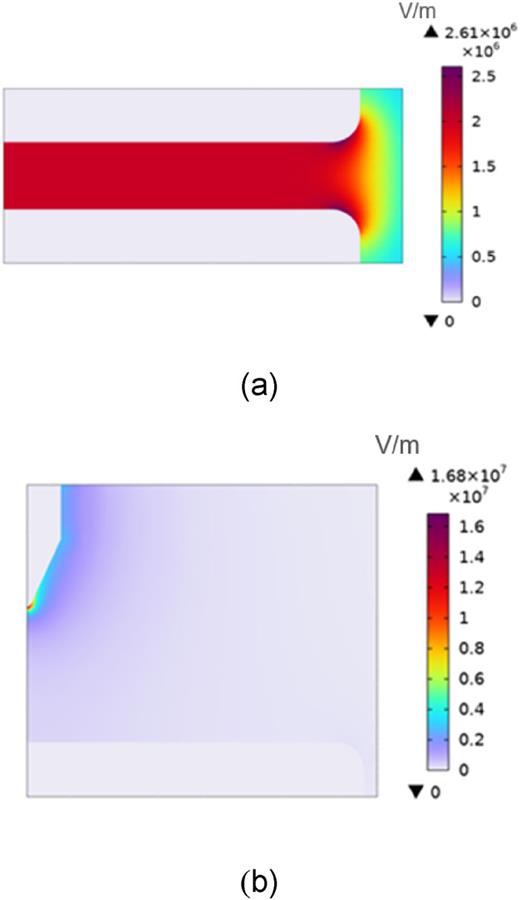
Electric field simulation results with different electrodes. (a) Plane–plane electrodes. (b) Needle–plane electrodes.
C. Experimental methods
In this study, the partial pressure law was used to mix O2 and N2 with a certain ratio. Insulation experiments were conducted on N2/O2 gas mixtures with O2 contents of 20%, 30%, 40%, 50%, and 60%. A gas pressure range of 0.1–0.45 MPa was employed. The experiments were conducted using the 75% boosting method. The voltage was initially increased at a uniform rate to 75% of the expected AC breakdown voltage and then gradually raised until gas breakdown occurred. The voltage applied at the instant of breakdown was recorded as the breakdown voltage. Each set of experiments was repeated five times, with the average value recorded as the final result. A 2 min pause between two experiments was maintained to ensure complete insulation recovery.
III. BREAKDOWN VOLTAGE CALCULATION
For insulating gases, the breakdown voltage is typically calculated using the streamer initiation criterion, which is expressed as
(2)
where α and η means the ionization and attachment coefficients, respectively, Zi is the electron avalanche initiation position, and d is the critical length of avalanche development along the electric field line. k is a non-dimensional parameter taking the logarithm of the critical charge number Ncrit for streamer initiation, which may depend on factors such as gas type, gas pressure, and field non-uniformities.12 k is usually taken as 18.4 in air. The equation describes the transition of an electron avalanche into a streamer discharge once the electron population exceeds a critical threshold during drift along the electric field.13
The ionization and attachment coefficient distributions for N2/O2 gas mixtures with different mixing ratios were calculated using the electron Boltzmann equation solver BOLSIG+14 in combination with parameters such as the collision area of N2 and O2 from the LXCAT database to obtain the effective ionization coefficient . The critical electric field could be obtained by α − η = 0 to determine the calculation boundary. The gap electric field distribution was obtained through simulation. A procedure was written to carry out the calculation; Fig. 5 shows the calculation flow chart.
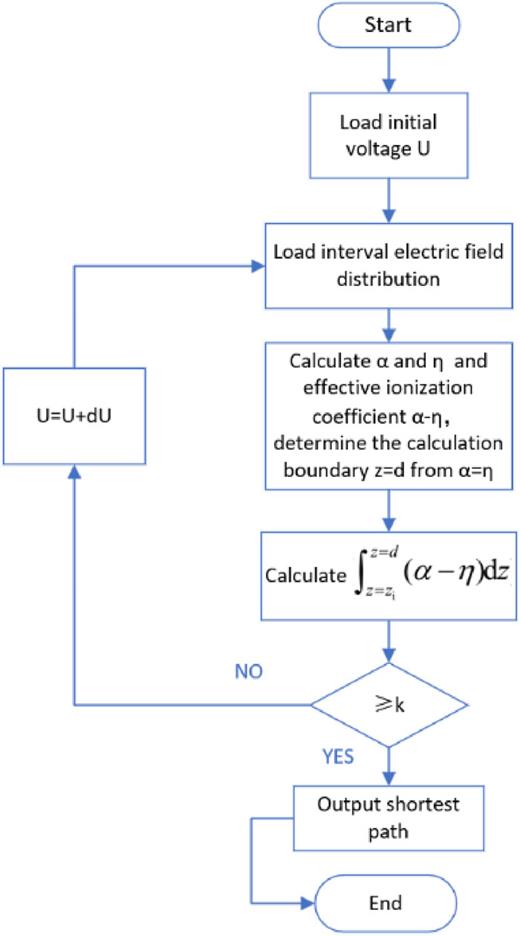
Procedure of calculating the breakdown voltage using the streamer initiation criterion.
Figures 6(a)–6(c) show breakdown voltages calculated using the model under plane–plane (f = 1.31), rod–plane (f = 1.56),11 and needle–plane (f = 16.9) electrode configurations, respectively. For the rod–plane configuration, the electrode geometry (tip radius = 5 mm, gap distance = 4 mm) was the same as in the experimental setup of Tao et al..11 In the plane–plane configuration, the calculated breakdown voltages showed a small variation with varying oxygen content, which could be considered approximately constant. However, in the rod–plane and needle–plane cases, the results varied with O2 concentration, indicating that oxygen had a more pronounced effect on the insulation performance of N2/O2 mixtures when the field is non-uniform. The phenomenon can be explained based on the principles of discharge physics. Since both the ionization coefficient (α) and the attachment coefficient (η) are functions of the electric field strength, variations in the field significantly influence breakdown. The electric field gradient near the needle tip can reach the order of 1010 V/m2, while in the plane–plane electrode configuration, the gradient is nearly zero. Under such extreme field gradients, changes in the effective ionization factor due to changes in oxygen content are magnified exponentially.
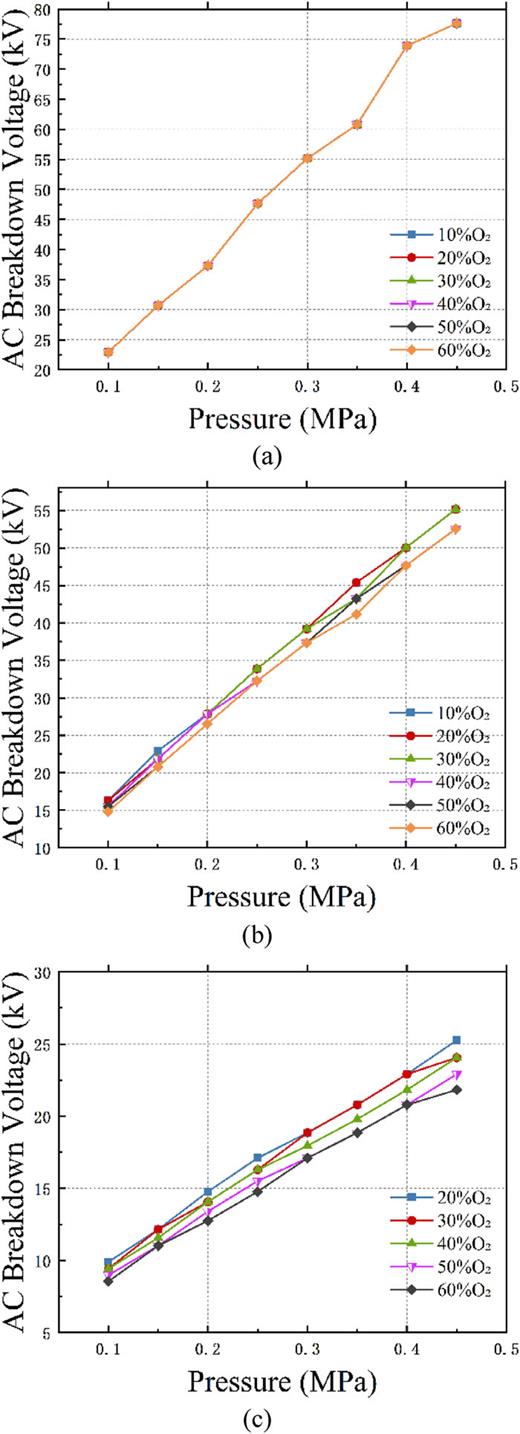
Simulation results of breakdown voltages calculated by the model. (a) Plane–plane electrodes (f = 1.31). (b) Rod–plane electrodes (f = 1.56). (c) Needle–plane electrodes (f = 16.9).
IV. RESULTS AND DISCUSSION
A. Dielectric properties of N2/O2 gas mixtures
1. Dielectric properties of N2/O2 gas mixtures when the electric field is slightly non-uniform
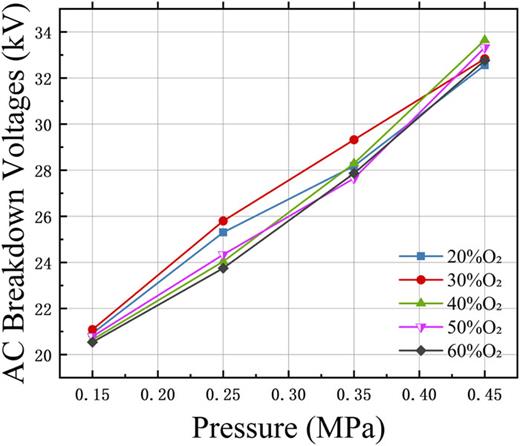
Figure 7 depicts the AC breakdown voltages according to pressure when the field is slightly non-uniform. The AC breakdown voltage increased linearly with gas pressure across all oxygen concentrations. The smallest increase occurred at 60% O2 content, where the breakdown voltage increased by 114% as the pressure rose from 0.1 to 0.4 MPa. In contrast, the largest increase was observed at 20% O2 content, with a 123% rise over the same pressure range.
Variation of AC breakdown voltage with pressure (slightly non-uniform field).
Figure 8 depicts the AC breakdown voltages of N2/O2 gas mixtures with varying O2 content when the field is slightly non-uniform. A slight fluctuation in breakdown voltage was observed as the O2 content changed. In the pressure range of 0.1–0.3 MPa, the gas mixture with 60% O2 had the highest AC breakdown voltage. The highest breakdown voltage was observed in the 50% O2 mixture at 0.4 MPa. Across the 0.1–0.4 MPa pressure range, the maximum breakdown voltage under varying O2 concentrations increased by 4.23%, 6.22%, 3.81%, and 2.17%, respectively, relative to the minimum breakdown voltage at each corresponding pressure. Overall, higher oxygen content enhanced the insulating property under this field condition within the 0.1–0.4 MPa pressure range.
Variation of AC breakdown voltage with O2 content (slightly non-uniform field).
2. Dielectric properties of N2/O2 gas mixtures when the electric field is high non-uniform
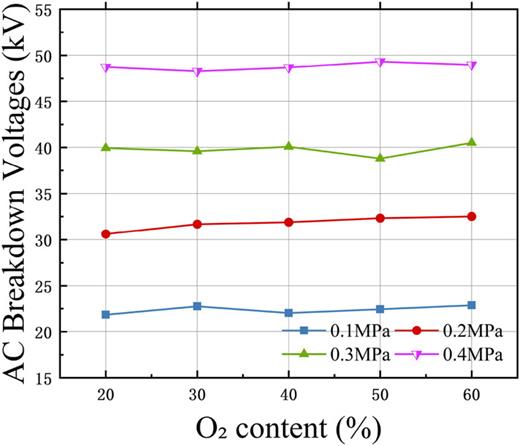
Figure 9 depicts the AC breakdown voltages of gas mixtures with gas pressure under a highly non-uniform field. The results indicate that, similar to the trend observed in a slightly non-uniform field, the AC breakdown voltage with varying oxygen content increased with rising gas pressure. However, compared to the slightly non-uniform field, this field condition of the needle–plane electrodes led to localized electric field strength concentration, resulting in a significantly lower AC breakdown voltage a rate of increase. Among the tested conditions, the smallest increase was observed at an oxygen content of 20%, with the breakdown voltage rising by 55.6% from 0.15 to 0.45 MPa, whereas the largest increase occurred at 40% oxygen content, with a 62.9% rise over the same pressure range.
Variation of AC breakdown voltage with pressure (highly non-uniform field).
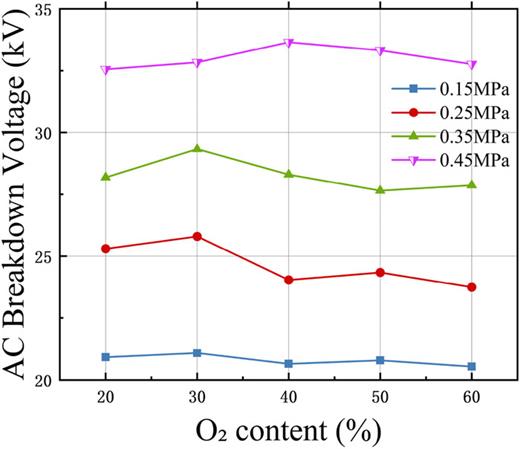
Figure 10 depicts the AC breakdown voltages with different O2 content when the electric field is highly non-uniform. As shown, the AC breakdown voltage under this field condition initially increased and then decreased with rising oxygen content. The highest AC breakdown voltage was observed at an oxygen ratio of 30% for pressures ranging from 0.15 to 0.35 MPa. When the pressure was increased to 0.45 MPa, it is at a 40% oxygen ratio that the N2/O2 gas mixture achieved its maximum AC breakdown voltage. From 0.15 to 0.45 MPa, the highest AC breakdown voltage exhibited increases of 2.67%, 8.63%, 6.06%, and 3.34%, respectively, compared to the lowest breakdown voltages. In general, there was an optimal mixing ratio under conditions of strong field non-uniformity at which the N2/O2 gas mixture achieved the highest AC breakdown voltage. Within the gas pressure range of 0.15–0.35 MPa, the N2/O2 gas mixtures with 30% oxygen content exhibited a higher AC breakdown voltage and superior insulating properties. When the gas pressure increased to 0.45 MPa, the gas mixtures with 40% oxygen content demonstrated even greater insulation performance.
Variation of AC breakdown voltage with O2 content (highly non-uniform field).
B. Sensitivity of N2/O2 gas mixtures to field non-uniformity
The data presented above indicate that the breakdown voltage variations of N2/O2 gas mixtures differed under varying degrees of field uniformity. In an electric field with low non-uniformity, the AC breakdown voltage increased by 114%–123% when the pressure was raised by three atm. In contrast, in an electric field with high non-uniformity, the increase was only 59%–63%, approximately half of that observed in the slightly non-uniform field. This difference arose because, at high gas pressures, the increased gas density shortened the electron mean free path, reducing the ionization probability. Meanwhile, under a highly non-uniform field, electrons gained energy more easily because the localized field strength was concentrated, which enhanced the collision ionization process and made discharge initiation more likely. As a result of the combined effects, the increase in insulation strength due to higher gas pressure was weakened when the electric field is severely non-uniform.
The average breakdown voltage fluctuation caused by variations in oxygen content was 4.11% for the plane–plane electrode configuration and 5.18% for the needle–plane configuration, which is consistent with the phenomenon discussed in Sec. III. Although certain practical factors may enhance the influence of oxygen content in the plane–plane configuration, its overall effect remained less significant than that observed in the needle–plane configuration. As the oxygen content increased, the breakdown voltages under the two electric fields exhibited different trends. In the slightly non-uniform field created by plane-plane electrodes, the breakdown voltage demonstrated better insulation performance with a high O2 ratio. However, in the highly non-uniform field generated by needle–plane electrodes, the highest breakdown voltage occurred at specific oxygen ratios (30% or 40% in the experiments).
Compared to the process of ionization, electron attachment plays a more critical role in ensuring insulation performance by inhibiting the initiation and expansion of electron avalanches.15 On the one hand, the electronegativity of O2 effectively adsorbs free electrons, which inhibits the development of electron avalanches, thereby increasing the insulating strength. On the other hand, the ionization potential energies of O2 and N2 are 12.2 and 15.58 eV, respectively.15,16 Since oxygen has a lower ionization potential than nitrogen, it is more susceptible than nitrogen to be impacted by accelerating electrons and leads to ionization. Therefore, an increase in oxygen content also enhances the collisional ionization process, facilitating the further development of electron avalanches.
Within a slightly non-uniform field, the gap field distribution is more uniform and breakdown is primarily governed by the insulating properties of the gas. Therefore, the electron attachment effect of oxygen is more dominant than ionization, leading to improved insulating performance at higher O2 ratios. In a highly non-uniform field, the localized field strength is significantly higher, which may intensify the ionization process of accelerated electrons colliding with oxygen. As a result, ionization becomes more dominant at higher O2 ratios. In addition, the development of streamer discharge when the electric field is highly non-uniform is more dependent on accumulation of space charge. The strong electron attachment effect of oxygen could, in turn, accelerate the initiation of streamer discharge. Combining the influence of multiple factors, the dielectric strength under conditions of strong field non-uniformity initially increases and then decreases as the oxygen content increased.
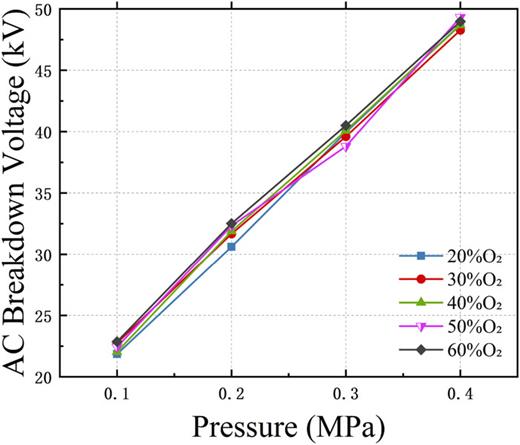
Figure 11 shows the trend of the AC breakdown voltage with respect to the field utilization factor , where is the reciprocal of the field inhomogeneity coefficient f. The degree of decrease in a gas’s insulating performance under a highly non-uniform field compared to a uniform field is defined as the gas’s sensitivity to the electric field.17 At 0.15 MPa, N2/O2 gas mixtures with 20%, 40%, and 60% oxygen content exhibited reductions in AC breakdown voltage of 20.25%, 23.42%, and 25.82%, respectively, under a highly non-uniform field, which indicates that an increase in the oxygen content at low atmospheric pressure enhances the sensitivity to the field. This difference decreases as the gas pressure rises.
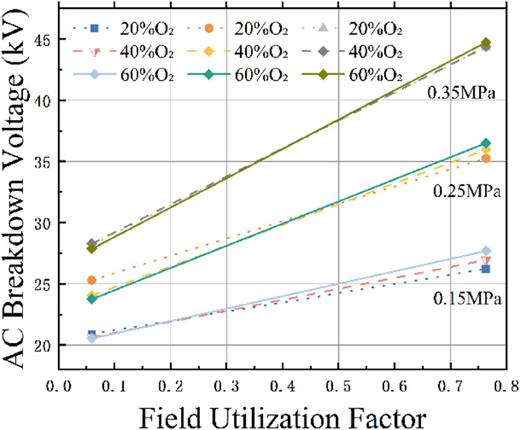
AC breakdown voltages according to the field utilization factor.
C. Streamer initiation criterion and experimental result
Figure 12 shows the trend of AC breakdown voltage as a function of gas pressure obtained by simulation and experiment. Under a highly non-uniform field and lower atmospheric pressure, the simulation results of AC breakdown voltages obtained using the streamer criterion showed good consistency with experimental results. However, as the gas pressure increased and the electric field became more inhomogeneous, the difference between experimental and calculated values became significant. A similar trend was observed in Ref. 18, where the difference between experimental and calculated breakdown voltages became more pronounced at higher pressures. In addition, the study in Ref. 12 also found that the more inhomogeneous the field, the greater the deviation between the calculated and experimental breakdown field strengths.
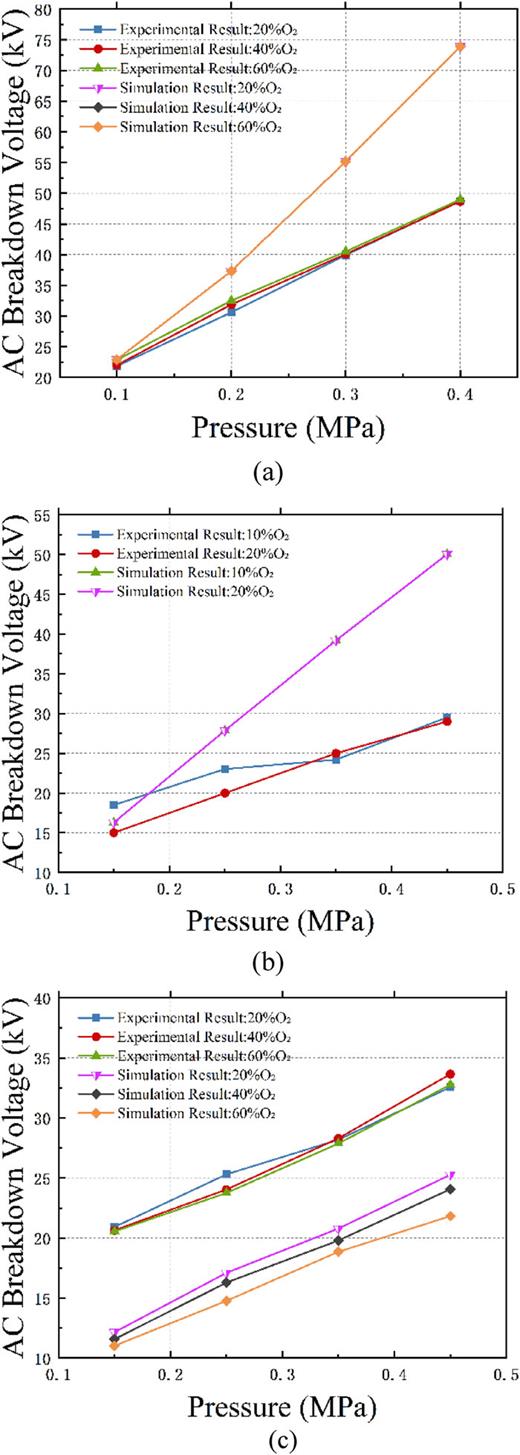
AC breakdown voltage with gas pressure obtained by the simulation and the experiment. (a) Plane–plane electrodes (f = 1.31). (b) Rod–plane electrodes11 (f = 1.56). (c) Needle–plane electrodes (f = 16.9).
The occurrence of this error may be attributed to the value of k, which is a logarithm of the critical charge number Ncrit. Ncrit may be related to the discharge conditions, suggesting that k should be a function of electric field inhomogeneity, pressure, and other factors. Most existing studies on k have corrected its value by experimental results,19–21 and the correction process essentially compensated for the deviation of the energy threshold of the model. As observed in Figs. 12(a) and 12(b), the trend of deviation between the calculated and experimental values remained relatively consistent for similar levels of electric field inhomogeneity. This reveals a predictable pattern in the relative deviation, and a dimensionless correction factor a is introduced here, expressed as
(3)
where UC is the calculated value and UE is the experimental value. This factor essentially characterizes the systematic deviation of the simulation model from the actual physical process. Its variation is primarily influenced by several factors, including simplification of the electron avalanche development path, neglect of surface effects, and limitations of the underlying physical databases.
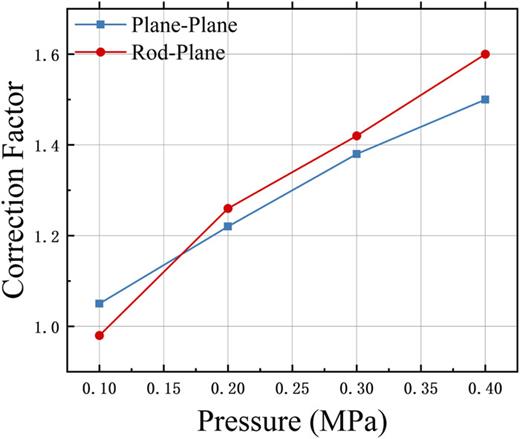
Figure 13 shows the variation of a with gas pressure under plane–plane and rod–plane electrode arrangement at an oxygen concentration of 20%. It is evident that the trends of the correction factor a with air pressure for different electrode configurations are highly coincident when the electric field inhomogeneity coefficient f is similar. This consistency suggests that the breakdown voltage of complex insulation gaps can be predicted using a calibration approach primarily governed by electric field inhomogeneity. This method provides a potential new pathway for predicting breakdown voltages. Benchmark data for a (f, P) are obtained through experiments with typical electrode configurations, enabling the establishment of a corresponding mapping database. In practical applications, the process involves calculating the f value for the given electrode structure, referencing the (f) curve at the current air pressure P, and applying the correction formula (4) to derive the engineering breakdown voltage,
(4)