Article Content
INTRODUCTION (PDF)
Titanium dioxide (TiO2), as an important semiconductor material, can be extensively employed in environmental- and energy-related fields, particularly in photocatalysis, such as photocatalytic degradation of organic pollutants, photocatalytic water splitting for H2 production, and dye-sensitized solar cells,1–4 due to its environmental friendliness, good chemical and thermal stability, low cost, and high resistance to photocorrosion. The TiO2 semiconductor can act as a photocatalyst for light-induced photochemical reactions because of its unique electronic structure, where the band positions of TiO2 are suitable for redox reactions involved in the photocatalytic process.4 In comparison to zero-dimensional, one-dimensional, or two-dimensional TiO2 materials, three-dimensional TiO2 exhibits a higher specific surface area and distinct functions, such as tunable anisotropy of transmission performance, dimensional adjustability, and ability to control interaction with light through photon effects. Therefore, three-dimensional TiO2 is widely used in photovoltaic cells,5–10 photocatalysis and photoelectrochemistry,11–16 electrochemical energy storage,17–19 self-cleaning,20,21 and other fields. However, TiO2 can only absorb ultraviolet light, which limits its absorption and utilization of sunlight; on the other hand, as a powder catalyst, there are problems such as difficulty in recovery, which also limits its commercial application. It has great significance in constructing a suitable hierarchical structure of three-dimensional TiO2 composite film.
One of the effective ways for broadening the light absorption of TiO2 and improving the photocatalytic efficiency is to combine TiO2 with a narrow bandgap semiconductor,22–24 which serves as a photosensitizer. With a direct bandgap of 2.42 eV, cadmium sulfide (CdS) is an important visible-light-responsive semiconductor. Among different semiconductor heterostructures, TiO2/CdS has great potential as an effective photocatalyst,25 due to their staggered band alignments, which can not only broaden light absorption but also promote charge spatial separation. However, so far, TiO2/CdS heterojunctions exist mostly in the form of colloids, composite particles, a mixture of CdS and TiO2, and thin films.26–30
In this paper, we successfully prepared a hierarchical TiO2/CdS film by combining the hydrothermal method with the successive ionic layer adsorption and reaction (SILAR) method using Ti foil as the substrate. The conditions for the synthesis process of the structural film and the photocatalytic degradation efficiency of phenol solution were systematically studied. The experimental results indicate that the TiO2/CdS hierarchical structure film exhibits excellent stability and good environmental performance.
Based on this strategy, the coupling of CdS with TiO2 can be achieved using CdCl2 and Na2S as the starting materials. The as-prepared TiO2/CdS-5 film showed a greatly enhanced photo-catalytic activity of 98.7% toward the photodegradation of phenol under visible light. Furthermore, the degradation ratio is still more than 90% after ten cycles. The remarkable enhancement is due to the increased optical absorption of visible light and inhibition of photo-induced electron–hole recombination via the coupling of CdS. This synthesis is promising for large-scale and low-cost production of TiO2/CdS photocatalysts with a high catalytic efficiency. Furthermore, the TiO2/CdS hierarchical film, with a narrower bandgap within the visible range, acts as a water-splitting catalyst under solar light irradiation and as photoanodes in the harvest of solar energy.
II. EXPERIMENTAL SECTION
A. Synthesis of TiO2 hierarchical film
15 × 15 × 1 mm3 commercial titanium (purity 99.7%) foil was used as the Ti source and the substrate. A 50 ml Teflon-lined stainless steel autoclave was filled with 10 ml of 0.5M aqueous NaOH solution. In order to prepare the samples, the Ti foils were first ultrasonically cleaned using acetone, ethanol, and deionized water, then treated with acid for 15 min before the reaction to remove surface oxides, and finally dried in a N2 stream. The cleaned Ti foil was transferred to the autoclave horizontally, and the system was kept at 180 °C for 24 h. After hydrothermal reaction, the resulting white samples were rinsed with deionized water multiple times and immersed in 1M HCl solution for 1 h. Finally, the as-prepared samples were annealed in a N2 stream at 500 °C for 2 h with a heating rate of 2 °C min−1. As a result, the hierarchical structure composed of TiO2 nanosheets and nanotubes was obtained on the Ti foil.
B. Synthesis of TiO2/CdS hierarchical film
The SILAR method was used to deposit CdS nanoparticles on the TiO2 layered film. The TiO2 hierarchical film prepared above was successively placed into 0.5M aqueous CdCl2 solution for 5 min at first and then exposed to 0.5M aqueous Na2S solution for another 5 min. This SILAR process was repeated three, five, seven, and nine times until the required CdS nanoparticle deposition was obtained. The light yellow samples were denoted as TiO2/CdS-3, TiO2/CdS-5, TiO2/CdS-7, and TiO2/CdS-9, respectively.
C. Catalytic tests
The photocatalytic activity of TiO2/CdS hierarchical films was evaluated by photodegradation of aqueous phenol solution under irradiation of visible light at 25 °C. A Xe arc lamp (500 W) and beaker (150 ml) were used as the source of visible light and photo-catalytic reactor, respectively. In a typical reaction, a piece of TiO2/CdS film was vertically placed in 100 ml phenol solution (100 mg l−1). In order to achieve an adsorption–desorption equilibrium, the reaction system was kept in the dark for 1 h prior to illumination. During the irradiation, 3 ml of phenol solution was withdrawn at every interval. The phenol solution concentration was measured by UV–vis absorption spectroscopy.
III. RESULTS AND DISCUSSION
A. Characterization of TiO2/CdS hierarchical film
The structural properties of the as-prepared samples were analyzed by XRD (Fig. S1, supplementary material). The XRD patterns can be indexed to pure anatase phase TiO2 (JCPDS card no. 21-1272),31 and one weak peak at about 26.5° can be assigned to the (002) crystal facet of CdS (JCPDS card no. 41-1049). This indicates the inadequate content and minuscule size of CdS nanoparticles.32,33
The morphological features of the TiO2 film and TiO2/CdS film were observed by FESEM. The TiO2 film exhibited a hierarchical structure, which composed of oriented nano-flowers with large scale nanosheets uniformly grown on the surface of TiO2 nanotube arrays [Fig. S2(a), supplementary material]. These dense regular nanosheets ∼2 μm in length and ∼250 nm in thickness tend to grow vertically on the Ti foil. The lattice fringes on the surface of the TiO2 nanosheet and nanotubes are clearly visible, showing a lattice spacing of 0.347 nm, corresponding to the (101) crystal plane of the anatase phase TiO2 [Fig. S2(b), supplementary material]. As shown in Fig. 1(a), after the deposition of CdS, a rougher surface can be observed on the TiO2/CdS-5 composite film. The corresponding EDS spectrum [Fig. 1(b)] indicates the presence of Cd and S on the surface of TiO2 nanosheets. The TEM image [Fig. 1(c)] displays that the TiO2 nanosheets retained the hierarchical structure after five deposition cycles, indicating that the Cd2+ and S2− ions can diffuse to the surface of the nanosheets and form nano-crystallites.
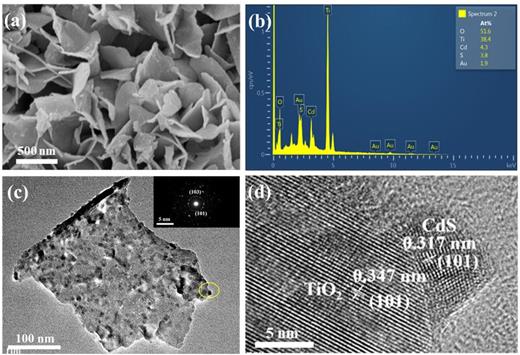
(a) FESEM image of TiO2/CdS-5; (b) its corresponding EDS spectrum; (c) TEM image and (inset) SAED pattern of TiO2/CdS-5; (d) high-resolution TEM image of TiO2/CdS-5.
The high-resolution TEM image [Fig. 1(d)] shows that the lattice spacing is the same as that of TiO2 nanosheets and indicates that the presence of CdS nanoparticles can be further confirmed by high-resolution TEM results [Fig. 1(d)]. As shown in Fig. 1(d), the lattice fringe of 0.347 nm is indexed to the (101) crystal facet of TiO2, while the lattice spacing of 0.317 nm is indexed to the (101) crystal facet of the CdS particles.34 Furthermore, the corresponding EDS spectrum in Fig. 1(b) verifies the presence of Ti, O, S, and Cd elements. The selected-area electron diffraction (SAED) of the TiO2/CdS-5 composite film [the inset in Fig. 1(c)] can refer to the (101) and (103) facets of the anatase TiO2 nanosheets. Obviously, it verifies the successful deposition of CdS nanoparticles onto the TiO2 film.
With the increase in the deposition period, CdS nanocrystals have two different growth types,33 including the formation of new crystals and the growth of smaller crystals. In order to evaluate the effects on the film, we tracked the CdS deposition at different cycles by measuring the FESEM images and absorption spectra. The magnified FESEM images of TiO2, TiO2/CdS-3, TiO2/CdS-5, TiO2/CdS-7, and TiO2/CdS-9 samples are shown in Fig. S3 (supplementary material). Figure S3(a) (supplementary material) shows the smooth surface of the TiO2 nanosheet without the deposition. Its corresponding EDS spectrum indicates the absence of CdS. A small amount of CdS nanoparticles were deposited on the surface of TiO2 nanosheets after three cycles, as shown in Fig. S3(b) (supplementary material). After five cycles, the amount of CdS nanoparticles increases obviously and shows a uniform dispersion on the surfaces of TiO2 nanosheets. With the increase in deposition times to nine cycles, the number and particle size of CdS nanoparticles gradually increased and deposited on the surface of TiO2 nanosheets [Figs. S3(c) and S3(d) in supplementary material]. As the deposition amount increases, the CdS grains gradually grow and the size becomes large. It seems that the first type of growth holds a dominant position. It can be seen from the corresponding EDS spectrum in Figs. S3(e)–S3(h) that as the number of depositions increases, the content of CdS particles on the surface of the nanosheets increases gradually, but this does not affect the morphology of the underlayer of the film.
To characterize the elemental chemical status and chemical composition, high-resolution XPS spectra were studied for the as-synthesized samples (Fig. 2). Figure 2(a) shows the comparison of the XPS spectrum of Ti 2p before and after deposition. The Ti 2p XPS spectrum exhibits two peaks at 458.78 eV (Ti 2p 3/2) and 464.33 eV (Ti 2p 1/2), in good agreement with the characteristic values for TiO2.35 The O 1s XPS spectrum, shown in Fig. 2(b), indicates that the two peaks at 529.93 and 531.53 eV are attributed to the oxygen atoms (Ti–O bond) and the surface O–H species, respectively.36 According to the results of the O 1s spectrum, the –OH content on the surface of the sample increases from 18.9% to 31.6%, which is due to the increased oxygen vacancies combining TiO2 with CdS and increases the adsorption of oxygen on the surface.37,38 The S 2p spectra [Fig. 2(c)] show two obvious peaks at 161.43 (S 2p3/2) and 162.68 eV (S 2p1/2), which can be attributed to sulfide, in excellent agreement with the reported results for CdS.39 Figure 2(d) shows the Cd 3d spectrum with a band energy at 405.18 and 411.88 eV, which is related to Cd 3d5/2 and Cd 3d3/2 eV, respectively.40,41 In addition, it was found that the combination of TiO2 and CdS nanoparticles has no effect on the chemical state of Ti 2p.
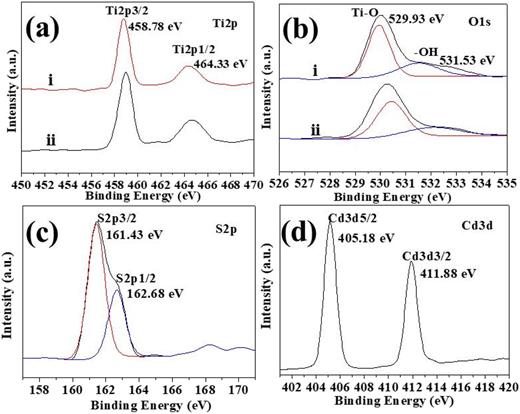
XPS spectra of samples: (a) Ti 2p; (b) O 1s; (c) S 2p; (d) Cd 3d (i. TiO2/CdS-5 composite hierarchical film; ii. TiO2 hierarchical film).
Figure 3 presents the typical absorption spectra of the TiO2 hierarchical film and TiO2/CdS hierarchical films with different SILAR cycles. The absorption edge of TiO2 appears at 380 nm. The absorption edge of the TiO2/CdS composite film red-shifted to 514 nm, which is close to the bandgap of CdS (2.4 eV). With the increase in CdS nanoparticles on TiO2, the absorption intensity increases, and the absorption edge gradually shifts toward longer wavelengths throughout the UV–vis region. These results indicate that the TiO2/CdS hierarchical structure possesses superior optical properties. The corresponding Tauc plots are constructed. As shown in Fig. S4 (supplementary material), the bandgap energy of TiO2 hierarchical film is 2.68 eV, while the bandgap energy of TiO2/CdS hierarchical films obtained with deposition for three, five, seven, and nine cycles is calculated to be 1.74, 1.65, 1.72, and 1.78 eV, respectively. It implies that the composition of CdS nanoparticles can enhance the light absorbance for TiO2. With an increase in the deposition cycles, which was less than five times, the absorption intensity increases in the wavelength range from 400 to 550 nm, resulting in an increase in the amount of CdS.42 Due to its hierarchical structure and narrow bandgap, which is slightly smaller than the reported bandgap energy of TiO2,35,43 a single TiO2 film has good light absorption property in the wavelength range from 400 to 800 nm. It should be pointed out that the adsorption bands of TiO2/CdS films show little variation, changing from 1.78 to 1.65 eV. This is in good agreement with the reported results.44,45 In our study, by combining with a narrow bandgap CdS semiconductor, the light absorption property of the TiO2 hierarchical structure film can be effectively improved.

UV-visible absorption spectra of TiO2/CdS hierarchical films obtained under the different deposition cycles.
B. PL spectra
The PL spectrum reflects the separation and recombination of photo-induced charge carriers in semiconductors. It is influenced by trapping, migration, and transfer of photo-induced electrons and holes.46,47 The PL spectra of TiO2/CdS films were obtained at room temperature (excitation wavelength: 325 nm). As shown in Fig. 4, three main peaks can be reflected. The first peak, observed at 397 nm, is attributed to the bandgap transition.47 The emission peaks at 452 and 469 nm are a result of oxygen defects.43,48 Compared with the TiO2 film, the PL intensities of the TiO2/CdS significantly decrease, implying that the recombination rate of photo-induced charge carriers in the TiO2/CdS composite film is lower. This suggests that the PL intensity of TiO2/CdS decreases as the deposition cycles increase from three to seven times, indicating that the more CdS nanoparticles are deposited on the surface of TiO2 nanosheet, the slower the recombination of electron–hole pairs. In addition, this indicates that the combination of a proper amount of CdS nanoparticles can effectively promote the separation of photogenerated electron–hole pairs within an appropriate range, while the excess CdS particles will form a new photogenerated charge carrier. The recombination sites, in turn, accelerate the recombination rate of photogenerated electron–hole pairs. For TiO2/CdS-5, it has proper aggregation of CdS nanoparticles. Moreover, the increasing number of depositions leads to a significant decrease in the relative intensity of the intrinsic excitation peaks, indicating the creation of additional oxygen defects with the deposition of more CdS nanoparticles.49
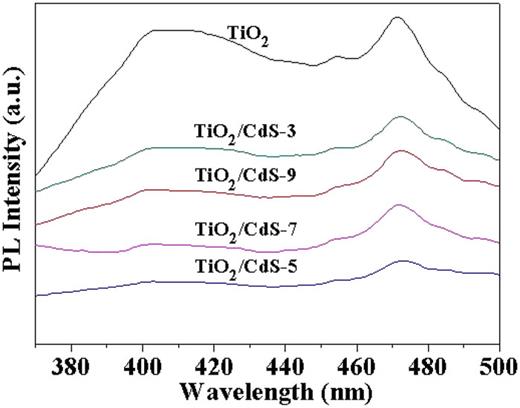
PL spectra of different TiO2/CdS hierarchical films obtained under the different deposition cycles.
C. Photocatalytic activity
To evaluate the catalytic performance of the TiO2/CdS hierarchical films obtained under visible light irradiation, we conducted an experiment using phenol as a model pollutant. The concentration of phenol solution was measured using UV-visible absorption spectroscopy. Figure 5(a) plots the variation in the relative concentration of phenol aqueous solution with the irradiation time. Obviously, the degradation ratio of phenol solution is about 6.5% without using any catalyst, while it increases to 58.9% with bare TiO2 hierarchical film as the catalyst. The TiO2/CdS-5 film displays an excellent visible light catalytic degradation efficiency of 98.7%. Meanwhile, the four batches of photocatalysts are prepared and their photocatalytic performances are evaluated. The yellow TiO2/CdS-5 films present higher photocatalytic efficiency than bare white TiO2 films [see Fig. S5 (supplementary material)]. A blank experiment was also conducted under visible light irradiation in the absence of any photocatalyst. The degradation ratio of phenol solution is merely 6.1%, manifesting that photocatalysts play a dominant role. It indicates their higher photocatalytic performance and good reproducibility of the fabrication procedure, implying their potential application in photocatalytic degradation.
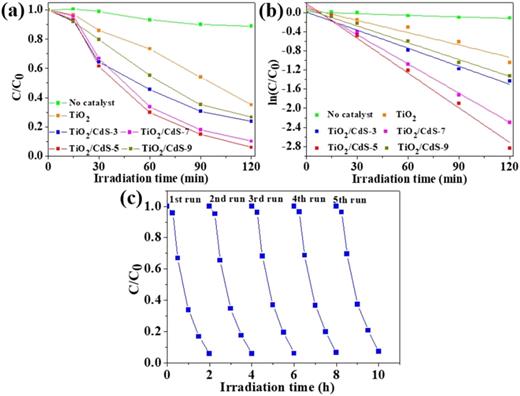
(a) Photocatalytic degradation of phenol on different samples under visible light irradiation; (b) kinetic fitting curve of ln(C/C0) vs irradiation time; (c) life cycle performance of TiO2/CdS-5 film.
The photocatalytic degradation performance of the composite film gradually improves with each additional deposition, indicating a positive correlation between deposition times and performance enhancement. When the number of depositions increases to seven or nine times, the visible light catalytic performance of the sample decreases. It is shown that within a proper concentration range, the combination of TiO2 with CdS can reduce the recombination ratio of photogenerated carriers, while excessive CdS recombination will form a new active center, which could promote the recombination of photogenerated carriers, reducing photocatalytic activity. The TiO2/CdS hierarchical film also plays a significant role in the catalytic degradation of phenol, which is in line with previous research. Meanwhile, four batches of photocatalysts are prepared and their photocatalytic performances are also evaluated. Figure S5 plots the variation in the relative concentration of phenol aqueous solution with the irradiation time. The error bars represented by vertical lines indicate that the photocatalytic performance of the photocatalysts fluctuated within certain range. After 120 min of illumination, the average phenol degradation ratio over bare white TiO2 film and yellow TiO2/CdS-5 film can reach 58.5% and 98.6%, respectively.
Furthermore, the photocatalytic performance of TiO2/CdS films can be quantitatively evaluated by comparing their apparent reaction rate constants using first order dynamic expression. It can be expressed as ln(C0/C) = kapp t, where kapp is the first order reaction rate constant, and C0 and C represent the concentration of phenol solution at t = 0 and t = t, respectively. Therefore, kapp can be obtained from the linear time dependence of ln(C/C0), as shown in Fig. 5(b). The apparent rate constants of TiO2/CdS thin films prepared by blank, 0, 3, 5, 7, and 9 cycles were calculated to be 0.0580, 0.524, 0.719, 1.42, 1.15, and 0.662 h−1, respectively. Apparently, the TiO2/CdS-5 film prepared with five cycles displays the highest rate constant, implying its highest photocatalytic activity.
For a heterogeneous catalyst, it is important to evaluate its stability and reusability in catalytic reactions. The catalytic performance of the TiO2/CdS-5 film was tested during five consecutive experimental runs. As shown in Fig. 5(c), the phenol removal efficiency still reached more than 95% after five catalytic cycles. With further extension of the testing, the degradation rate still reaches over 90% [Fig. S6(a), supplementary material]. After ten catalytic cycles, the morphology of the TiO2/CdS-5 film remains intact vertically on the Ti foil. In addition, its corresponding EDS spectrum verifies the presence of Cd elements, and its content is almost the same as that before the cycles shown in Fig. S6(b) (supplementary material). No significant decrease and damage in the catalytic activity and structure can be observed, which demonstrates its excellent stability and long lifetime.
IV. CONCLUSIONS
TiO2/CdS hierarchical films were successfully synthesized via a SILAR method. The structures of the catalysts were systematically characterized by different techniques, including XRD, SEM, HRTEM, UV-visible absorption spectra, and PL spectrum. Photocatalytic degradation of phenol solution demonstrates that TiO2/CdS-5 hierarchical films have higher photocatalytic efficiency than TiO2 films under visible light irradiation at room temperature. By combining the TiO2 hierarchical film with CdS nanoparticles, the recombination rate of electrons and holes can be effectively reduced, which results in improved photocatalytic performance. The results also show that the electronic energy band structure of TiO2 can be improved by adjusting the morphology structure and compositing with narrow bandgap semiconductors, which extends the absorption range of sunlight and enhances the visible light catalytic activity. The phenol degradation ratio over the TiO2/CdS-5 composite film can be more than 90% after ten cycles. Meanwhile, almost no cadmium was released. It indicates its excellent structural stability and good environmental performance. Their unique hierarchical structures facilitate postseparation and increase their feasibility for engineering applications. This work opens a new avenue to large-scale preparation of potential TiO2/CdS hierarchical film photocatalysts and expects their wide range of application in environmental remediation.