Article Content
Abstract
Background
Predicting protein structural similarity and detecting homologous sequences remain fundamental and challenging tasks in computational biology. Accurate identification of structural homologs enables function inference for newly discovered or unannotated proteins. Traditional approaches often require full 3D structural data, which is unavailable for most proteins. Thus, there is a need for sequence-based methods capable of inferring structural similarity efficiently and at scale.
Result
We present Rprot-Vec (Rapid Protein Vector), a deep learning model that predicts protein structural similarity and performs homology detection using only primary sequence data. The model integrates bidirectional GRU and multi-scale CNN layers with ProtT5-based encoding, enabling accurate and fast similarity estimation. Rprot-Vec achieves a 65.3% accurate similarity prediction rate in the homologous region (TM-score > 0.8), with an average prediction error of 0.0561 across all TM-score intervals. Despite having only 41% of the parameters of TM-vec, Rprot-Vec outperforms both public and locally trained TM-vec baselines in all tested settings. Additionally, we constructed and released three curated training datasets (CATH_TM_score_S/M/L), supporting further research in this area.
Conclusion
Rprot-Vec offers a fast and lightweight solution for sequence-based structural similarity prediction. It can be applied in protein homology detection, structure-function inference, drug repurposing, and other downstream biological tasks. Its open-source availability and released datasets facilitate broader adoption and further development by the research community.
Introduction
Protein structure similarity prediction is a crucial area of protein-related research, with the core objective of evaluating the three-dimensional structural similarity between two proteins using computational methods, thereby enabling more in-depth downstream analyses.
By constructing a protein structure similarity prediction model, we can represent proteins as multidimensional vectors, allowing for the modeling of proteins and facilitating the study of their evolutionary relationships. Even when the sequences of two proteins are significantly different, if their structures are similar, these two proteins are likely to have similar functions and may share a common evolutionary origin [1].
Moreover, this approach can be used to predict the functions of previously unknown proteins. Many studies have demonstrated that the structure and function of proteins are closely linked [2, 3]. If a protein with an unknown function shows high structural similarity to a protein with a known function, it is highly probable that the unknown protein shares that function. This method can also be applied to build a fast-query protein database, enabling quick screening and analysis of structurally similar proteins from large datasets, ultimately making subsequent queries and research more efficient.
Research on efficient and automated tools for comparing the three-dimensional structures of proteins dates back to the 1990s, when the first direct analyses were conducted by comparing protein structures. Holm et al. proposed the DALI method in 1995, a dynamic programming algorithm that calculates the distance relationship between main-chain atoms in protein structure to find the optimal alignment [4]. The DALI method uses the Z-score as a similarity indicator to assess the significance of the comparison results. A high Z-score indicates that the comparison is statistically significant, meaning the structures of the two proteins have a high degree of similarity. The core algorithm of DALI has been borrowed by numerous subsequent algorithms, laying the foundation for modern protein structure alignment frameworks.
In 1998, Shindyalov et al. introduced the CE (Combinatorial Extension) method, which extends local structural fragments of proteins to construct global structural alignments [5]. In contrast to the DALI method, which focuses more on global alignment, the CE method balances structural flexibility and accuracy by gradually aligning proteins through local fragments. The CE method uses RMSD as its similarity evaluation metric. RMSD represents the average deviation of atomic pairs after aligning two proteins, where a smaller RMSD value indicates higher structural similarity. The fragment extension approach of the CE method has also inspired subsequent related research.
In 2005, Zhang et al. proposed the TM-align method, which can quickly and accurately compare the three-dimensional structural similarity of two proteins [1]. The TM-align method simultaneously captures both global alignment and local structural features of proteins, using TM-score as an evaluation metric, which enables a fair comparison of proteins of different lengths. As a result, the TM-align method has been widely applied in protein structural biology, including protein function prediction, evolutionary relationship analysis, and other fields.
In recent years, with the continuous development of artificial intelligence (AI), it has gradually been applied to various fields of scientific research. Deep learning, a critical technology within AI, is now widely used. The core of deep learning lies in processing complex data and tasks by simulating the neural networks of the human brain. It utilizes multi-layered artificial neural networks that extract features from large training datasets through stacking, gradually learning the patterns within the data. Consequently, deep learning is a method with powerful representation and automated feature extraction capabilities.
In the prediction of protein structure similarity, traditional methods have relied on protein structure data for calculations. However, according to the protein data bank (PDB), less than 0.1% of proteins have known three-dimensional structures, while the vast majority of protein sequences have known gene codes [6]. Therefore, using a model that can quickly predict protein structure similarity without requiring the prediction of protein structures is a promising approach.
In addition to structural alignment methods, sequence-to-structure threading algorithms such as HHpred and Phyre2 have been widely used to predict protein structures by aligning sequences to known structural templates [7, 8]. These methods infer the three-dimensional fold from sequence similarity to known structures, but they rely heavily on template availability and accurate structure prediction.
Hamassy, T. et al. proposed the TM-vec method in 2023, which predicts structural similarity by calculating the TM-score, a measure of structural similarity, between two protein sequences [9]. This model leverages the ProtT5 [10] for pre-coding, and its architecture incorporates the encoder component of the Transformer along with a fully connected layer. The protein sequence is encoded into a fixed-length vector through this model, and the cosine similarity between protein pairs is calculated to derive the final TM-score. TM-vec provides an efficient and accurate tool for predicting protein structure similarity and can perform predictions without requiring the actual protein structure, thus laying the foundation for further research in this field.
In this paper, we propose the Rprot-Vec model, which offers faster training speed and is more suitable for smaller datasets. This method builds on the idea from TM-vec, using protein sequence pairs directly to predict structural similarity, and introduces the use of bidirectional GRU (Gated Recurrent Unit) [11] instead of Transformer blocks in smaller models. Additionally, convolutional neural networks (CNN) are used to extract features across different dimensions. By employing bidirectional GRU in place of Transformer blocks and reducing the training dataset requirements, the model can achieve better performance with smaller datasets, significantly reducing training time. Regarding model performance, Rprot-Vec demonstrates strong results with homologous protein pairs and can accurately identify and classify homologous proteins. Furthermore, the dataset plays a crucial role in training; however, since TM-vec has not publicly released its training dataset, its contribution to subsequent research and training work is limited. Therefore, this paper also aims to publicly disclose the training dataset used, to facilitate future research and development in this field.
Methods
In this paper, we propose the Rprot-Vec model, which uses ProtT5 [10] as the encoder for protein sequences, encoding each amino acid according to its context. The primary architectures of the model consist of Bi-GRU (Bidirectional GRU) and multi-scale CNN. The Bi-GRU is responsible for further extracting contextual features of the entire sequence, while the multi-scale CNN employs convolution kernels of different sizes to capture local features at multiple scales. The model architecture is shown in Fig. 1.
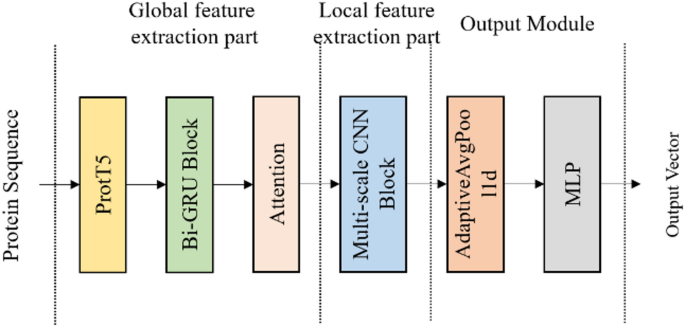
The model structure of the Rprot-vec
In our method, the ProtT5 model receives the raw protein sequence and outputs a vector, converting each amino acid into a fixed-dimensional representation. Although there are only 20 standard amino acids, due to contextual influence, even identical amino acids can be encoded into different vectors. By utilizing ProtT5 as the upstream model, we extract rich contextual features while encoding, providing valuable feature inputs for downstream tasks.
Additionally, we used Bi-GRU to extract global features. Bi-GRU is an extension of the standard GRU [11], designed to process sequences in both forward and reverse directions. The advantage of this approach is that it can capture dependencies in both directions, thus better understanding bidirectional relationships in sequential data. The internal structure of the Bi-GRU block used in our model is shown in Fig. 2.
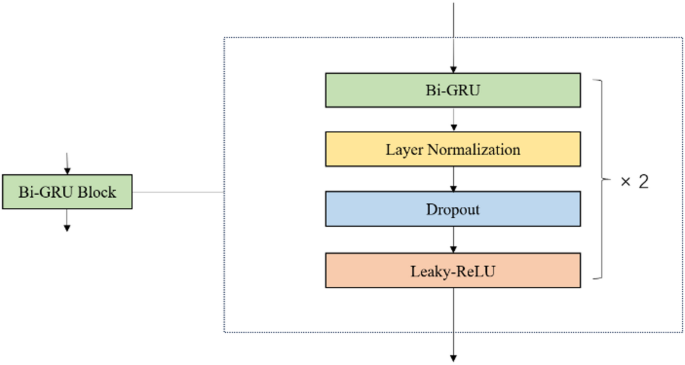
The internal structure of the Bi-GRU Block
After the Bi-GRU block, an attention layer is added. Through weighted aggregation, the amino acid features at each position can be directly associated with those of all other positions in the sequence, effectively compensating for the limitations of GRU and enhancing the model’s ability to process protein sequences.
In protein sequences, the length of locally important amino acid fragments can vary, and we need a method to capture these locally significant features. Therefore, we adopted a multi-scale CNN, which is more effectively at capturing local features in protein sequences. The specific internal structure of the multi-scale convolution block is shown in Fig. 3. We used two different convolution kernel sizes, 3 and 7, to capture local features at multiple scales.
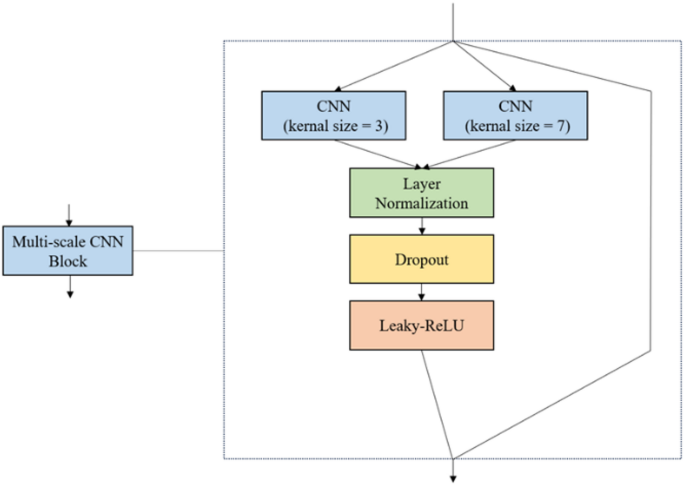
The internal structure of the Multi-scale CNN Block
We need to map the output of the convolutional layer to a fixed-dimensional vector, so we chose adaptive average pooling, which adjusts the length of each channel in the input sequence to a fixed target length while performing average pooling across the sequence. After passing through a fully connected layer, we obtain the fixed-length output vector that we need.
In the final similarity calculation section, we aim to represent the protein sequence in space using the output vector, and we also use this vector to calculate the final protein structure similarity score, TM-score. The positive half of cosine similarity ranges from 0 to 1. A value of 1 indicates that the two spatial vectors completely overlap, while a value of 0 signifies that the two vectors are orthogonal. Therefore, using the positive half of cosine similarity as the final metric is ideal for our current approach. When comparing two proteins with highly similar structures, we expect their TM-score values to be close to 1, and for spatial vectors to nearly overlap. For proteins with completely dissimilar structures and no homologous information, we aim for their TM-score values to be close to 0, with their spatial vectors appearing orthogonal.
Experiments
Dataset
In our paper, the dataset used for training was jointly generated using the US-align method [12] and the CATH protein database. Each dataset consists of three columns, namely protein sequence 1, protein sequence 2, and their protein structure similarity score (TM-score).
CATH database
The CATH database is dedicated to protein-related research and is organized around four main levels: Class, Architecture, Topology, and Homologous Superfamily. It is widely used for studying the structure, function, and evolutionary relationships of proteins. The CATH database combines automated algorithms and manual annotation to ensure accuracy and reliability [13,14,15].
In our method, we first downloaded partial sequence data protein with known three-dimensional structures. Using automated scripts, we downloaded the corresponding sequence and 3D structure data files (PDB) based on the protein names, followed by filtering and clarification operations. After the final filtering, we obtained approximately 120k protein sequences and their corresponding 3D structure files.
US-align method
The US-align (Universal Structure Alignment) method is a structural alignment-based calculation tool primarily used to compare the similarity between protein 3D structures [12]. US-align can handle protein structures of varying lengths and shapes, offering good robustness. The algorithm uses an iterative optimization strategy, allowing it to converge quickly and more efficiently than the original TM-align method. TM-align method is another structural alignment algorithm that uses the TM-score as its objective function to evaluate the similarity of protein structures [1]. US-align improves upon TM-align, broadening its application and enhancing its performance.
In our research, we chose US-align as the tool for generating the training dataset. Firstly, it directly calculates the TM-score based on three-dimensional structures, making it a relatively new and highly accurate computational tool. Additionally, its efficient performance enables rapid dataset generation. The specific flowchart for generating the dataset is shown in Fig. 4.
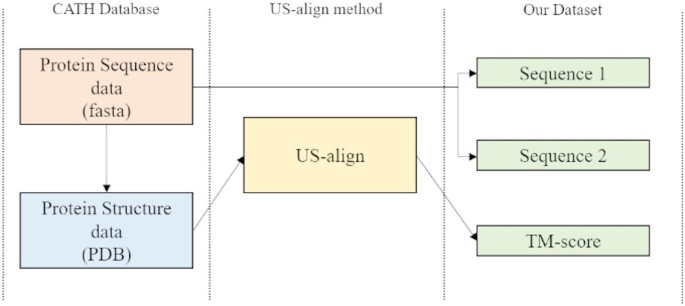
Flowchart for generating datasets
Dataset considered
Using the above method, we spent approximately 3 months generating around 1.08 billion unprocessed datasets, with a total file size of about 160 GB. However, upon observing the distribution of the dataset, we found that the majority of the proteins were structurally dissimilar. To ensure balance during the training process and avoid training the model on imbalanced datasets, we filtered this portion to achieve a more even distribution of TM-scores, ranging from 0 to 1. As a result, we obtained the filtered dataset.
To facilitate future research and meet the training needs of different tasks, we generated three filtered datasets of varying sizes, which we refer to as CATH_TM_score_S, M and L. The number of data entries and dataset sizes are shown in Table 1. All subsequent experiments in this study were conducted using the CATH_TM_score_M.
During the training process, after multiple adjustments and experiments, we decided to divide the dataset into a 95% training and 5% test split. The reason for the relatively small proportion of the test set is the large volume of our data. Despite its smaller size, the test set contains enough data to effectively evaluate the model’s performance.
Training configuration
The downstream model was trained using the Adam optimizer with a learning rate of 1e-4 and a batch size of 64. The loss function used was Mean Squared Error (MSE) between the predicted TM-score and the ground-truth score calculated by US-align.
In all experiments, we used the ProtT5-XL-UniRef50 model as the sequence encoder [10]. Each amino acid is encoded into a 1024-dimensional vector. The encoder’s parameters were frozen during training, and the resulting encoded sequence was passed through the downstream network consisting of Bi-GRU, multi-scale CNN, and fully connected layers to produce the final similarity score.
Further implementation details and training scripts are available on our GitHub repository: https://github.com/SuperZyccc/RProt-vec.
Result
To evaluate the performance of the model, we conducted various experiments on both our model and comparative models. The hardware used for all experiments was identical, with an RTX 4070 Ti 12GB graphics card, an Intel i7 13700k CPU, and 32 GB of memory. The dataset used in the experiments is the same test dataset that the model has never seen before. For model comparison, we will compare our model against the publicly available training model of TM-vec, the locally trained TM-vec model, and our own model. Since the TM-vec team has not yet released their training dataset, we also trained a local version to ensure fairness. In the following sections, we will refer to the TM-vec model trained on the publicly available dataset as TM-vec-remote, and the locally trained model as TM-vec-local.
Results across all TM-score intervals
To enable the model to encode protein sequences more accurately and achieve robust recognition of protein sequences, we aim for the model to perform well across all TM-score intervals.
If the model performs well in only a small subpart of the intervals and struggles with the majority, it suggests that the model has not fully learned the features of protein sequences, but rather has learned features specific to the local range. Therefore, in the final result validation stage, we will evaluate the model’s performance across all intervals.
According to the data in Table 2, we can see that our model has only 41% of the parameter count of TM-vec, making it a more lightweight model than TM-vec. In addition, our model has an average error of 0.0561 across all TM-score intervals, which outperforms the comparison model TM-vec, whether it is TM-vec-remote or TM-vec-local. Figure 5 shows the distribution of error within the specified interval. For better model performances, we expect a higher proportion of data points in the first bin, where the overall error is less than 0.05, and fewer data points with errors greater than 0.05. We can see that our model has a higher proportion of points in the lower error range, further demonstrating the superiority of our model.
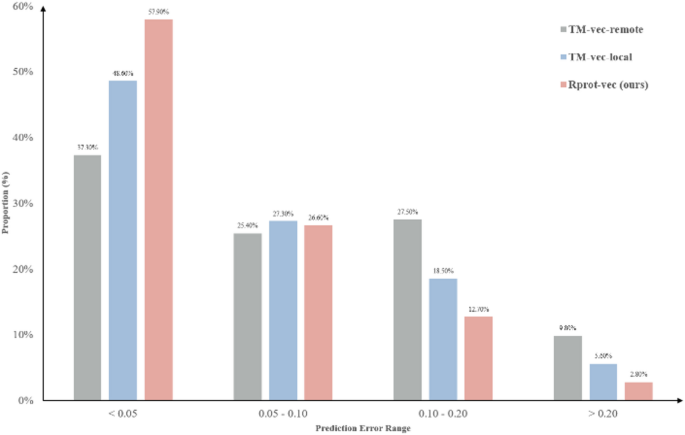
Error performance of different models in all TM-score intervals
In addition, the TM-vec models in Figs. 6 and 7, as well as our model in Fig. 8, use scatter plots to display each test data point on the coordinate axis, with differently colored points representing different error intervals. This approach helps to present the results more clearly.
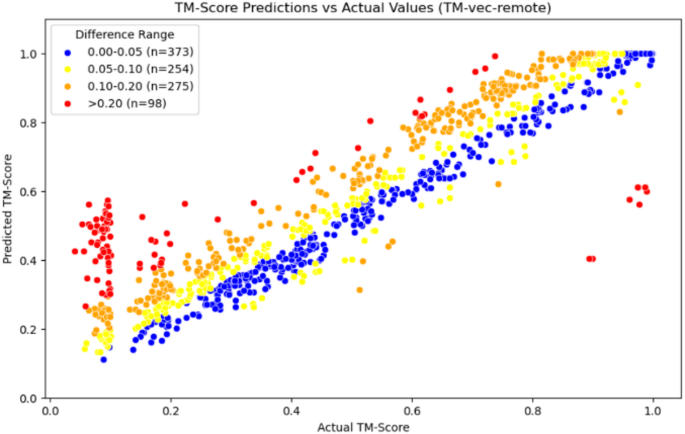
Scatter plot of TM-vec-remote
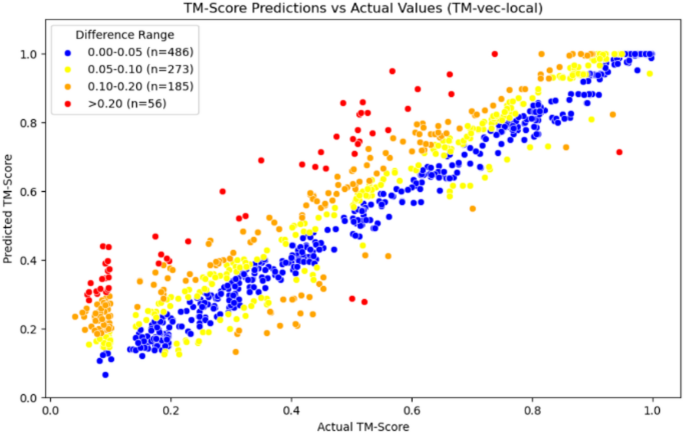
Scatter plot of TM-vec-local
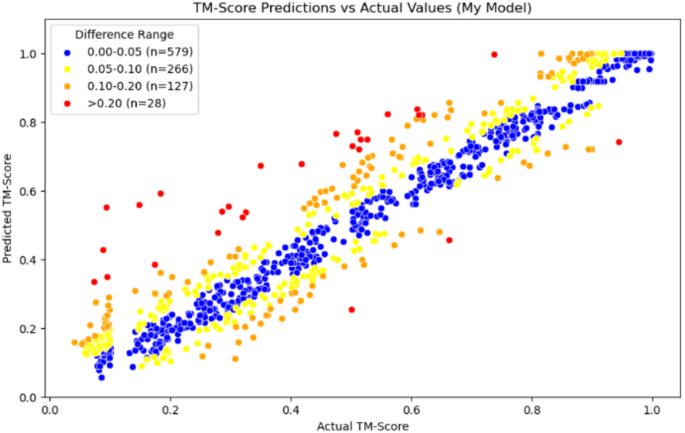
Scatter plot of Our Model
From the comparison of the three graphs above, we can observe that the TM-vec model has poor predictive ability when two proteins are completely dissimilar. It tends to predict two completely dissimilar proteins as partially similar, whereas our model performs well in this interval. Moreover, our model also shows good prediction results in other intervals.
Evaluation of homologous protein detection results
In the Introduction section, we mentioned that when the TM-score is greater than 0.8, the posterior probability of two proteins belonging to the same folding family approaches 1.0, which implies that the two proteins can almost be considered homologous. We refer to this region as the homologous region, and the model’s performance in this region is crucial, as it directly reflects the model’s ability to identify homologous proteins and determine whether it can correctly recognize them. Therefore, we need to re-evaluate the model’s performance specifically within the homologous region.
According to the data in Table 3, we can see that the average error of our model within the homologous region is 0.0438, which is better than the performance of the comparison model TM-vec, whether it is TM-vec remote or TM-vec local. Additionally, from Fig. 9, we can see that the accuracy prediction rate of our model reaches 65.3%, with more data being accurately predicted. In contrast, when using TM-vec remote, there are more outliers, with a failure prediction rate (Error > 0.2) as high as 5.7%, and more homologous proteins fail to be recognized. We also plotted scatter plots for the homologous region, with Figs. 10, 11 and 12 showing the scatter plots for TM-vec-remote, TM-vec-local and our model in the homologous region.
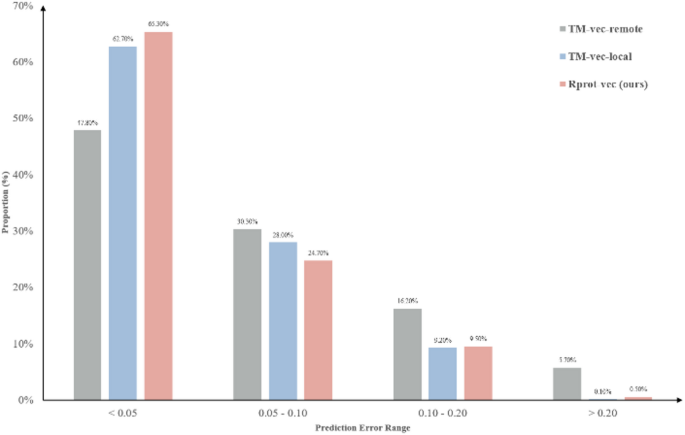
Error performance of different models in homologous region
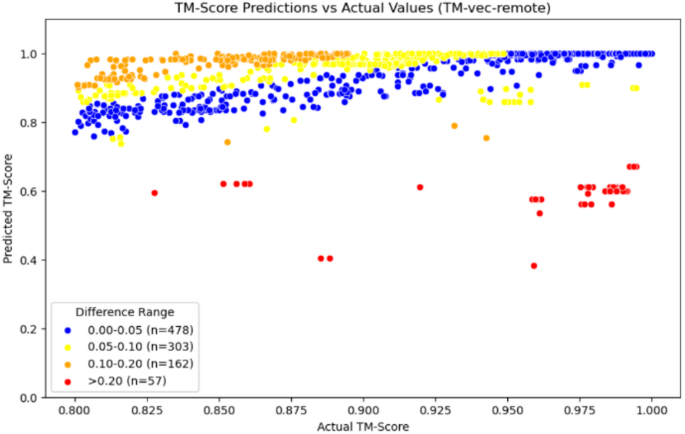
Scatter plot of TM-vec-remote
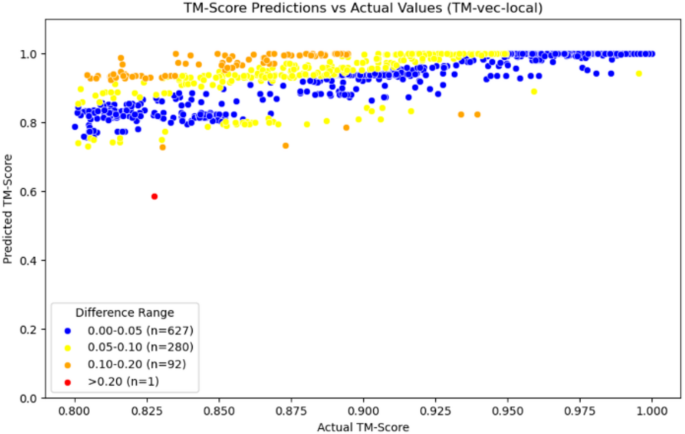
Scatter plot of TM-vec-local
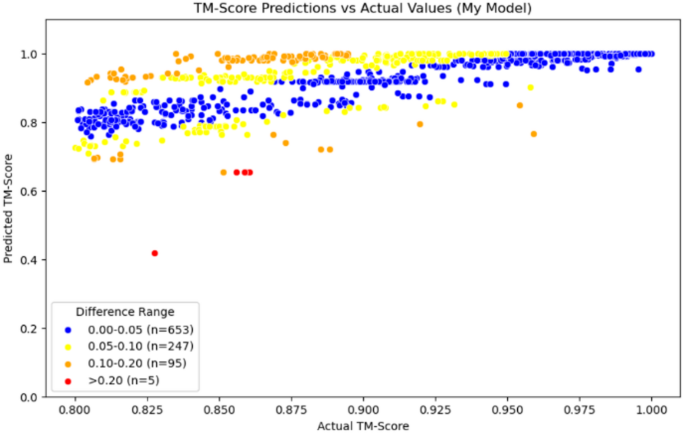
Scatter plot of Our Model
Comparative analysis of sequence identity and structural similarity prediction
In addition, we conducted a detailed comparison between sequence identity and TM-score. As shown in Fig. 13, the sequence identity curve (green) increases sharply only in the high TM-score region (above 0.8), whereas our model’s predictions (orange) closely follow the true TM-score (blue) across the entire range. This observation suggests that sequence identity alone has limited capacity to reflect structural similarity, particularly in the low-to-medium TM-score regions, while our model maintains strong consistency with the ground truth, even for remotely homologous protein pairs.
This analysis not only demonstrates that our model does not rely on sequence identity, but also highlights the limitations of using sequence similarity as a proxy for structural similarity.
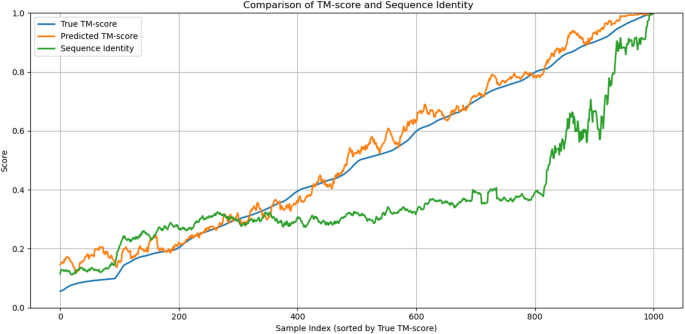
Comparison of True TM-score, Predicted TM-score, and Sequence Identity across protein pairs
Furthermore, we performed a quantitative correlation analysis to support this observation. The Pearson correlation coefficient between the predicted and true TM-scores is 0.965, indicating that our model achieves a high degree of accuracy in structural similarity prediction. In contrast, the correlation between absolute prediction error and sequence identity is only − 0.096, suggesting no meaningful linear relationship. This finding confirms that our model captures structural information beyond what is directly encoded in sequence similarity.
Application
We know that when two proteins have similar three-dimensional structures, their functions are likely to be similar. From an application perspective, our model can be utilized in many studies that leverage structure to infer function. One of the most typical application cases is research on protein drug repositioning and the discovery of novel drugs.
By efficiently calculating the similarity between protein drug sequences, the model can quickly identify homologous relationships between protein drug pairs. If protein drug A and another protein drug B have highly similar structures, we can preliminarily infer that A and B likely have similar efficacy. The use of this model can enable existing drugs to be repurposed for new therapeutic targets, significantly accelerating the research process for drug repositioning.
In the simulation experiment, we used partial protein drug sequences from the DrugBank database [16, 17] to compare the structural similarity of these drugs pairwise. Finally, we plotted a heatmap of the comparison results, shown in Fig. 14, where the redder the structure, the more similar it is, and the bluer the structure, the less similar it is.
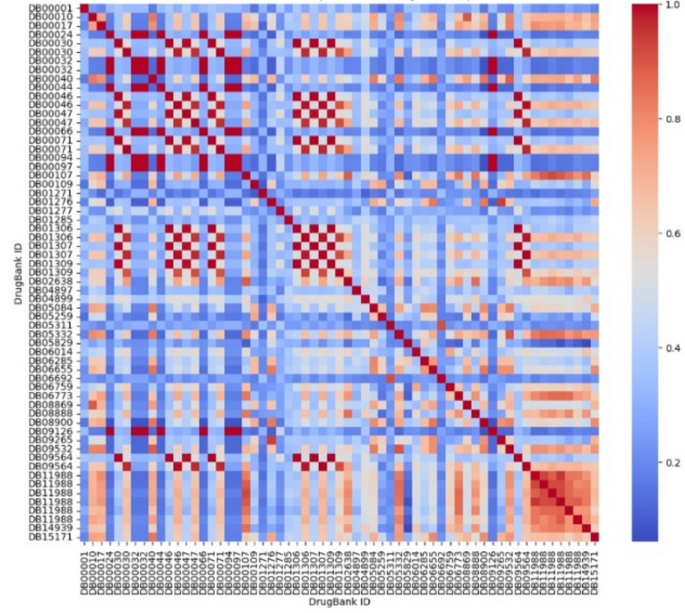
Heatmap of protein drug comparison
In Fig. 13, we have identified an interesting pair of drugs: DB05311 (Ecallantide) and DB06692 (Aprotinin). As shown in the figure, these two drugs are not only identical to themselves, but also highly structurally similar to each other. Moreover, they exhibit structural dissimilarities with the other protein drugs. At this point, we can consult the DrugBank database to further investigate this pair of drugs.
The summary of the protein drug Ecallantide is as follows: “Ecallantide is a kallikrein inhibitor used to prevent and treat acute attacks caused by Hereditary Angioedema (HAE).” (DrugBank, 2024) [17]. The summary of Aprotinin is: “Aprotinin is a serine protease inhibitor used to reduce the risk for perioperative blood loss and the need for blood transfusion in high-risk patients during cardiopulmonary bypass for coronary artery bypass graft surgery.” (DrugBank, 2024) [17].
We found that both exert their effects by inhibiting the activity of serine proteases, but Ecallantide is more targeted and highly specific, while Aprotinin has a broader spectrum and may have potential in a wider range of diseases, though it may also bring some side effects.
By using our model, we can quickly calculate and screen proteins with similar structures. After screening, we can further explore the repositioning of protein drugs through in vitro experiments, disease models, or clinical trials.
In addition, this can be achieved not only by comparing the structural similarities between known drugs, but also by comparing the protein drug sequences of other proteins with known functions, to explore potential functions. This method can efficiently screen candidate molecules with therapeutic potential, thereby accelerating the development process of new drugs. As shown in Fig. 15, we randomly selected 100 proteins from the CATH database and compared them with some of the selected protein drugs to create a heatmap. The redder the dots, the more significant the parts, indicating a high probability of structural similarity.
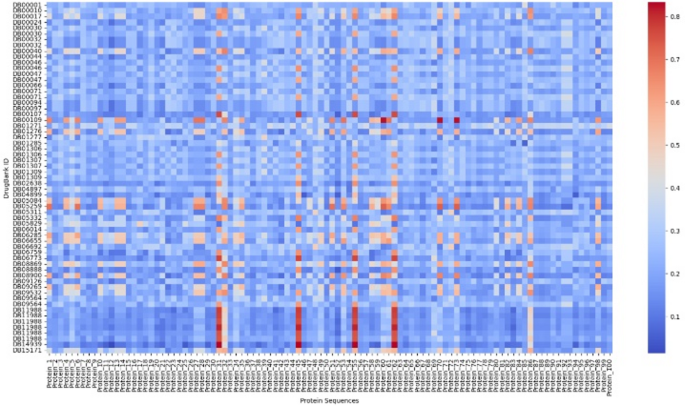
Heatmap of protein drugs and other proteins
Conclusion
In our study, we proposed an improved method, Rprot-Vec, that can calculate structural similarity using only protein sequences, eliminating the need for three-dimensional structure calculations. Rprot-Vec combines both global and local features to thoroughly extract key information from protein sequences, modeling protein sequences and quickly calculating the structural similarity score.
The experimental results show that Rprot-Vec can achieve good results even when trained on small datasets. We trained the model using the CATH_TM_score_M dataset, which has a size of 1.3GB. Rprot-Vec showed better results in both the entire TM-score interval and the homologous region. Under the same dataset and training environment, Rprot-Vec outperformed the comparison model by 21.8% and 5.19% in both the full TM-score interval and the homologous region.
The structure of Rprot-Vec adopts the ProtT5 model as the upstream pre-training encoding model, which first encodes the protein sequence and extracts preliminary feature information. Then, the bidirectional GRU combined with the Attention method is used to further extract global features and attempt to capture key information from the sequence. Next, multi-scale convolution is employed to capture local features in the protein sequence, and finally, the model calculates the protein sequence through the output module.
By using Rprot-Vec, it is possible to calculate the structural similarity quickly and accurately between two proteins. We look forward to the application of Rprot-Vec in the search for homologous proteins. By using Rprot-Vec to pre-encode a large amount of protein data with known sequences, we can construct the required protein-coding database. In subsequent searches, we only need to encode the search sequence and calculate the cosine similarity between the encoded search sequence and the searched sequence in the coding database, one by one. The speed of calculating cosine similarity is much faster than that of most deep learning models. This method can help us quickly find proteins in the database that have similar structures to the search sequence.
Supplementary information
https://github.com/SuperZyccc/RProt-vec/.
Data availability
The datasets supporting the conclusions of this article are available at our GitHub repository: https://github.com/SuperZyccc/RProt-vec. Specifically, we provide three filtered datasets named CATH_TM_score_S, CATH_TM_score_M, and CATH_TM_score_L, generated using the CATH database (https://www.cathdb.info) and the US-align tool (https://zhanggroup.org/US-align/). These datasets include pairs of protein sequences and their corresponding TM-scores calculated via structural alignment. All training scripts and model weights are also available in the repository.
References
-
Zhang Y, Skolnick J. TM-align: a protein structure alignment algorithm based on the TM-score. Nucleic Acids Res. 2005;33(7):2302–9.
-
Baker D, Sali A. Protein structure prediction and structural genomics. Science. 2001;294(5540):93–6.
-
Orengo CA, Todd AE, Thornton JM. From protein structure to function. Curr Opin Struct Biol. 1999;9(3):374–82.
-
Holm L, Sander C. Dali: a network tool for protein structure comparison. Trends Biochem Sci. 1995;20(11):478–80.
-
Shindyalov IN, Bourne PE. Protein structure alignment by incremental combinatorial extension (CE) of the optimal path. Protein Eng. 1998;11(9):739–47.
-
Burley SK, Berman HM, Kleywegt GJ, Markley JL, Nakamura H, Velankar S. Protein data bank (PDB): the single global macromolecular structure archive. Protein Crystallography: Methods and Protocols; 2017. pp. 627–41.
-
Söding J, Biegert A, Lupas AN. The HHpred interactive server for protein homology detection and structure prediction. Nucleic Acids Res. 2005;33(suppl2):W244–8.
-
Kelley LA, Mezulis S, Yates CM, Wass MN, Sternberg MJ. The Phyre2 web portal for protein modeling, prediction and analysis. Nat Protoc. 2015;10(6):845–58.
-
Hamamsy T, Morton JT, Blackwell R, Berenberg D, Carriero N, Gligorijevic V, Bonneau R. Protein remote homology detection and structural alignment using deep learning. Nat Biotechnol. 2024;42(6):975–85.
-
Elnaggar A, Heinzinger M, Dallago C, Rehawi G, Wang Y, Jones L, Rost B. ProtTrans: toward understanding the language of life through self-supervised learning. IEEE Trans Pattern Anal Mach Intell. 2021;44(10):7112–27.
-
Cho K. Learning phrase representations using RNN encoder-decoder for statistical machine translation. ArXiv Preprint. 2014. arXiv:1406.1078.
-
Zhang C, Shine M, Pyle AM, Zhang Y. US-align: universal structure alignments of proteins, nucleic acids, and macromolecular complexes. Nat Methods. 2022;19(9):1109–15.
-
Orengo CA, Michie AD, Jones S, Jones DT, Swindells MB, Thornton JM. CATH: a hierarchic classification of protein domain structures. Structure. 1997;5(8):1093–109.
-
Sillitoe I, Lewis TE, Cuff A, Das S, Ashford P, Dawson NL, Orengo CA. CATH: comprehensive structural and functional annotations for genome sequences. Nucleic Acids Res. 2015;43(D1):D376–81.
-
Dawson NL, Lewis TE, Das S, Lees JG, Lee D, Ashford P, Sillitoe I. CATH: an expanded resource to predict protein function through structure and sequence. Nucleic Acids Res. 2017;45(D1):D289–95.
-
Wishart DS, Feunang YD, Guo AC, Lo EJ, Marcu A, Grant JR, Wilson M. DrugBank 5.0: a major update to the drugbank database for 2018. Nucleic Acids Res. 2018;46(D1):D1074–82.
-
Knox C, Wilson M, Klinger CM, Franklin M, Oler E, Wilson A, Wishart DS. DrugBank 6.0: the drugbank knowledgebase for 2024. Nucleic Acids Res. 2024;52(D1):D1265–75.
Acknowledgements
We want to express our gratitude to editor and anonymous reviewers for the suggestions, which help us improve the presentation.
Funding
Not applicable.
Ethics declarations
Ethics approval and consent to participate
Not applicable.
Consent for publication
Not applicable.
Competing interests
The authors declare no competing interests.
Additional information
Publisher’s note
Springer Nature remains neutral with regard to jurisdictional claims in published maps and institutional affiliations.
Rights and permissions
Open Access This article is licensed under a Creative Commons Attribution-NonCommercial-NoDerivatives 4.0 International License, which permits any non-commercial use, sharing, distribution and reproduction in any medium or format, as long as you give appropriate credit to the original author(s) and the source, provide a link to the Creative Commons licence, and indicate if you modified the licensed material. You do not have permission under this licence to share adapted material derived from this article or parts of it. The images or other third party material in this article are included in the article’s Creative Commons licence, unless indicated otherwise in a credit line to the material. If material is not included in the article’s Creative Commons licence and your intended use is not permitted by statutory regulation or exceeds the permitted use, you will need to obtain permission directly from the copyright holder. To view a copy of this licence, visit http://creativecommons.org/licenses/by-nc-nd/4.0/.
Reprints and permissions
Cite this article
Zhang, Y., Zhang, W. Rprot-Vec: a deep learning approach for fast protein structure similarity calculation. BMC Bioinformatics 26, 171 (2025). https://doi.org/10.1186/s12859-025-06213-1
- Received
- Accepted
- Published
- DOIhttps://doi.org/10.1186/s12859-025-06213-1
Keywords
- Protein structure similarity
- Deep learning
- Homology detection
- Rprot-Vec
- TM-score prediction
- Bi-GRU
- CNN
- Protein sequence encoding