Article Content
1 Introduction
Studying pedestrian behavior in large public buildings provides valuable insights for architectural design, pedestrian traffic management, and emergency evacuation planning. Architects typically rely on both practical experience and theoretical knowledge to predict pedestrian movement patterns within public spaces. Since the 1960 s, interdisciplinary research methods such as cognitive mapping and statistical sampling (Moeser, 1988) have been employed to examine the relationship between architectural space characteristics and users’cognitive decision-making, particularly in”wayfinding”studies (Arthur & Passini, 1992; Corlett et al., 1972). Several spatial cognition theories have been developed to help architects assess wayfinding performance in public buildings using spatial indicators such as the visibility index (VI) and interconnection density (ICD). However, these evaluations are typically conducted at a macro level, often overlooking human factors. To address this limitation, researchers have conducted behavioral experiments to investigate individuals’spatial perceptions and decision-making processes. These experiments, which commonly involve on-site tracking and virtual simulations in laboratory settings, provide valuable behavioral insights. However, while experimental methods are useful, they are often time-consuming, complex, and limited in the range of behaviors they can observe.
Wayfinding involves understanding the environment, recognizing landmarks, following signs, and making decisions to reach a destination. During this process, individuals receive positive or negative feedback from their surroundings, encounter obstacles, and obtain navigational cues. While wayfinding is not inherently a game, it can be gamified through challenges, rewards, and interactive experiences, particularly in serious games. Virtual reality (VR), as an emerging technology, creates a parallel universe that transcends time, location, and geographical constraints, allowing users to interact with digital environments. This presents new opportunities for behavioral studies. Additionally, due to the ease of modifying elements and their attributes, VR enables researchers to explore the effects of specific environmental changes on human behavior while minimizing the influence of confounding variables. This paper examines the potential of VR-based online platforms for studying passenger behavior, with a particular focus on wayfinding. The research addresses the following questions:
- RQ1: Is a VR-based platform an effective tool for studying pedestrian behavior?
- RQ2: How can a VR-based platform be designed to study wayfinding behavior?
- RQ3: What are the advantages and disadvantages of using a VR-based platform for behavior studies compared to current methods?
To address these research questions, we developed a realistic VR-based online platform using Unity 3D, creating a virtual replica of Satellite Terminal 1 (S1) at Shanghai Pudong International Airport (PVG). This platform includes digital recreations of the terminal’s interior spaces and avatars simulating surrounding passengers. It employs a Browser/Server (B/S) architecture, enabling remote access through compatible web browsers to facilitate broad user participation. Additionally, we designed a wayfinding task system comprising multiple sub-tasks, a virtual environment time system, a reward-and-punishment mechanism, and a human–environment interaction framework. Detailed trajectory and behavioral data collected from human participants were subsequently analyzed to evaluate wayfinding performance.
This paper is structured into five sections. The first section introduces the study. The second section reviews both conventional and technology-assisted wayfinding studies, highlighting the significance of VR technology in wayfinding research and advocating for the use of serious games to enhance wayfinding experiments. The third section outlines the framework and technical details of the online VR-based platform. The fourth section presents a wayfinding experiment conducted using this platform, along with the results demonstrating its advantages. The final section provides a conclusion, as well as insights into future research directions.
2 Literature review
Wayfinding refers to an individual’s ability to navigate to a destination efficiently and with minimal stress (Peponis et al., 1990). It can be understood as a series of continuous problem-solving tasks based on environmental cues (Arthur & Passini, 1992). Wayfinding efficiency is particularly critical in complex public facilities such as hospitals, railway stations, and airports. In airport environments, passengers face dynamic challenges in route selection upon entering terminal buildings (Fewings, 2001). Given the pressures of time constraints and transfer requirements, passengers must locate their destinations as efficiently as possible. However, the complex interior layouts of airport terminals often make navigation difficult. To address these challenges, existing research primarily investigates pedestrian behavior and wayfinding performance from two perspectives: (1) methods based on two-dimensional (2D) spatial analysis and (2) approaches focused on pedestrian trajectories and behavioral performance.
2.1 2D spatial analysis
Methods based on two-dimensional (2D) spatial analysis evaluate wayfinding performance in specific environments by using spatial feature indicators such as visibility and connectivity. Notable examples include the Visibility Index (VI) (Braaksma & Cook, 1980), Interconnection Density (ICD) (O’Neill, 1991), and Space Syntax (Turner et al., 2001).
The VI indicator assesses the ease of passenger wayfinding within an airport by quantifying the visibility between different facilities. In practical applications, researchers have calculated the average VI value of terminals and established service level standards for airports based on their findings (Churchill et al., 2008; Tam & Lam, 2004). Although the VI model has undergone multiple refinements to account for factors such as floor changes and the number of directional signs between facilities (Tam, 2011), it remains a broad evaluation method with limited consideration of additional influencing factors.
Navigating complex environments with multiple directional choices at decision points can hinder wayfinding efficiency (Slone et al., 2015). ICD is another widely used indicator that quantifies the average number of directional choices available at all decision points (O’Neill, 1991). It primarily assesses spatial complexity by analyzing decision points and their topological connections within floor plan configurations to evaluate wayfinding performance. Higher ICD values indicate greater complexity in directional choices, which can impede navigation. However, Werner and Long (2003) highlighted the limitations of ICD in representing spatial complexity: identical ICD values can correspond to different spatial configurations, and ICD does not account for factors such as shape, boundaries, or angular relationships. Additionally, Jansen-Osmann et al. (2007) found that environments with different ICD values may produce similar local spatial experiences.
As an advanced spatial analysis method, Space Syntax examines how spatial configurations influence pedestrian movement by assessing factors such as spatial connectivity, visibility, and integration (Turner et al., 2001). It provides a valuable framework for understanding the impact of spatial layouts on navigation decisions. However, 2D spatial analysis methods consider a limited range of factors and often overlook individual differences. These methods are generally more suitable for early-stage, rapid, and cost-effective evaluations. Given the characteristics of public buildings, wayfinding strategies involve dynamic decision-making, where individuals select routes at various decision points in unfamiliar environments based on environmental cues (Carpman & Grant, 2002). To gain deeper insights into wayfinding behavior, researchers have employed real-world tracking and laboratory-based virtual experiments to collect behavioral data in three-dimensional (3D) environments, placing greater emphasis on passengers’wayfinding performance and experiences.
2.2 Pedestrian trajectories and behavioral performance
Real-life tracking records individuals’behaviors in physical environments, capturing movement trajectories and decision-making processes (Li & Klippel, 2016). This method offers high empirical validity because data are collected on-site and closely mirror real-world conditions. However, the complexities of site conditions and the extensive data acquisition efforts required (Sun et al., 2021)—particularly in large public facilities such as airports—often limit the spatial scope of data collection, making it challenging to fully capture pedestrians’ wayfinding behavior.
In contrast, laboratory-based wayfinding experiments use virtual reality (VR) technology to simulate real-world environments under controlled conditions, facilitating the collection of behavioral data. Despite the widespread application of VR interaction technologies in wayfinding research—such as head-mounted displays (HMDs) (Feng et al., 2021), desktop displays (DT) (Tang et al., 2009), and cave automatic virtual environments (CAVE) (Bauer et al., 2018)—these experiments are constrained by site-specific factors, experimental workload, and relatively high time and cost investments. Advanced technologies like eye-tracking (Fu et al., 2023; Schwarzkopf et al., 2013) and electroencephalography (EEG) (Kalantari et al., 2022; Zhu et al., 2022) have further enhanced laboratory-based studies by capturing more detailed insights into wayfinding behaviors. However, these costly devices significantly restrict the number of participants, ultimately reducing the diversity of observed behaviors. Consequently, while laboratory-based VR experiments provide high-precision data, their scalability remains limited compared to large-scale, web-based VR platforms.
2.3 Virtual reality and serious game
Advancements in metaverse-supporting technologies—such as VR headsets, haptic gloves, augmented reality (AR), and extended reality (XR)—have enabled users to experience highly interactive and immersive environments. These technological improvements have not only enhanced the realism of user experiences but have also increased the accessibility of VR-based platforms, distinguishing them from earlier applications. Continuous enhancements in web technology have transformed web browsers from simple display tools into highly functional application platforms (Zhao et al., 2019). By leveraging the hardware acceleration capabilities of graphics processing units (GPUs) and standard cross-platform OpenGL interfaces, modern web browsers can render 3D virtual content without requiring plugins. Consequently, users can access virtual environment via common devices—such as smartphones, tablets, or laptops—through standard web browsers, thereby facilitating seamless and continuous engagement. Various studies have investigated VR-based platforms in contexts including education and training (Ruiz-Campo et al., 2023; Wang et al., 2022), visits and exhibitions (Wu et al., 2022), healthcare simulations and telemedicine (Bansal et al., 2022; Elhence et al., 2022), and strategic decision-making (Gattullo et al., 2022; Schumacher, 2022).
Gamification refers to the application of game design elements in non-entertainment contexts. The term “serious games,” introduced by Zyda (2005), describes games primarily designed for purposes beyond entertainment. These games integrate real-world issues with gaming elements and employ mechanics such as goals, points, leaderboards, and rewards to create engaging experiences that enhance user participation. Serious games have been utilized in crowd behavior studies (Connolly et al., 2012; Li et al., 2017) to record decision-making processes and behaviors during gameplay, thereby providing valuable opportunities for collecting behavioral data. As digitization and gamification continue to mature, serious games are increasingly becoming a prominent feature of VR-based platforms, offering participants realistic experiences and incentivizing active engagement.
The metaverse, powered by advanced communication technologies that bridge the physical and virtual worlds, offers a distinctive online platform with inherent advantages in data acquisition—particularly in terms of volume and speed. Benefit from the B/S architecture, metaverse applications considerably reduce hardware costs on the user’s end, thus allowing users to experience virtual environments from any location in an affordable approach. Interactive virtual reality (VR) environments and immersive games, considered precursors to the metaverse (Dwivedi et al., 2022), utilize gamification to attract a larger number of participants to engage in specific wayfinding tasks at a lower cost. This approach provides novel perspectives and innovative solutions for studying wayfinding behavior.
3 VR-based online wayfinding platform
3.1 Platform framework
The architecture of the VR-based system is shown in Fig. 1, which is built on a B/S model. The system comprises two main components: the web frontend and the web server. On the server side, a lightweight virtual world—including virtual interior spaces and avatars—is transmitted via the Internet to the web frontend. The frontend employs the WebGL graphics engine for scene rendering, while HTML5 and JavaScript facilitate user interface design and event processing. Participants interact with the virtual world through a web-based interface and engage in a virtual wayfinding game hosted on the web server. During the experiment, wayfinding data are transmitted back to the server in real time and stored in a database. Additionally, avatars that represent surrounding pedestrians within the virtual environment are driven by an algorithm, with their behavioral data also recorded on the web server.
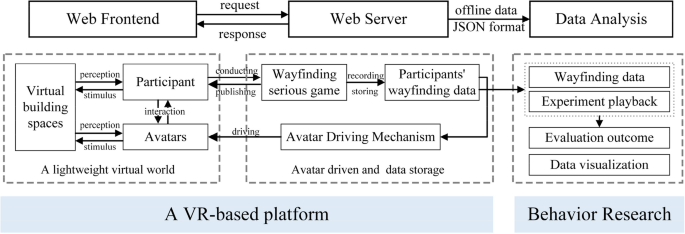
The framework of the VR-based platform
3.2 Platform development
The platform development is focused primarily on two key modules: a lightweight virtual world and data acquisition/storage. In this context, a game engine capable of high-frequency rendering is essential. For example, the Unity3D game engine enables the creation of both 2D and 3D experiences and offers a robust C# scripting API that excels at building virtual worlds (Bansal et al., 2022). Moreover, Unity3D’s ability to export and publish content directly to the web enhances its practicality and broadens its application in platform development. Consequently, this study adopts Unity3D as the primary development tool to fully leverage its strengths in virtual world construction and rendering optimization (see Fig. 2).
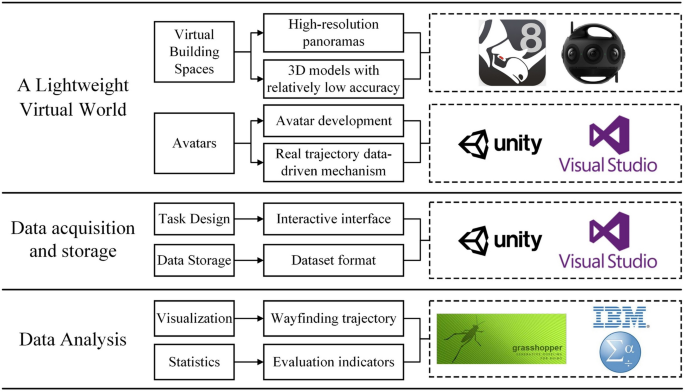
Tools for platform development and data analysis
3.2.1 Lightweight virtual world
A lightweight virtual world serves as the medium for information exchange and comprises two core components: architectural spaces and avatars. Realistic virtual architectural spaces are typically created by rendering 3D models with texture maps. Advanced tools, such as Rhino, generate highly detailed meshes that facilitate the construction of 3D models based on comprehensive data from target buildings. However, although these high-resolution textured models offer highly realistic visual effects, their large data volumes often lead to slower loading and reduced performance on web frontends, ultimately compromising the user experience.
To address this issue, it is crucial to reduce the complexity of the model without sacrificing the realism of the virtual scenes, thereby creating a lightweight architectural space. A practical solution is to apply high-resolution panoramas as textures to models with relatively low geometric accuracy. These 3D models focus only on key components relevant to sight-line occlusion. Panoramas captured by a 360-degree camera are then used as textures to enhance the models’appearance quality. This method helps maintain higher loading and running speeds while preserving the essential details of the virtual environment, ultimately improving the user experience.
During navigation, an individual’s decision-making is influenced not only by environmental cues—such as signage and spatial configurations—but also by factors including route selection (Narang et al., 2016), behavioral patterns (Kyriakou et al., 2017), and the density of surrounding individuals (Dickinson et al., 2019). Consequently, avatars are an essential component in constructing a lightweight virtual world. Based on real pedestrian data, 12 avatar appearance templates representing various genders and age groups were developed in Unity3D. To reduce complexity and data volume, the character mesh models of these avatars were simplified.
In virtual environments, avatar behaviors are typically driven by either mathematical model-based methods (Pelechano et al., 2007; Sakuma et al., 2005) or data-driven approaches (Lee et al., 2007; Yao et al., 2020). Mathematical model-based methods rely on predefined rules or algorithms—such as those controlling speed, direction, field of view, and interaction forces—to manipulate avatar behavior. However, these methods can produce uniform or unrealistic behaviors that fail to accurately represent the diversity of real-world crowd dynamics. In contrast, data-driven approaches utilize actual trajectory data from passengers to drive avatars, thereby enhancing the visual realism and variability of simulated crowd behaviors.
In this study, avatars are driven by actual navigation data collected from passengers within the target building. Specifically, avatars’initial positions, movement paths, direction selections, and destinations are derived from real trajectory data. Although avatars sharing similar gender and age characteristics exhibit cloned appearances, their behaviors are individually determined by this empirical data. This approach preserves diversity in avatar behaviors and data efficiency while maintaining the authenticity of crowd dynamics and the credibility of the virtual environment.
3.2.2 Data acquisition and storage
The data acquisition/storage module encompasses both a wayfinding task system and a data storage system, implemented within the Visual Studio environment. Wayfinding task design focuses on creating scenarios that accurately reflect user behaviors, for example, going to a restaurant or washroom while on the way to a boarding gate, ensuring the authenticity and reliability of the collected data. Concurrently, the data storage component captures and records user navigation behaviors and other relevant activities within the virtual environments. All data are stored in JavaScript Object Notation (JSON) format, which facilitates structured processing and subsequent analysis. Specifically, the recorded data include activity timestamps, detailed navigation information, and real-time spatial coordinates of individuals within the virtual space.
4 An application case
The International Departure Hall of the S1 at PVG Airport was selected as a case study to be replicated to demonstrate the capabilities of the VR-based platform. This hall spans a passenger-accessible area of 8,102 m2 and has an average pedestrian density of approximately 0.05 persons per square meter. It features four wayfinding starting points, labeled A through D, and includes 19 boarding gates (G101–G140) (see Fig. 3).
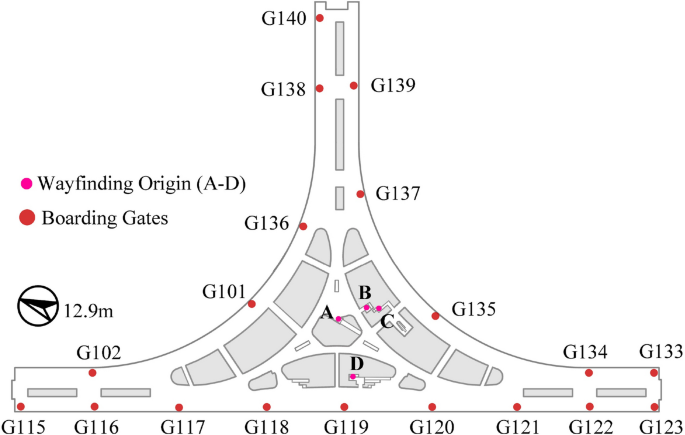
The layout of the International Departure of the S1
4.1 Virtual environment
For the International Departure Hall, 150 decision points were established, each with a corresponding 360-degree high-resolution panorama. A 3D model of the hall was created using Rhino software, scaled to match the real building while maintaining a relatively low level of detail, preserving only key components affecting line-of-sight occlusions. As model complexity increases with building size, further optimization was necessary to ensure smooth real-time rendering performance, even though the model was already lightweight. To address this, the 3D model was segmented into multiple local models, each allowing participants to navigate seamlessly. High-resolution panoramas were mapped as textures onto these local models (see Fig. 4). As a result, the hall was divided into 150 segments, each consisting of a localized 3D model and a high-resolution panorama at its center.
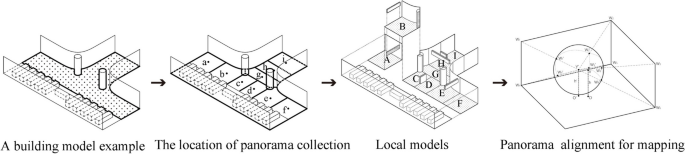
The procedures for building a realistic and lightweight virtual environment
On the web frontend, a specialized scheduling algorithm dynamically determined the roamer’s location and viewpoint within a local model in real time. The web server dispatched high-resolution panoramas for the roamer’s current and neighboring local models, while for more distant models, the panorama of the roamer’s current location was reused. This selective loading strategy significantly reduced the rendering load by limiting the number of panoramas processed simultaneously.
To render the environment in real time, a reverse projection technique was employed, mapping the dispatched panoramas onto the surfaces of local 3D models as texture maps. This approach ensured that the virtual environment within the roamer’s field of view maintained accurate spatial relationships and environmental details. By reducing the complexity of 3D models and the computational demands of real-time rendering, this technique enabled a lightweight virtual architectural environment that balanced high visual fidelity with smooth performance.
4.2 Serious game in wayfinding
4.2.1 Roaming in the virtual environment
The VR-based platform developed for this study was designed for deployment on both local VR devices and web browsers. However, requiring participants to wear HMD for wayfinding experiments in non-laboratory settings posed practical challenges. To address this, the web frontend enabled participants to navigate and explore the virtual environment from a first-person perspective (see Fig. 5). Figure 5 illustrates the interface of the VR-based online wayfinding platform. In the lower-right corner of the interface, the boarding task is presented in a virtual boarding pass, which sequentially displays the boarding gate, takeoff time, and flight number. Sub-task is positioned in the upper-left corner of the interface, providing details such as task type and completion progress. A virtual time is displayed at the top-center of the interface, showing the current time within the virtual environment.
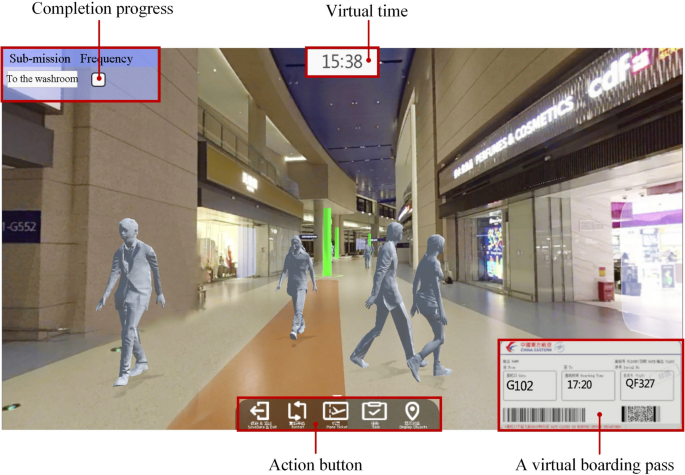
The interface of VR-based online wayfinding platform
Participants could rotate their view using a mouse, simulating head movements in an HMD, allowing them to observe their surroundings naturally. Navigation between decision points was facilitated by clicking on illuminated markers within the virtual environment, enabling jump-based movement instead of continuous roaming. This approach streamlined navigation while maintaining an immersive experience. Freedom of movement included three key operations: forward/backward jump roaming, left/right jump roaming, and left/right rotations. The virtual world loaded seamlessly, with transitions between decision points taking less than one second, ensuring smooth and efficient interaction on the web frontend.
4.2.2 Interaction with avatars
In real-world navigation, individuals often interact with others to gather directional information. To replicate these interaction behaviors in the virtual environment, a simplified chat function was implemented to simulate real-life inquiry processes between participants and avatars.
Specifically, participants could request directions by clicking on any surrounding avatar. Upon interaction, a dialog box appeared, displaying common wayfinding questions along with relevant contextual information. Participants could then select wayfinding questions or type their needs, prompting the avatar to generate an arrow pointing toward the destination (see Fig. 6). The surrounding avatars serve as chatterbots for users, whose functions can also be extended by accessing large language models (LLMs). This mechanism enabled participants to engage with virtual avatars for navigation assistance, effectively simulating real-world”direction-giving”behaviors and enhancing the realism of the virtual wayfinding experience.
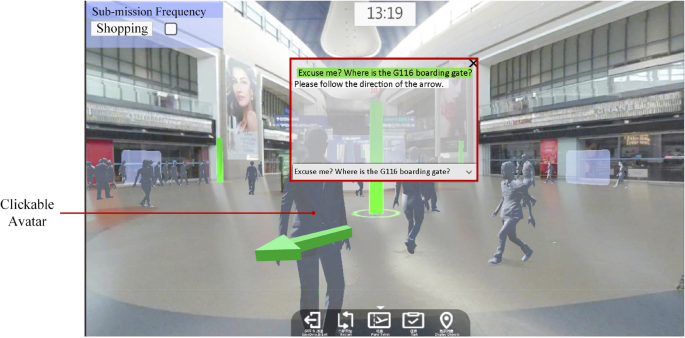
Interaction with surrounding avatars. Note: Participants initiated interactions by clicking on an avatar, triggering a dialog interface (marked by a red rectangle) that displayed two key components: (1) a predefined list of common wayfinding questions (e.g., “Where is the ……?”) at the bottom of the dialog box, and (2) dynamically updated contextual information in the upper area of the dialog box. Once selecting a question or inputting custom requests, the avatar generated a green arrow pointing toward the target destination
4.2.3 Wayfinding tasks and reward mechanism
The wayfinding task system incorporates game-thinking principles and public building design knowledge into a cohesive virtual spatio-temporal framework (Zou et al., 2025). Various design elements, such as competition and game mechanics, are considered to enhance engagement. Consequently, wayfinding tasks were structured in an “activity-boarding” mode, including various additional activities not only finding the boarding gates, reflecting real-world scenarios.
Participants follow individualized virtual timelines, which include start time, travel time, time spent on additional activities, and departure time. Start and departure times are predefined within the task settings, while travel time represents the duration spent navigating the virtual environment. Based on unique login credentials and participant age, appropriate walking speed intervals are automatically assigned: elderly individuals (≥ 60 years) at 0.7–1.1 m/s, adults (18–60 years) at 0.9–1.3 m/s, and adolescents (< 18 years) at 0.8–1.0 m/s. Travel time is calculated by measuring the actual distance between decision nodes in the virtual environment, cumulatively consuming virtual time. Additional activities such as shopping or using the washroom consume virtual time, the duration of these activities is determined by flipping a random “leave” card (see Fig. 7). The duration of consumed virtual time consists of a base time (5 min for shopping, 2 min for washroom use) plus an additional time for flipping the “leave” cards, where 1 s of real-time convert to 1 min of virtual time.
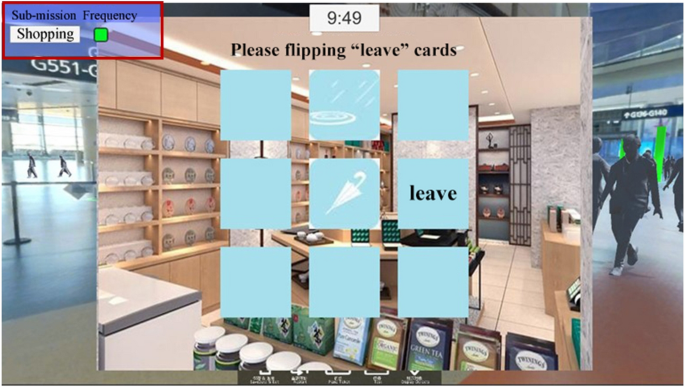
Engaging in a sub-task in the form of card-flipping. Note: The completion of sub-tasks is determined by a card-flipping mechanism. When a participant found the”leave”card, the small box representing the sub-task’s completion status is filled with green color (as indicated by the red box in the top-left corner)
Participants receive real-time feedback on their actions, with virtual time and task status displayed at the top of the interface (see Fig. 5). When less than 10 min remain before boarding and the participant has not yet reached the gate, the time display turns bold red (see Fig. 8). This feature serves not only as a timing reminder but also as a psychological trigger, creating time pressure that encourages participants to navigate more efficiently.
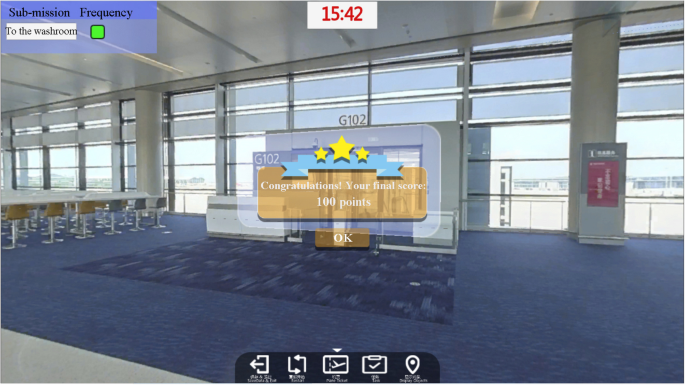
The reward and scoring mechanism
Additionally, a competitive reward mechanism evaluates participants based on their wayfinding performance. By completing these additional activities, participants also earn bonus scores. The performance is specifically scored with 60 points for timely boarding and 40 points for successfully completing the sub-tasks. After a participant clicks on the correct boarding gate, the total score for the current wayfinding task is displayed on a yellow panel in the center of the interface, as illustrated in Fig. 8. Similar to serious games, this system incentivizes participants to optimize their navigation strategies to achieve higher scores. To improve their performance, participants are likely to observe their surroundings more attentively, gather essential wayfinding information, and minimize detours by employing techniques such as forming mental maps and increasing interactions with surrounding avatars. This system incentivizes optimal wayfinding behavior by fostering a competitive and engaging virtual environment.
4.3 Evaluation and analysis of wayfinding behaviour
Within 72 h of platform activation, 435 participants engaged in the wayfinding experiment, generating 13,712 trajectory records (Sun et al., 2024). Among them, 370 participants completed the experiment with surrounding avatars driven by trajectory data, yielding 2,746 wayfinding records. Of these, 2,634 were validated, achieving a 95.9% validation rate. The validated data were subsequently used for wayfinding performance evaluation.
4.3.1 Task success rate
A statistical analysis of task completion was conducted using the wayfinding data (see Table 1). The results revealed a 99.58% success rate for the boarding task, indicating that most participants successfully located their designated boarding gates in the International Departure Hall. However, the success rate for the sub-task of locating the washroom was significantly lower than that of the other tasks. This suggests that participants experienced greater difficulty finding the washroom in the virtual environment, likely due to insufficient directional signage within this case study.
4.3.2 Wayfinding trajectories
Shorter wayfinding trajectories generally indicate higher efficiency and better-designed directional signage. Additionally, trajectory consistency reflects the similarity of participants’ paths during the same wayfinding task. Analyzing the length and consistency of these trajectories can assist designers in identifying areas with wayfinding challenges more effectively.
This study compared the participants’average trajectory lengths with the optimal trajectory length for each task. Tasks marked by red rectangles in Fig. 9 show a significant difference between the two values, which requires further analysis. Notably, when participants navigated from origin A to boarding gates G118-G123, their trajectory lengths were relatively longer. This could be attributed to the difficulty in identifying the wall-attached illuminated directional signage. A similar issue was observed when participants navigated from origin B to gates G118-G121.For participants starting from origin C to locate various boarding gates, the trajectory lengths were also unsatisfactory. This was primarily due to the placement of directional signage only for gate G135 at the elevator (origin C), which limited the overall wayfinding effectiveness.
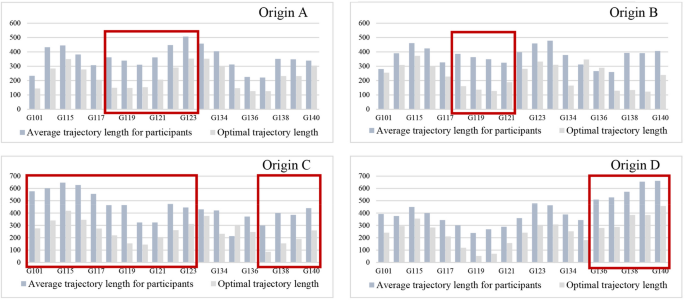
Analysis of trajectory length
Although the wayfinding trajectory results from origin D to gates G118 - 120 were not ideal, the cause was not related to issues with directional signage but rather the distance of shops from origin D, which led participants to take longer paths due to the shopping sub-task. In contrast, gates G136-G140 were located far from origin D, the discontinuous placement of directional signage for these gates likely contributed to the difficulty in wayfinding over long distances.
Figure 10 illustrates the trajectory consistency for destinations G119 and G140. The consistency for G140 was higher. A visual blind spot occurred on the route to G119 due to the signage being placed parallel to the passengers’sightline, which led to inconsistent wayfinding trajectories. This suggests that directional signage should be positioned according to passengers’forward direction to improve consistency and effectiveness.
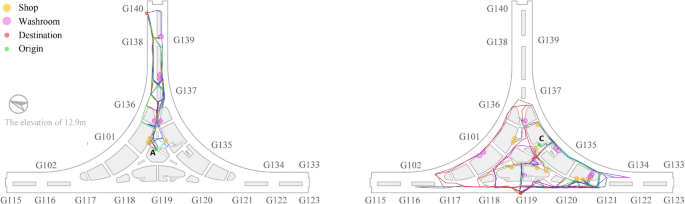
Illustrations of trajectory consistency analysis (G119, G140)
4.3.3 Decision time
Decision time at various decision points refers to the duration participants spend considering their options and making choices at these points. Quantifying decision time is useful for evaluating wayfinding performance and identifying areas where participants may experience confusion. The average decision time was calculated for each decision point, and it was found that decision time exceeded 20 s at 27 decision points (see Fig. 11). These decision points were categorized based on visual range, spatial scale, and the number of available directions to choose from.
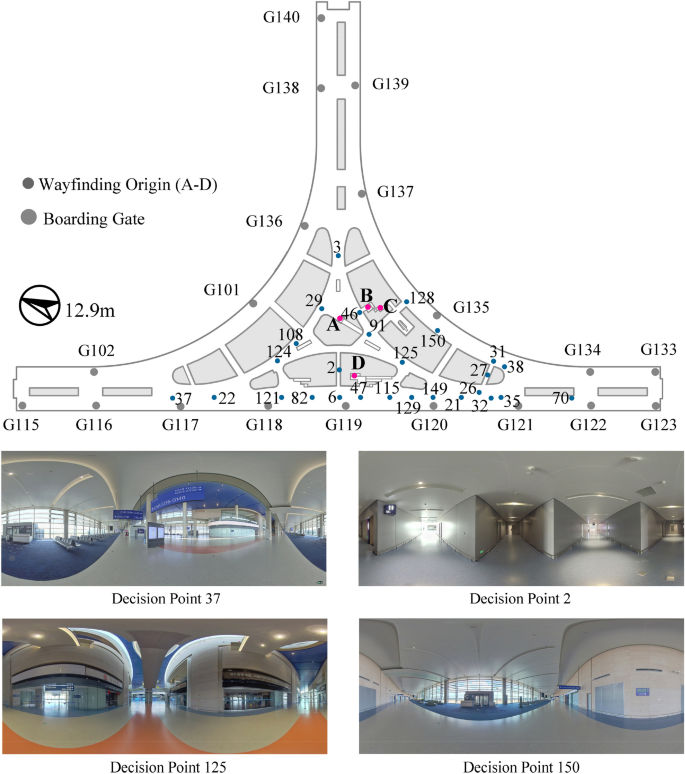
Decision points with a longer decision time
Among these decision points, the following are classified into a category characterized by multiple directional choices in large-scale spaces with long visual ranges: 6 (38.09 s), 115 (32.97 s), 128 (32.78 s), 82 (28.47 s), 121 (28.35 s), 35 (26.28 s), 32 (25.97 s), 47 (24.99 s), 26 (22.93 s), 38 (22.77 s), 31 (22.75 s), 149 (21.53 s), 37 (21.53 s), 22 (21.10 s), and 21 (20.94 s). Decision points 27 (28.69 s) and 2 (22.62 s) belong to another category characterized by limited visibility in smaller spaces with two directional choices. Decision points 125 (28.11 s), 46 (27.85 s), 124 (26.75 s), 29 (25.92 s), 91 (20.92 s), 108 (20.72 s), and 3 (20.10 s) are classified in a category with multiple directional choices in large-scale spaces with near visual ranges. Lastly, decision points 129 (27.53 s), 70 (21.68 s), and 150 (21.67 s) fall into a category with two directional choices in large-scale spaces with long visual ranges.
4.4 Suggestions for spatial improvement
Drawing on the results of the data analysis, this study identified key decision points that hinder wayfinding and explored the factors contributing to reduced wayfinding efficiency. Additionally, expert architects and designers were invited to participate in discussions, and their feedback was incorporated into a set of recommendations for improvement. These recommendations, based on both the wayfinding performance of participants and their input, were compiled into a design guideline. This guideline was subsequently adopted by the management of PVG Airport to optimize both the interior and signage design (Li et al., 2022).
Decision time increases significantly when participants face more than two directional choices at a decision point. This indicates that multiple directional options elevate cognitive load, leading to longer decision-making times. To improve wayfinding efficiency in such situations, the design of interior installations and landscape elements should help participants quickly understand the spatial layout.
In decision points located within confined spaces with limited visibility, where only two directional choices are available, participants still struggle to make quick decisions due to the restricted visual range. Enhancing these areas with clear directional signage can help guide individuals more efficiently. Additionally, the use of varied lighting, such as different colors or brightness levels to signal different directions, can further assist in directing attention.
For decision points in large, open spaces with extended visual ranges and only two directional choices, although fewer options are available, the expansive view requires participants to process more information before deciding. In these cases, strategically placed, well-designed signage can help prevent information overload and guide participants effectively, ensuring that directional cues are clear at key decision-making junctures.
5 Discussion
This study developed a gamified VR-based platform and proposed a low-cost, high-fidelity behavior data collection method, offering significant support for behavioral research. Although the study focuses on PVG Airport as a specific case, the platform’s development framework and the key technologies used to construct lightweight virtual scenes demonstrate broad application potential. These technologies can be extended to create virtual environments for other complex transportation facilities, such as metro stations, railway hubs, and mixed-use transportation hubs, enabling the study of wayfinding behavior in diverse settings.
Wayfinding behavior in transportation buildings is influenced by various factors, including signage, spatial layout, and lighting conditions. The lightweight virtual environment construction method proposed in this study offers significant cost advantages for building virtual scenes of large-scale, complex transportation facilities. It also enables rapid modifications of virtual scenes, enhancing flexibility. The VR platform developed in this study can be deployed on HMD VR systems, supporting researchers in analyzing the impact of various factors on wayfinding behavior in controlled laboratory settings. Furthermore, the gamified VR platform can be extended to simulate emergency evacuation scenarios in transportation facilities, providing data support and decision-making foundations for public safety.
However, despite its advantages in low-cost, high-fidelity behavior data collection, the gamified VR-based platform has certain limitations. First, virtual environments cannot fully replicate the complexity and richness of real-world settings, and the platform’s interactive capabilities require further refinement. Currently, participant-avatar interactions are primarily text-based, which deviates from real-world experiences. Integrating audio-based interactions could enhance immersion and realism. Second, developing the platform in Unity3D with C# requires significant technical expertise, which may limit accessibility for researchers without programming backgrounds.
6 Conclusion
In this study, a VR-based online platform was developed as a parallel virtual environment for PVG and used to collect 2,746 wayfinding samples. The findings demonstrate that this platform is an effective tool for data acquisition and behavioral research. By incorporating serious game elements, both the credibility of the virtual environment and user engagement were significantly enhanced, effectively mitigating any potential reduction in immersion that might result from the online experience. Additionally, the adoption of a B/S architecture improved data acquisition efficiency, underscoring the potential of VR-based online platforms in behavioral studies. With the aid of this experimental platform, we conducted a large-scale wayfinding experiment involving human participants, and the results can serve as valuable references for improvements in airport design.
Future research will focus on extending avatar interaction methods and exploring broader applications across various domains. While the current platform operates in single-player mode, its potential for multiplayer collaboration presents a promising avenue for further investigation. Enhancing multiplayer functionality could introduce new dimensions of interaction, further increasing the platform’s applicability and appeal.