Article Content
1 Introduction
As university campuses continue to expand, particularly with the construction of new campuses, these spaces have emerged as typical mid-scale urban areas, facing increased challenges in management, resource allocation, and planning due to the growing scarcity of urban spatial resources. University campuses are no longer just educational environments, they now encompass a range of urban infrastructure such as residential, transportation, commercial, and service facilities, effectively functioning as multi-functional complexes within the city (Yang, 2020). Given the limitations in urban space, many universities opt for new campus constructions to meet their expansion needs, which raises higher demands on spatial design, resource management, and campus planning. The dispersed and space-limited nature of new campuses requires more efficient and cohesive spatial layouts to maximize functionality and adaptability. This study aims to address the broader challenges associated with university expansion by analyzing the relationship between pedestrian behavior and physical environmental factors, providing data-driven insights to optimize campus spatial layouts.
With the evolution of urban design, human behavior patterns have become a key focus of research. This is because behavior not only reflects the temporal and spatial characteristics of how urban spaces are used but also reveals the needs of the users (Feng T, 2016). As highly concentrated functional spaces, university campuses offer valuable data for analyzing human behavior patterns, providing critical insights for designers and managers to better understand how individuals interact within a specific environment and optimize space and functionality accordingly. Although current research on human behavior characteristics is relatively mature, with a wide range of data collection methods such as Ultra-Wideband (UWB), base station positioning, Wi-Fi positioning, and GPS (Ö Göçer, 2019), single-source data often cannot fully explain the underlying reasons or motivations for behavior. Integrating physical environmental data allows for a more comprehensive understanding of how spatial environments influence human decision-making. These studies primarily focus on identifying spatiotemporal patterns of campus behaviors. However, limited efforts have been made to quantitatively investigate the driving forces behind these behaviors. For instance, while crowd positioning data alone can identify high-density areas, it cannot quantify the impact of physical environments and material space on such clustering behavior.
This study focuses on off-campus public spaces, where the design involves the interplay between spatial location, spatial form, and physical microclimates, all of which serve as driving forces shaping campus behavior characteristics. To address the limitation of insufficient quantitative analysis of driving forces, this study integrates behavioral datasets with environmental variables, offering a new perspective on the relationship between physical environments and human behavior decision-making.
Taking Southeast University’s Wuxi campus as an example, this study adopts a multi-source data fusion approach that integrates location data with environmental data to visualize and analyze behavior patterns within the campus. The Wuxi campus, completed in 2022, offers a relevant case for studying university expansion challenges, particularly in adapting to growing student populations and expanding campus functions. Its location outside urban centers minimizes external influences, highlighting the campus’s self-sufficient design. This makes it an ideal setting for examining how spatial configurations, public space usage, and environmental factors interact in a controlled environment. Through the integration and clustering of heterogeneous data, this study explores the spatial distribution and temporal variations of pedestrian flows while delving into the deeper causes behind these behavioral phenomena. The results provide a solid basis for optimizing campus management and resource allocation, as well as offering valuable insights for preliminary research in planning future university expansions. This study extends our previous work presented at CDRF 2024 (Tang: Symbiotic intelligence, forthcoming), upon which further investigation was conducted.
2 Methodology and collection device
This study encompasses the comprehensive collection, cleaning, and visualization of positioning data and physical environment perception data (refer Fig. 1). The acquisition of sufficient and valid data represents a critical prerequisite prior to data processing. In this chapter, a summary of the methods for collecting positioning data and physical environment data in related studies will be provided, along with a detailed introduction to a custom-developed physical environment sensor system have been designed and implemented. These steps are outlined to ensure a robust foundation for the subsequent phases of data analysis.
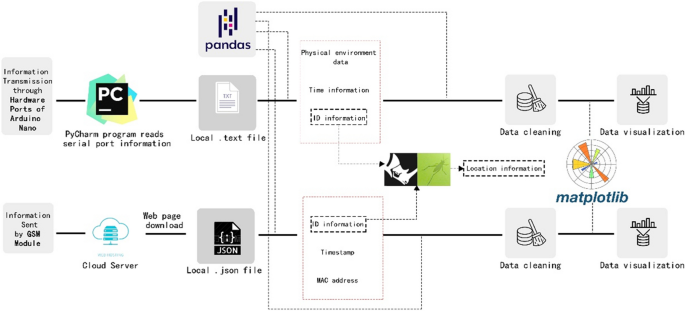
Flowchart for data collection, cleansing, and visualization
2.1 Tracking Crowd Data Using Wi-Fi Probe
Existing crowd tracking methods are often constrained by significant labor and resource requirements, along with potential subjective biases. In 2011, Cyriac et al. first introduced Wi-Fi probe technology, which anonymously tracks Wi-Fi-enabled devices such as smartphones, laptops, and tablets by capturing the devices’ unique MAC addresses. Wi-Fi access point logs from university campuses have been employed, with manual counts conducted for data validation, focusing on the analysis of crowd flow and resource utilization (Fan C, 2023). Methods for the collection and analysis of low-precision Wi-Fi probe data have been explored, addressing key challenges in data acquisition (Li L, 2022). The application of Wi-Fi probe devices has been extended into the field of architectural design, integrating VR and AR technologies to enhance the accuracy of trace analysis for commercial building complexes (Wan H, 2023).
The custom-developed Wi-Fi probe device used in this study consists of a circuit board integrated with Wi-Fi, 4G, and power modules, enabling independent and flexible data collection (refer Fig. 2). The device detects and stores surrounding signal data via the Wi-Fi module, and once a predefined time or data threshold is reached, the data is automatically uploaded to a cloud database via the 4G module for analysis. Powered by a large-capacity lithium battery, the device operates continuously for approximately one month and is encased in an IP65-rated waterproof and dustproof shell, ensuring stable performance under various environmental conditions.
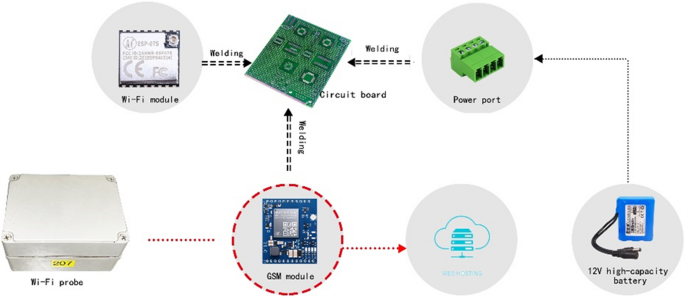
Wi-fi probe component construction and data transmission
Compared to traditional Wi-Fi devices, this probe offers several advantages (Li L, 2022). First, it does not rely on external network signals but instead uses the integrated 4G module to upload data directly to the cloud. Additionally, it features a low-power upload mechanism, where the 4G module is only activated when the preset time or data threshold is met, thus extending the device’s operational lifespan. Furthermore, its battery-powered design allows for installation in any location without reliance on external power sources. The IP65 waterproof and dustproof casing protects the device from environmental interference, enabling flexible deployment in various areas. Researchers can remotely operate the device and collect data without the need for on-site maintenance. This Wi-Fi data collection system is particularly suited for long-term, large-scale crowd location data acquisition, making it ideal for campus-scale studies. The device offers high independence, low invasiveness, and the ability to be quickly deployed and removed, effectively reducing the complexity and difficulty of system setup and maintenance.
2.2 Custom-Developed Physical Environment Sensor System
Conventional approaches for obtaining physical environment data of buildings, including satellite remote sensing, building information modeling (BIM) simulations, and GIS-based regional meteorological data, have been widely employed in previous research. A study was conducted at a university, simulating four environmental dimensions—sound, light, heat, and landscape—to analyze the potential influence of these physical factors on human behavior using environmental simulations (Yizhou W, 2022). Additionally, a comparative analysis of datasets from Energy Plus weather (EPW), urban climate stations, and local microclimate stations was performed, focusing on the campus of Southeast University, to benchmark urban local weather through long-term monitoring (Wei W, 2021). With the advancement of embedded system technology, the use of sensors for monitoring physical environments has become a more effective approach for medium and small-scale spaces. In previous studies, purchasing meteorological stations was the most common approach; however, these products are often prohibitively expensive, especially when multiple monitoring points are required.
To address these limitations, a cost-effective sensor system was developed for this study (refer Fig. 3). Firstly, compared to the more expensive track-mounted temperature and humidity sensors commonly used in meteorological stations, the more cost-effective and compact DHT11 temperature sensor and analog light-sensitive sensors were selected, meeting the required accuracy while reducing costs. For wind speed measurement, a commercially available three-cup ABS material anemometer was used, as the study did not require the measurement of dust, wind direction, or sound, thus eliminating the need for related sensors. Secondly, in terms of information communication, as the communication range for this study was limited to the campus, the LoRa (Long Range) module was chosen to establish a local area network (LAN) within the campus, due to its advantages in long-range, low-power, and low-cost wireless transmission. With a coverage radius of 400 m or more from the campus center, the entire campus was covered. Although the LoRa module is rarely used in urban areas due to its susceptibility to signal obstruction, after several signal tests, two LoRa gateways and a polling mechanism were implemented to enable communication between the modules. This approach effectively replaced the more expensive 4G module, thereby reducing costs. Finally, in terms of sensor integration and packaging, to improve the stability of the LoRa signal, the main control board (Arduino Nano), LoRa modules, and various sensors were integrated using a breadboard and dedicated jumper wires. Additionally, waterproof enclosures, waterproof cable glands, and rubber bolts were customized to protect the components. All components, except for the wind speed sensor and LoRa antenna, were enclosed in these protective housings. During over two weeks of outdoor environmental testing, it was found that, except for one day of severe snowfall that rendered the wind speed sensor inoperable, adverse weather conditions such as rain did not affect the normal operation of the devices.
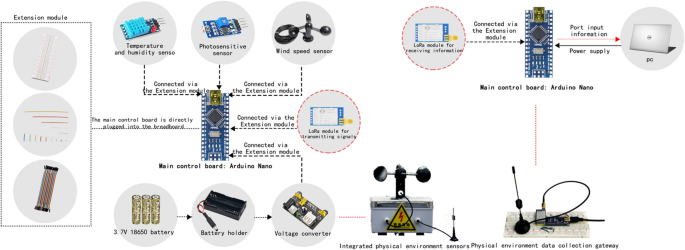
Physical data sensors construction using embedded system technology
3 Data collection and cleansing
3.1 Data collection
This study focuses on the Wuxi campus of Southeast University, which covers an area of 321,300 square meters and is primarily occupied by graduate students. The campus layout is circular, with several functional zones constructed around a central landscape area.
To comprehensively capture representative crowd behavior trajectories, the campus was divided into eight zones: student dormitory area, academic experiment area, specialized teaching area, life services area, library, central landscape area, public teaching area, sports and fitness area, and faculty dormitory area. The placement of Wi-Fi probe monitoring points had to include the most frequently used intersections and public spaces in each zone, while following these principles:
- ➀ Monitoring at the most frequented intersections and public spaces in each zone is required.
- ➁ Paths between monitoring points should remain distinct.
- ➂ Away from buildings is necessary to minimize interference from indoor fixed smart devices.
- ➃ Sufficient spacing between monitoring points is required to reduce ping-pong data.
- ➄ Monitoring at all campus entrances and exits is mandatory.
Through one week of preliminary data collection, the positions of 19 monitoring points were finalized, with key traffic nodes and public space nodes such as 202, 204, 205, 208, 213, 210, 215, 214, 211, and 299 being selected based on usage frequency (refer Fig. 4). The data from these 19 monitoring points were directly uploaded to the cloud server via 4G modules. During the 14-day winter data collection period, a total of 28.87 million positioning data points were gathered.
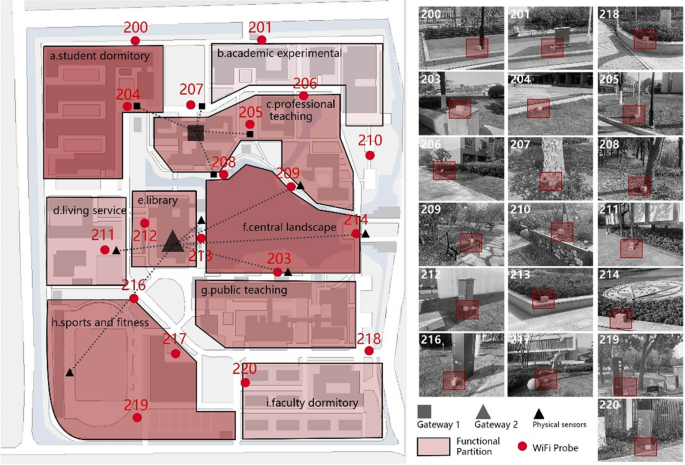
Layout of monitoring points for collection devices
The physical environment monitoring points were placed in the main public spaces on campus, within the range of one of the Wi-Fi probe monitoring points. Sensors were placed at the same height as where people typically stop or stand, such as on benches and transformer boxes, to ensure that the physical environment monitoring accurately reflected people’s perceptions. These monitoring points overlapped with the key traffic nodes and important public space nodes mentioned earlier, with a total of 10 observation points. Data from these 10 monitoring points were transmitted via LoRa modules to two gateways located on the 5th floor of the campus library and the 1st floor of the Liang Jiang Institute. During the 14-day winter data collection period, a total of 3.4 million physical environment data points were collected.
3.2 Data cleansing
The following table shows the data structure of the Wi-Fi Detection and Physical Sensor datasets (refer Fig. 5). The Wi-Fi data includes fields for Document ID, MAC Address, Base Station ID, RSSI Signal Strength, and Timestamp, while the Physical Sensor data captures readings for temperature, humidity, light, and wind speed, along with the corresponding Base Station IDs and timestamps. Data cleaning aims to detect and remove dirty data and noise from the raw dataset, ensuring that the cleaned data more accurately reflects the essence of the information and enhances the effectiveness of data visualization. For Wi-Fi data, as a significant portion of the information may be invalid, data cleaning becomes a critical step in the analysis process.
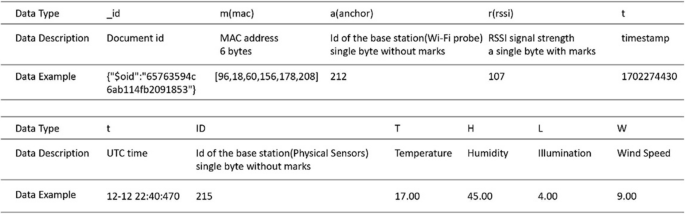
Data Format of WI-FI Probe Data and Physical Environmental Data
3.2.1 WI-FI probe data cleaning
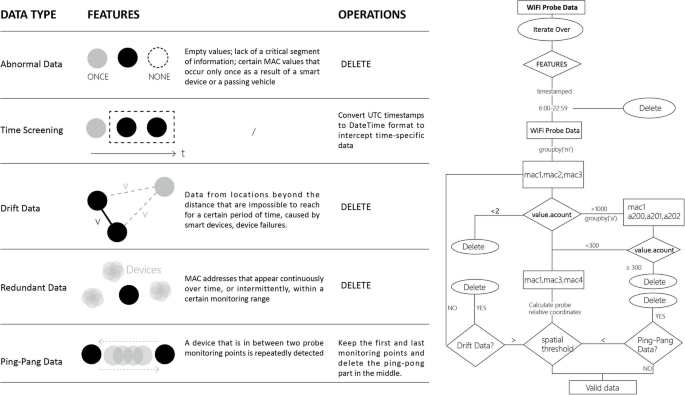
The Wi-Fi data cleaning framework typically involves the following steps: ① Data import, where raw information is converted into array or Data Frame format; ② Data preprocessing, which involves cleaning various outliers and invalid data; ③ Requirement analysis, where new data features are created and more useful information is extracted from the existing features; ④ Data resampling, where a subset of data is selected based on the analysis requirements to reduce data complexity and volume.
The data preprocessing stage requires judgment based on the specifics of the project. After analysis, five types of data were identified as requiring preprocessing (refer Fig. 6): ① Anomalous data: Data that is invalid due to missing key information. Such data can either be directly cleaned or replaced with the average value from a nearby period. ② Time restrictions: Data collected between 11 p.m. and 6 a.m. was removed to reduce computational load. ③ Drift data: Data indicating locations outside a plausible range for pedestrian speed, which may result from device malfunctions or positioning data from individuals on campus vehicles. ④ Redundant data: Records of the same MAC address within the same time window, such as a MAC address that continuously appears within a monitoring range for an extended period, which is from a specific smart device. MAC addresses that intermittently appear in a particular probe area are from smart devices with sleep functions, and this data is excluded from the crowd location data. ⑤ Ping-pong data: Data from devices detected repeatedly by two monitoring points as they move between these points. For such data, we assign it to one monitoring point, retaining the first and last monitoring points while deleting the repeated intermediate data. A cleaning framework was established to sequentially process these five types of data, improving cleaning efficiency. Ultimately, 400,000 valid data points were obtained, with a cleaning rate of 96%. This high-quality dataset provides a solid foundation for subsequent analysis.
Layout of monitoring points for collection devices
3.2.2 Physical environmental data cleaning
The data cleaning framework for physical environment data primarily consists of two parts: data import and data preprocessing. The information collected by the gateway is written into a local.TXT file via the computer’s serial port, which is then converted into a.CSV or.JSON file for subsequent cleaning. Due to potential data loss during transmission through the LoRa module, extracted keyword information from different parts must be merged into a complete dataset. Additionally, outliers are filtered by setting thresholds for specific values.
4 Spatial–temporal analysis of crowd behavior
4.1 Spatial Visualization of physical data
By distributing the physical environment data spatially in the form of heat maps, it is possible to visualize the differences in the physical environment of different public spaces on campus (refer Fig. 7). The following characteristics were observed when observing the thermograms: ①The monitoring points around the center lake, such as 213, 214, and 215, exhibited higher wind speeds. It is worth noting that point 204 has an unusually high wind speed despite being in an area sur-rounded by buildings. This area is a windy plaza that is usually underutilized despite the presence of public facilities. ②215, 205, 202, and 204 have relatively high temperatures. Among them, 202, 204, and 205 are in the dormitory area and workstation complex, which have higher temperatures relative to other public spaces. ③209, 214, 215 and 213 at the lake shore have significantly higher humidity than the other monitoring points, while point 299 located in the play-ground has the lowest humidity and is the driest public space. ④213 on the east side of the lake and 215 on the south side of the lake have the highest illuminance. They share the common characteristics of being open environments, away from buildings, and shaded by fewer trees.
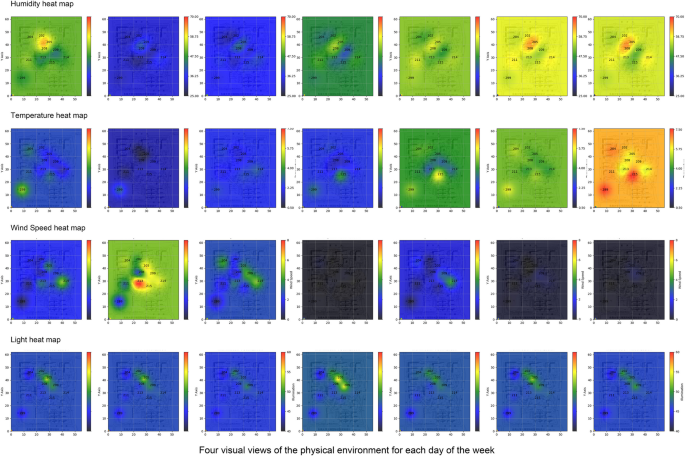
Four visual views of the physical environment for each day of the week
4.2 Temporal visualization of Wi-Fi probe data
This section presents a temporal analysis of Wi-Fi probe data to understand campus mobility patterns over different time scales. The analysis is divided into weekly and hourly visualizations to capture both broader trends and detailed variations (refer Fig. 8).
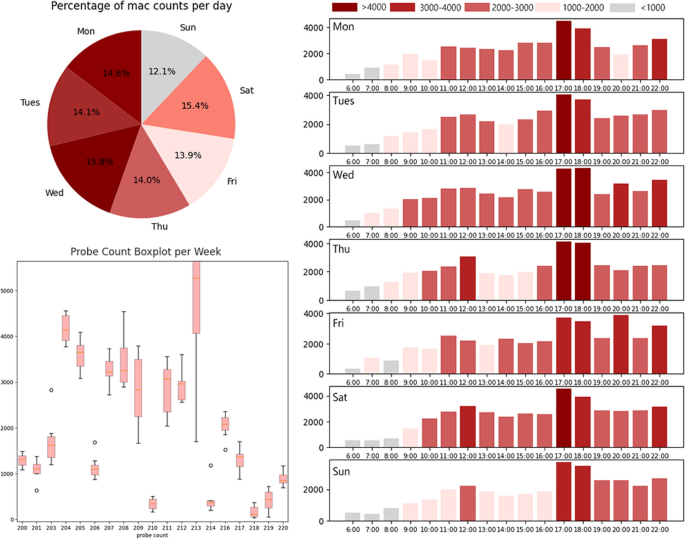
Timing visualization of detection probes
The weekly analysis of Wi-Fi probe data reveals distinct usage patterns across different days. Device detection varied significantly, with Friday showing a decrease compared to Saturday, while Monday and Tuesday showed minor differences. The most trafficked areas included the Library, Student Housing, and Teaching zones, while the least trafficked areas were near the East Gate and Public Garden. The Library and Center View areas exhibited the highest variation, highlighting fluctuating activity.
The hourly analysis provides insights into daily activity patterns. Visitor numbers peaked between 9:00 and 23:00, with notable peaks from 16:40–18:30 and 21:30–22:30, likely corresponding to class transitions and social events. Thursdays and Saturdays showed high foot traffic at 11:00 p.m., while Sundays had noticeably lower daytime traffic, indicating reduced activity.
4.3 Trajectory optimization of Wi-Fi probe data
Through visualization techniques, the preferences for walking paths can be restored. However, due to the limited number of Wi-Fi probes, the initial data could only be represented as “point-to-point” polylines, making it difficult to accurately reflect the actual trajectories. To optimize the trajectory map, this study modeled the campus road network as a graph, dividing it into road nodes and paths, and applied Dijkstra’s algorithm to find the shortest paths between different monitoring points (refer Fig. 9). The trajectory of a single MAC address over the course of a day was projected onto a 2D plane, where the size of the points indicates the duration of stay, and the thickness of the lines represents the frequency of walking. By analyzing the overall trajectories over a seven-day period on campus, several key public space nodes were identified, such as the library, the central landscape area, and dormitory areas, along with preferences for specific walking paths (refer Fig. 10).
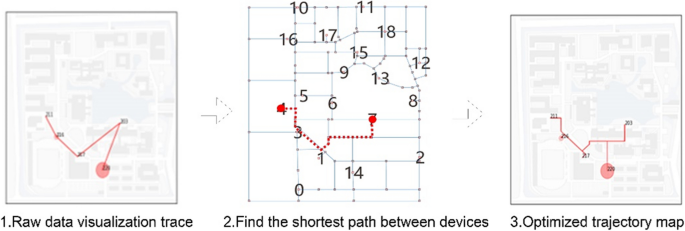
Schematic diagram of optimized trajectory using Dijkstra algorithm
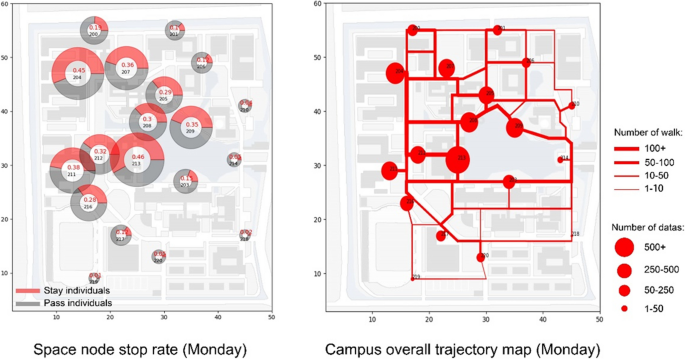
Sample of Stopover Rate Plan and Trajectory Map
Meanwhile, physical environmental data exhibit variations in microenvironments within the same region, primarily influenced by campus layout. Therefore, conducting a correlation analysis between the dwell rate in campus public spaces and the physical environment is a crucial aspect of an in-depth exploration of campus layout. By determining the minimum dwell time of samples on the same device within a specified period in positioning data, it can be assessed whether a sample has lingered at a device point. In this study, the stop rate (J) is calculated as the ratio of the number of unique MAC addresses (W) to the count of recorded MAC addresses (S), indicating preferences in people’s dwellings at different monitoring points in space.
5 Behavioral characterization of crowd activities
5.1 Trajectory visualization and clustering
5.1.1 Preparation of dataset
In the previous sections, we explained how to plot 2D trajectories. However, as 2D trajectories cannot capture time information, this representation introduces time as the third dimension. If a MAC experiences a stationary behavior, the trajectory grows along the z-axis. This approach allows the observation of the trajectory’s starting and ending points, facilitating the inference and categorization of activities. Based on the cleaned data, a total of more than 9,000 2D and 3D trajectory maps were obtained in this study within one week (refer Fig. 11).
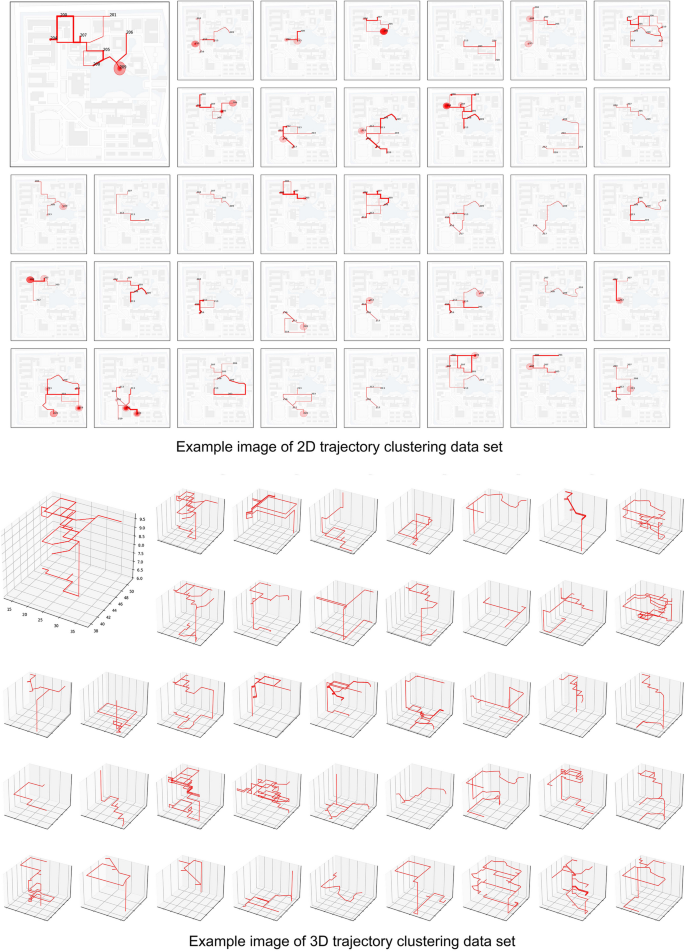
Samples of 2D-3D trajectory map used as a training set for clustering
5.1.2 Clustering of trajectory
The diverse coordinate patterns of each trajectory present challenges in intuitively identifying patterns from numerous images. To address this, a Convolutional Auto-Encoder (CAE) was employed for trajectory clustering. In this study, a dataset of RGB images with pixel dimensions of 88 × 88, collected over the course of a week, was used as the training base. During the clustering analysis, feature extraction was conducted using the pre-trained ResNet-50 model. Following a series of convolutions and pooling operations, the feature dimensions were reduced, after which the K-means + + clustering algorithm was applied. The clustering outcomes were subsequently visualized in three dimensions using t-SNE. Both the 2D and three-dimensional clustering of trajectories resulted in four distinct clusters (refer Fig. 12).
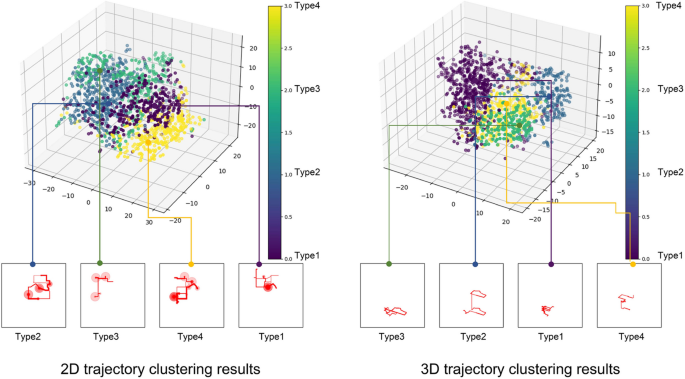
Clustering results for 2D-3D trajectories
Based on the clustering results of the two-dimensional trajectory patterns, campus trajectories can be categorized into four types. The first type consists of closed-loop trajectories centered around the main landscape areas, with prolonged stopovers at two primary public spaces, indicating low mobility and high congregation behavior. The second type is characterized by linear and unidirectional trajectories with short distances, suggesting purposeful activities where students move directly from dormitories to food lockers or cafeterias for meals. The third type exhibits broader spatial coverage, comprising multiple medium-length trajectories, reflecting complex behaviors that involve crossing multiple functional areas on campus, such as classrooms, libraries, and activity rooms. The fourth type is restricted to a single area with one prominent stopover point, illustrating long-duration usage and concentrated activities within laboratory buildings. These trajectory patterns are indicative of four corresponding behavioral modes:①Scenic and Gathering Activities: Activities within the landscape areas, predominantly leisure and social interactions. ② Quick Dining Activities: Purpose-driven movements where students navigate directly to dining areas for meals. ③ Cross-Regional Learning and Social Activities: Frequent transitions between functional areas, encompassing learning, socializing, and short-term leisure. ④ Focused Study and Experimental Activities: Long-duration stay within academic spaces, dedicated to laboratory work or intensive study. In the three-dimensional trajectory clustering results, the trajectory ranges were generally singular and limited, predominantly consisting of closed-loop trajectories around specific points, with a few non-closed trajectories differing in their starting points and endpoints. This indicates that most activities take place within confined areas, while some unique movements connect different zones, revealing less common usage patterns.
5.2 Correlation between stopover rates and environment data
To explore the relationship between location data and physical data, we used regression models. Stopover rates were treated as the dependent variable, with the four environmental indicators serving as independent variables. Data collected from probes and environmental sensors over a specific period were standardized to ensure model robustness. Multiple regression analysis was performed to evaluate the relationships using correlation coefficients (R-values) and fitted regression curves.
As can be seen from the analysis results (refer Fig. 13), there are weak correlations in five spaces. Nodes 207, 216, 211, 213, and 205 showed weak correlations with all environmental variables. These spaces are predominantly transitional areas, such as open spaces between teaching buildings, spaces in front of the cafeteria, playground, and library. Due to a lack of stay-related facilities, these spaces primarily serve as transit zones, resulting in weaker associations with environmental factors. Other spaces have weak correlations with specific physical environmental factors. The analysis revealed that the public spaces 209 and 208, located in the northern section of the central landscape area, demonstrated a moderate correlation with wind speed (R = 0.33), indicating that wind comfort significantly influences user behavior in these areas. Space 215, situated at the junction between the central landscape and the teaching zone, exhibited a positive correlation with light intensity (R = 0.45). This space, featuring public seating, lawns, and decorative flower beds, provides a conducive environment for relaxation and observational activities. Space 204, located in the dormitory living area, displayed a negative correlation with humidity (R = −0.3). This flowerbed area, often used for socializing and waiting, appears to discourage prolonged stays under high humidity conditions. At the main entrance of the school (space 214), a positive correlation with temperature (R = 0.35) was observed, suggesting that favorable temperatures promote social and welcoming activities in this key entry point of the campus.
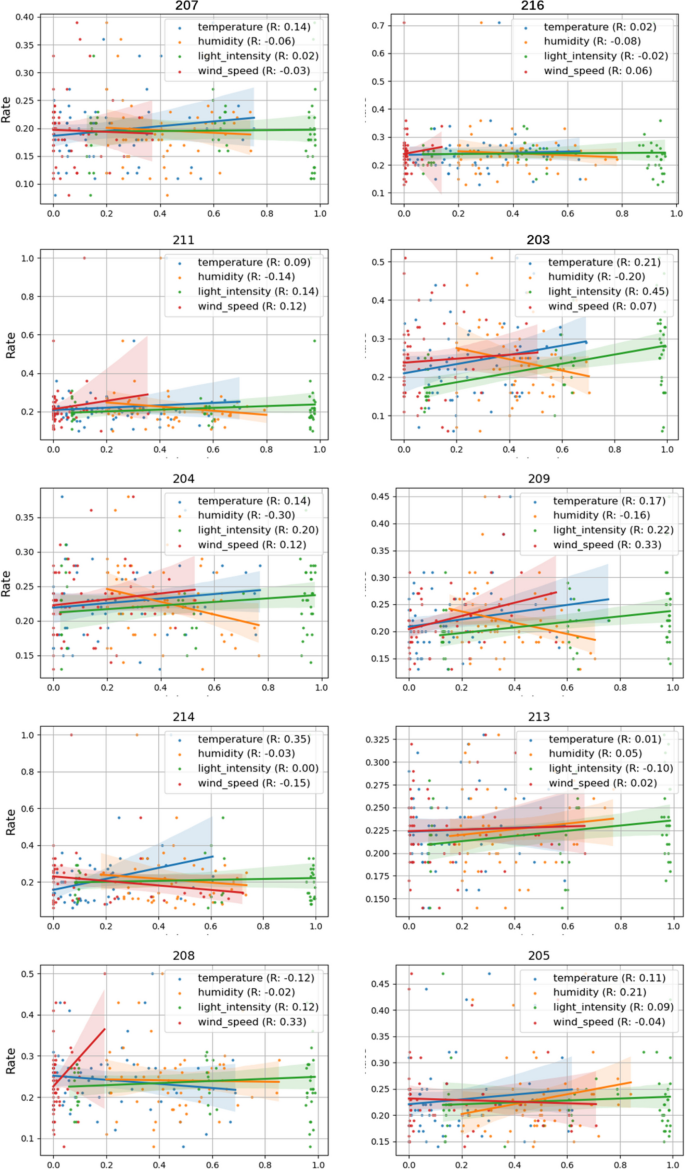
Correlation results
Spaces with weak correlations are primarily transitional areas designed to serve transportation functions, such as open spaces between teaching buildings or in front of the library. These areas show low usage efficiency and weak associations with physical environmental variables. To enhance the functionality and comfort of these spaces, it is recommended to incorporate basic facilities such as seating or shading structures to encourage more prolonged stays. In contrast, spaces with strong correlations exhibit clearer environmental influences, such as areas with higher wind speeds or elevated temperatures.
Optimizing the design of these spaces, for example, by adding windbreaks to improve wind conditions or shading structures to mitigate heat, can further enhance their efficiency and provide users with a more comfortable experience.
6 Summary and discussion
This study combines Wi-Fi probe technology with physical environment sensors to conduct an in-depth analysis of pedestrian flow and the physical environment on the Wuxi campus of Southeast University. Firstly, a custom-developed data collection and analysis system was created, combining Wi-Fi probes, mobile networks, and cloud servers for crowd location tracking, alongside another system incorporating physical environment sensors and LoRa communication infrastructure to collect environmental data. This integrated approach ensures effective data gathering and supports research on urban spaces at multiple scales. Secondly, a pre-experiment was conducted to optimize the positioning of the devices, and a robust Wi-Fi probe data cleaning process was introduced to handle various types of invalid data, including abnormal data, drift data, redundant data, and ping-pong data. This cleaning process significantly enhances the accuracy and reliability of data analysis. Additionally, both positioning and environmental data were subjected to temporal and spatial visualizations, as well as correlation analyses, which provided a clearer understanding of the physical microclimate characteristics of campus public spaces at different times and how pedestrian flow varies accordingly. This study utilized optimization algorithms to simulate crowd movement trajectories, clustering over 9,000 trajectory maps and identifying four distinct behavioral patterns in both two-dimensional and three-dimensional spaces. By analyzing trajectory length, the size and number of stopover points, spatial coverage, and directional attributes, four campus behavioral modes were derived. Further analysis was conducted to investigate the influence of environmental factors on public space stay behavior, distinguishing between weakly and strongly correlated spaces. The findings revealed that stay rates in different spaces were influenced by varying environmental variables. Based on these results, targeted optimization strategies were proposed for different types of public spaces, providing scientific guidance for enhancing the comfort and functionality of campus environments.
From preliminary research to the analysis of the current campus situation, this data-driven research process holds practical significance for assessing and improving urban environments and validating design proposals. Particularly for newly constructed or improved urban public spaces, a comprehensive analysis of physical environment data and pedestrian behavior data can directly guide changes in local microenvironments, prompting timely adjustments to urban spaces and achieving sustained and effective utilization.
Despite achieving initial results, this study faces several notable limitations. Firstly, there are challenges in completely removing noise data during the cleaning of positioning data, particularly in addressing ping-pong data, which may impact the accuracy of the dataset. Due to the limited sample size, the three-dimensional trajectory clustering results did not clearly reflect specific crowd behaviors. Secondly, the physical sensors based on LoRa modules are affected by buildings and trees, which may lead to signal loss and limitations in communication range, indicating a need to improve spatial distribution accuracy. Lastly, the data collection only covered two weeks during winter, a season characterized by lower crowd activity and dwell rates, making it difficult to comprehensively reflect the general situation across different seasons.
Due to the independence of the data collection devices in this study, the research can be extended to different cities and cultural contexts, exploring applications under various environmental conditions. At the same time, improvements in data processing algorithms can enhance data quality, increase analysis accuracy, and improve computational efficiency. Future research can further optimize the data collection and analysis process through several improvements. First, enhancing data cleaning techniques is crucial, especially for addressing issues such as noise, drift data, redundant data, and ping-pong data in Wi-Fi probe data. Advanced algorithms, such as machine learning-based methods, can automatically detect and correct invalid data, or multi-source data cross-validation can be used to improve data quality. Second, expanding the sample size will increase the representativeness of the study, especially when collecting data across different time periods, seasons, and regions. This helps verify the adaptability of the model in various environments and reduce bias. Additionally, improving the deployment accuracy of Wi-Fi probes and physical environment sensors is key. Precise sensor placement can enhance the spatial accuracy of data collection and reduce signal loss. Lastly, extending the data collection period will help obtain more comprehensive behavior patterns and environmental characteristics. Collecting data across seasons can reveal the long-term effects of climate change on crowd behavior while avoiding the influence of extreme weather and short-term anomalies on the results. These improvements will enable the study to more comprehensively and accurately reflect the dynamic characteristics of campus spaces, thereby enhancing the practicality and universality of the research.