Article Content
1 Introduction
The recent rapid rise of Generative Artificial Intelligence (GenAI) models has already begun to affect many areas of our lives. GenAI is already reshaping the traditional landscape of numerous industries, including architecture (Epstein et al., 2023). Here we evaluate the ability of one popular GenAI model (DALL-E2) to convey architectural spaces and ambiances, comparing its performance with a viable alternative.
GenAI is characterized by its capability to generate content that closely resembles human-created content, such as text, images, video, music, and computer code. This is achieved through machine learning techniques, particularly deep learning, which allow these systems to identify and mimic patterns, styles, and structures found in the input data on which they are trained. GenAI models, like Generative Pre-trained Transformer (GPT) models, leverage publicly available digital content data to read and produce human-like text in several languages, resembling a capacity for creativity in writing. Such models are revolutionizing the architectural design process, from conception to visualization to delivery (Nayeri, 2023).
1.1 Use of generative AI in design, architecture, and architectural research
GenAI introduces a transformative approach to visualizing and conceptualizing design, bridging the gap between imagination and concrete visual representations. GenAI provides numerous tools for architects, offering them a faster and more dynamic way to bring ideas to life than previously possible. The tools facilitate the exploration of a multitude of design variations in a fraction of the time required by traditional techniques, allowing for a more expansive and efficient creative process.
GenAI is not just about enhancing visualization but also about expanding the horizons of architectural creativity. The different GenAI tools bring a variety of strengths to architectural visualization, ranging from Stable Diffusion’s adaptability in image generation to DALL-E2’s precision, and MidJourney’s creative versatility. In architectural research, GenAI can serve as a transformative tool for hypothesis testing and simulation, allowing researchers to visualize the impacts of various architectural features and configurations on space usage (Zhang et al., 2024). According to Nelson (2023), GenAI models like ‘Interior AI’ enable architects ‘to see a space from a fresh perspective without the need to mock up designs or rearrange furniture,’ thereby providing them with tools to experiment and unveil designs that may have previously been unimaginable, enriching the creative process as a result.
Recent studies have illustrated the growing interest in using GenAI for architectural design generation. The potential of AI to produce “master-quality” designs has been demonstrated, focusing primarily on improving the generation process rather than evaluating the outcomes (Chen et al., 2023). This highlights a growing need for domain-specific evaluation methods for AI-generated imagery in architectural visualization (Castro Pena et al., 2021; Chen et al., 2024).
GenAI has shown significant potential in aiding the early design stages, offering architects innovative tools for visualization and concept exploration. Some studies suggest that while Generative AI can speed up the ideation process and provide new design alternatives, it often struggles with domain-specific architectural terminologies and generating practical, realistic designs (Zhang et al., 2023). This finding aligns with broader research indicating that GenAI models effectively use psychological and technological insights to interpret human emotions across sectors, but still fall short of understanding the depth of human emotions (Predin, 2024).
Platforms like ChatGPT-4 excel in interpreting emotions from text, reflecting advancements in AI’s emotional intelligence (Elyoseph et al., 2024), but a significant challenge lies in bridging the gap between AI’s technical capabilities and its practical application in architecture, where a deep understanding of human-centric design elements is crucial. Achieving effective emotion mapping and interpretation in architectural contexts is complex, requiring ongoing enhancements in AI models to better understand and utilize architectural prompts (Li et al., 2023).
Amidst its widespread adoption, GenAI’s application in architecture promises unprecedented opportunities for design innovation. However, very little is known about the ability of the images generated by GenAI to serve the purposes for which they were designed. For example, when an architect generates an image of a cozy kitchen, how effective are common GenAI models in generating something that is widely recognized as a kitchen (vs. another space) and consensually considered to be cozy (vs. another ambiance)? And are such images superior to the viable alternatives for rapidly gathering example images, such as basic Internet image searches? For GenAI to truly become an effective tool in architectural design, it is crucial that the images generated by these models are able to effectively convey the spaces and ambiances they were meant to convey. Virtually no research attention has been directed to evaluating these basic questions. Thus, this study aims to evaluate the proficiency of current GenAI models, specifically the DALL-E2 model, to produce images that accurately depict the intended spaces and convey the intended ambiance. Equally importantly, we hope that establishing a robust framework for evaluating GenAI models will help architects and researchers assess both the potential and limitations of these and other new tools as they emerge.
In particular, the present study explores GenAI’s ability to translate textual descriptions into visual representations that align with architects’ perspectives, examining whether these AI-generated images can effectively convey spaces and ambiances as intended. The investigation aims to provide insights into the capabilities of GenAI tools in architecture, contributing to discussions about incorporating AI into architectural design and research practices As a starting point, we have chosen to focus on residential spaces because they include a wide array of spaces (e.g., kitchen, bedroom, garage, etc.), and a wide range of ambiances are often sought out in them. Therefore, drawing on previous research (Graham et al., 2015), the present work focuses on the spaces and ambiances sought in homes. In doing so, we hope to shed light on current GenAI models’ versatility and adaptability in architectural visualization across multiple spaces and intended ambiances. As a benchmark against which to evaluate the GenAI models, we used real photographs obtained via Internet image searches because they would be a viable alternative method by which practitioners and researchers might seek to obtain images of spaces.
2 Methods
This study consisted of two phases (see Fig. 1A). In Phase 1: Image Sourcing, the images were sourced via Generative AI (GenAI) and Google Image (GI) search. In Phase 2: Judging Images, the images were evaluated by human observers.
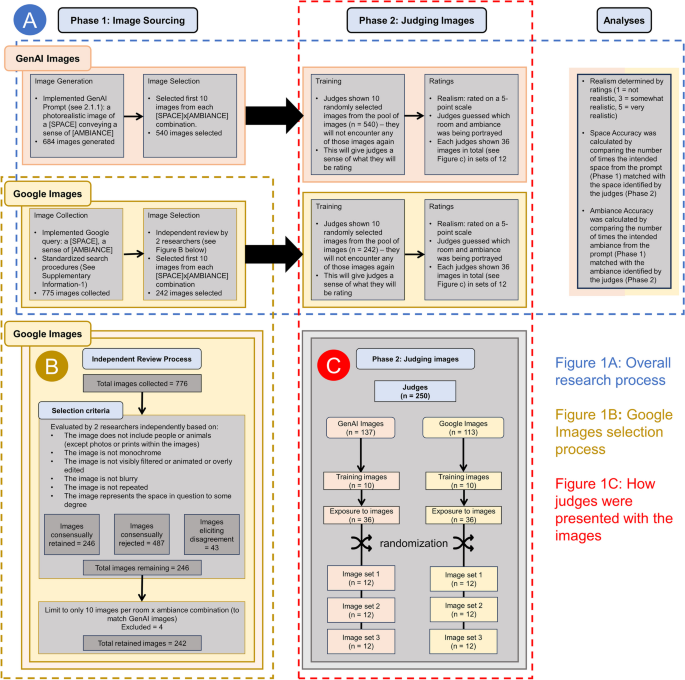
Flowchart of the study
The selection of spaces and ambiances was based on previous research, which in the course of developing the Inventory of Desired Ambiances in the Ideal Home (IDAIH), sought to identify the most commonly desired ambiances in each of 18 spaces of a residential home (Graham et al., 2015). Table 1 shows these spaces along with the three ambiances found in previous research to be most desired in each of those spaces. The table also shows the total number of images selected in the present research to be presented to human observers for each space-ambiance combination using GenAI and GI. GI served as the benchmark, providing a comparative basis by which to evaluate the generative AI image models.
2.1 Phase 1: image sourcing
2.1.1 Generative AI
Midjourey and OpenAI’s DALL-E are the most commonly used AI image generators, each with its own unique capabilities (Thormundsson, 2023). Midjourney, operating through Discord, is particularly strong in creating artistic and abstract imagery. DALL-E2, on the other hand, creates hyper-realistic images on its platform and is noted for its ease of use and direct approach (Shaikh, 2023). Based on its user-friendly interface, affordability, and (at the time of research) fast-growing popularity, we explored DALL-E2 for this study.
DALL-E2, an advanced version of DALL-E, is a generative AI system developed by OpenAI (OpenAI, 2021). This system is trained to create realistic images and art from text descriptions, using a dataset of text–image pairs. It leverages GPT-3, a language processing model, and Image GPT (iGPT), an image generation model.
2.1.2 Prompt engineering
To generate images that convincingly depicted residential spaces with their intended ambiances, we developed a systematic structured format for the instructions to provide to the text-to-image generator. Our goal was to provide clear and concise instructions for DALL-E2 while ensuring that both the space and ambiance were explicitly specified.
The process of prompt engineering involved iteratively refining the prompts until our goal was reached (a detailed description of the prompt-development process, including example images, is provided in Supplementary Information-2). Several prompt variations were explored to optimize the generation of images that not only depicted the spaces but also convincingly evoked specific ambiances. The preliminary image outputs were evaluated and used to tailor the prompts for improved image generation. The resulting prompts were in the following structured format:
“a photorealistic image of a [SPACE] conveying a sense of [AMBIANCE]”
To keep the total number of images manageable for participants, we sought to generate 10 images per space-ambiance combination. Dall-E 2 generated images in sets of four. So, to obtain at least 10 images, we ran each prompt three times, resulting in 12 images per combination. The first 10 images were then selected bringing the total number of images used to 540 (i.e., 18 spaces × 3 ambiances × 10 images).
2.1.3 Google images
To provide a benchmark by which to evaluate the results of the AI-generated images, we also obtained a set of images from Google Images (GI), known for its extensive image database. Similar to the approach with DALL-E2, the aim was to find a method that could mirror GenAI models while still being accessible to researchers and practitioners. GI has a vast repository of images tagged with descriptors, making it an ideal tool for matching images with specific ambiances and space types. It also allows users to search this repository using keywords, phrases, or even direct upload for reverse-image searching. Its advanced search filters enable users to refine their search based on parameters like image size, color, type, usage rights, and time (Google, n.d.).
2.1.4 Google images search term selection
In sourcing images here, we applied a systematic process for looking up and selecting images that could, at least in theory, convincingly convey the intended ambiance. To eliminate any potential effects of cached data on the searches, all searchers were undertaken using incognito mode. To ensure the images were suitable for research and of sufficient clarity and detail, we filtered them to exclude explicit content and copyrighted images, and we specified a resolution threshold of at least 1024 by 750 or 750 by 1024 pixels to maintain their legibility (see Supplementary Information-1 for full list of criteria), resulting in the following structured format:
“a [SPACE], a sense of [AMBIANCE]”
We sought to identify 810 images (i.e., 18 spaces × 3 ambiances × 15 images). We aimed for 15 images to allow us to give us a buffer in case some were not suitable (see Fig. 1B) but in some cases 15 could not be found, resulting in a total of 776 images. The set of images was subjected to a set of selection procedures to make sure they were suitable for presentation as stimuli and broadly matched the kinds of images produced by the AI. Some of these procedures were based on objective information (e.g., filtering for only photos, filtering for only images with the proper usage license). However, some of the procedures relied on human judgment. For example, the final AI-generation procedures always created images that excluded humans or animals without any need to explicitly exclude them, whereas the GI occasionally included humans or animals in the images. The presence of humans or animals, plus a set of other criteria (see Fig. 1B), could most effectively be detected using human judgment. Therefore, 2 research assistants (who did not serve as judges in other parts of the study) independently reviewed the images to ensure the images were unedited and were of sufficient quality for judging, filtering out cases with higher contrast or increased brightness that made the photo appear unreal, exaggerated, or blurry (see Fig. 1B). There was strong agreement between the independent judges (Cohen’s Kappa = 0.88), who were in agreement 94% of the time. To err on the side of caution, the remaining 6% of images over which the judges disagreed, were eliminated from further consideration. To match the procedures used in the GenAI condition, for space-ambiance combinations with more than 10 remaining images, we selected the first 10 images. This process led to the selection of a total of 242 images, with many space-ambiance combinations having less than 10 usable images (in some cases, zero), as indicated in Table 1.
2.2 Phase 2: judging images
2.2.1 Participants (Judges)
A total of 283 participants, mostly undergraduates at a large public US university, were recruited, serving as judges of either the GenAI or G-I (with none judging both kinds of images).
2.2.2 Generative AI
A total of 158 human judges, were recruited (M.age = 21.25 years, SD = 9.22, range = 18–73 years; 74.17% female, 23.84% male, 1.32% other, 0.66% preferred not to say; 32.45% White, 22.52% Hispanic or Latinx, 21.19% Asian or Asian American, 15.23% Multiracial, 7.95% Black or African American, 0.66% other). Judges were mostly (90.7%) undergraduate students and were compensated with 0.5 research credits for their time. 21 judges were excluded from the analyses for failing an attention check (n = 19) and/or not completing the survey (n = 14), resulting in a total of 137.
2.2.3 Google images
A total of 125 human judges, were recruited (M.age = 20.06 years, SD = 5.96, range = 18–73 years; 67.02% female, 29.20% male, 1.77% other; 28.32% White, 27.43% Hispanic or Latinx, 22.12% Asian or Asian American,15.93% Multiracial, 5.31% Black or African American, 0.88% other). Judges were mostly (95.6%) undergraduate students and were compensated with 0.5 research credits for their time. 12 judges were excluded from the analyses for failing an attention check (n = 3) or not completing the survey (n = 9), resulting in a total of 113.
2.3 Materials
For both Generative AI and Google Images, participants completed the study in the form of an online survey created in Qualtrics, an online survey platform. After providing informed consent, participants filled out a brief measure of the Big Five personality dimensions (Ten Item Personality Inventory [TIPI], Gosling et al., 2003) that is not included in the present analysis. Participants then completed the image judgment phase. Next, participants provided demographic information and were asked to provide optional feedback or comments about the image-judgment phase.
This study was approved by the University of Texas at Austin Institutional Review Board and the experiment was conducted in accordance with all relevant guidelines and regulations. The study is part of a larger experimental protocol where the data collected will be analyzed to determine the presence of systematic connections between the physical elements of space and ambiance within those spaces. Hence, the broader study includes elements (e.g., TIPI) not analyzed here.
2.4 Evaluation metrics
To assess whether the generated images effectively conveyed the intended space and ambiance, this study implemented three subjective evaluation metrics—realism, space accuracy, and ambiance accuracy. The selection of these metrics was based on practical considerations and observations made during the initial stages of this research.
Space and ambiance accuracy were chosen to reflect the key elements architects and designers focus on when visualizing spaces. As noted by Graham et al. (2015), the combination of room type and desired ambiance is crucial in architectural visualization. These criteria assess how well GenAI models can translate textual descriptions of spaces and ambiance into visual representation.
It quickly became apparent while using GenAI to generate images, that there are significant variations in perceived realism of the images; this was recognized as a potential confound in the analyses of space and ambiance accuracy. Initially, accuracy was conceptualized as the GenAI model’s ability to assemble the correct elements in a compelling configuration to convey spaces and ambiances convincingly. However, the existence of variation in realism raised another possibility, that the images might not be convincing, not due to inaccuracy in space or ambiance representation, but simply because they weren’t realistic. By including realism as a separate metric, we can control for this factor and more accurately assess GenAI’s performance in conveying spaces and ambiances.
2.4.1 Realism
For each image, judges rated their perception of how realistic the image was (i.e., “How realistic is this image to you?”) using a 5-point scale (1 = not realistic, 3 = somewhat realistic, 5 = very realistic). Intraclass Correlation Coefficient (ICC) calculated to assess the interrater reliability of realism ratings revealed that the average ratings across all judges showed excellent consistency (ICC [1,k] among the judges was 0.98 for AI and 0.93 for GI).
2.4.2 Space accuracy
For each image, judges were presented with a list of the 18 spaces shown in Table 1 (i.e., Backyard, Dining Room, Entryway, Front Porch, Game Room, Garage, Guest Bathroom, Guest Bedroom, Kitchen, Living Room, Master Bathroom, Master Bedroom, Master Closet, Media Room, Pantry, Sitting Room, Study Room, Utility Room). For each image, judges were asked to guess which of the spaces the image was meant to depict (i.e., “Which of these spaces within the home environment does the image above best represent to you?”). Judges were given the opportunity to select a first choice and an optional second choice from the list. Space accuracy measured the degree to which the images collected (by GenAI and GI) depicted the specific spaces described in the prompts. Accuracy here is computed by comparing the number of times the intended space from the prompt matched the space identified by observers – accuracy is indicated when this value is above chance level.
2.4.3 Ambiance accuracy
For each image, judges were presented with a list of 29 ambiance descriptors derived from previous research on ambiances in the home (Graham et al., 2015: i.e., Abundance, Comfort, Community, Cozy, Creativity, Entertaining, Excitement, Family, Friendship, Fun, Inspirational, Inviting, Joyousness, Love, Organization, Privacy, Productivity, Quiet, Rejuvenation, Relaxation, Romance, Safety, Self-expression, Sophistication, Spirituality, Togetherness, Tranquility, Uniqueness, Wealth). Some of these ambiances were not used in the creation of any of the space-ambiance images because some of these ambiances (e.g., Self-expression) never appeared in the top-3 most desired ambiances for any of the spaces; therefore, the number of ambiances from which the judges were choosing (i.e., 29 ambiances) was larger than the actual number of ambiances depicted in the images (i.e., 18 ambiances). For each image, judges were asked to guess which of the ambiances the image was meant to depict (i.e., “Which of these emotions or perceptions does the image best convey to you?”). As in the case of space accuracy, judges were also given the opportunity to select a first choice and an optional second choice from the list. Ambiance accuracy assessed how effectively the AI-generated images and GI images conveyed the specific ambiances described in the prompts. Accuracy here is computed by comparing the intended ambiance described in the prompts with the ambiance identified by the observers – accuracy is indicated when this value is above chance level.
2.5 Procedure
Participants were told that they would be presented with a set of images of spaces from the home environment. They were told they would (a) report how realistic the images were, (b) indicate which spaces the images depicted, and (c) select from a list the emotions or perceptions that best describe the feeling evoked in the images. Table 2 provides the full list of ambiance descriptors and their definitions.
To provide participants with a sense of the images they would be judging, participants were first presented with randomly selected images derived from either Generative AI or GI (depending on which condition they were in). None of the images shown to each participant in this step would be in the set of images they later judged such that each participant encountered each image only once throughout the entire survey.
Participants were then directed to the image-judgment phase where they were exposed to 36 images. To reduce the impact of possible order effects, the 36 images were (quasi) randomly presented in sets of 12 images (Fig. 1A, C). Thus, each image was judged by about 11 (GenAI images) or 19 (GI) participants.
3 Results
As noted above, results based on the images sourced from GI served as the benchmark against which the results based on the images generated from DALL-E2 were evaluated.
3.1 Realism
Images generated from DALL-E2 (Fig. 2) received a mean realism of 2.92 (SD = 1.26), around the midpoint (“somewhat realistic”) of the scale. Images collected from GI (Fig. 3) yielded a mean realism of 3.75 (SD = 1.22). A t-test indicated that the GI were perceived as significantly higher in realism (t(262) = 5.3680, p < 0.0001) than were the AI-generated images.
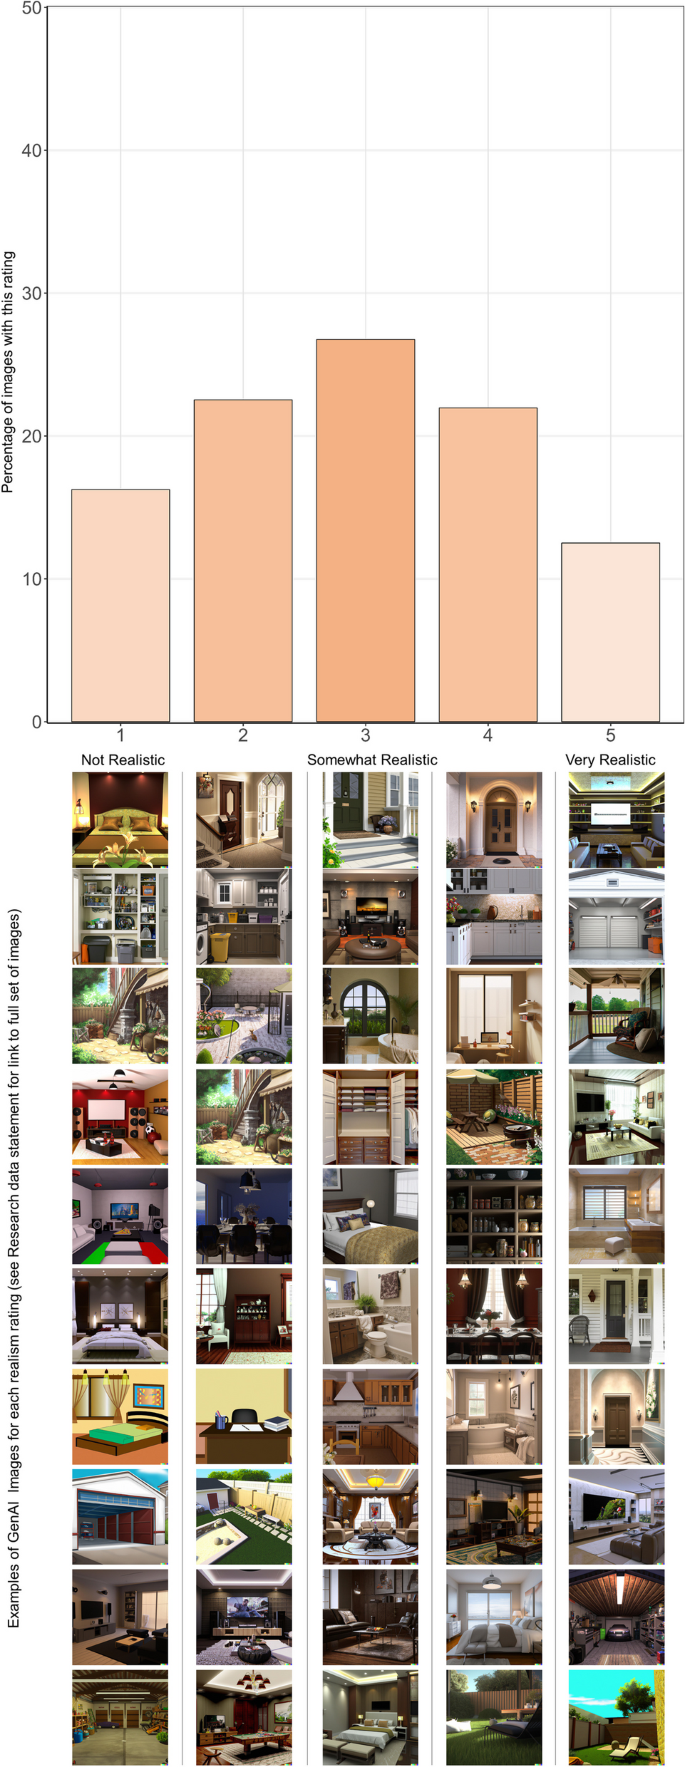
Judges’ Realism Ratings for Generative-AI Images. Note. GenAI = Generative Artificial Intelligence. GenAI images received a mean realism of 2.92 (SD = 1.26). Examples of images for each realism rating category are displayed beneath their corresponding bars. Links to the full set of images, along with their realism ratings can be found in the research data statement
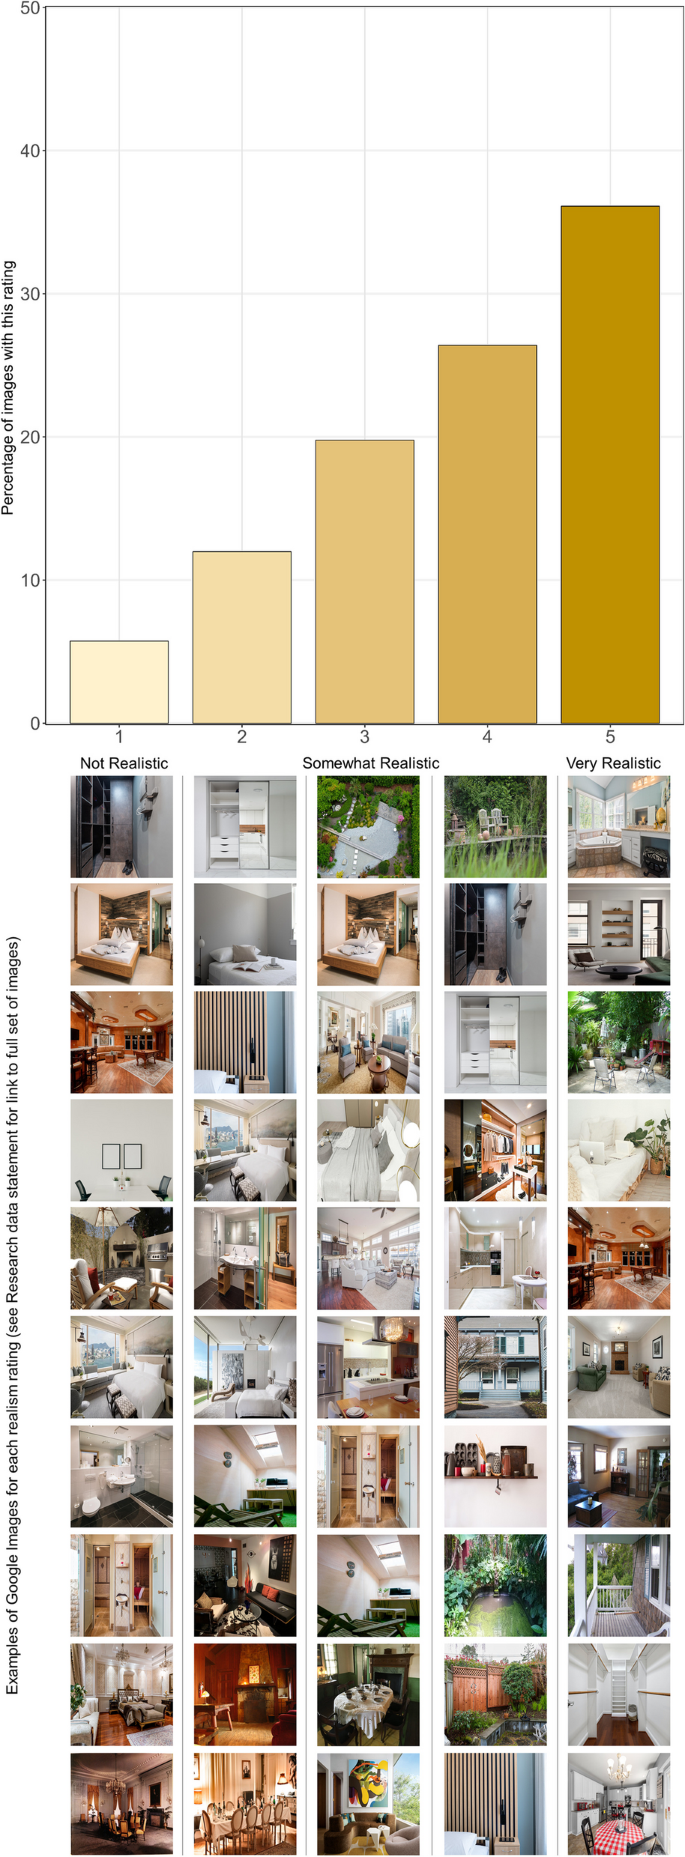
Judges’ Realism Ratings for Google Images. Note. GI = Google Images. Images collected from GI received a mean realism of 3.75 (SD = 1.22). Examples of images for each realism rating category are displayed beneath their corresponding bars. Links to the full set of images, along with their realism ratings can be found in the research data statement
3.2 Space accuracy
Images generated from DALL-E2 received a mean space accuracy of 76.01% (SD = 17.59). That means, when human judges were shown an AI-generated image depicting a space, there was a 76% chance that they would be able to pick the intended space in one of their two choices from a list of 18 spaces (where 11% is chance-level guessing). Images collected from Google Images had a significantly (t(198) = 4.0221, p < 0.0001) lower mean space accuracy of 65.85% (SD = 18.13) (Fig. 4).
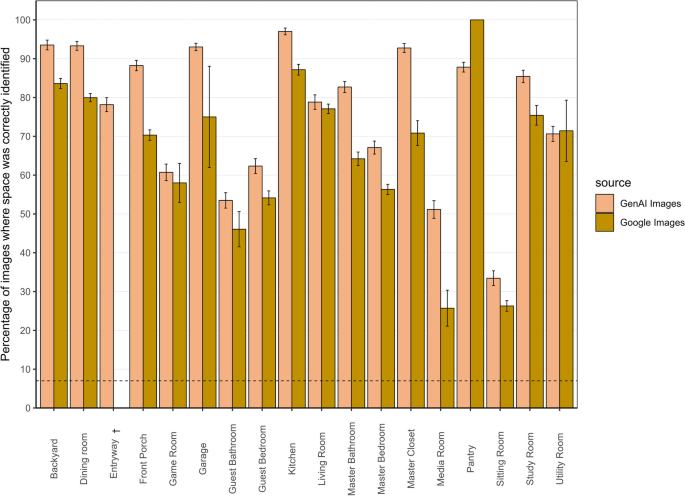
Space Accuracy for Generative-AI vs. Google Images. Note. Illustrates Space Accuracy, the percentage of images where spaces were correctly identified. Images generated from GenAI had a mean space accuracy of 76.01% (SD = 17.59); images from GI had a mean space accuracy of 65.85% (SD = 18.13). Error bars represent the standard error; the broken line indicates the chance level for guessing spaces correctly, at 11%. The error bar for the Pantry in GI is zero because only one image met the study’s criteria. Entryway (marked with †) shows no bars for GI because no images met the study criteria for the ambiance, reflecting limitations in the availability of suitable images from Google Images
Figures 5 and 6 provide a granular view of how each space was perceived. As shown in the figures, Kitchen and Dining Room were among the most accurately identified spaces across both AI-generated images and real (Google) images, suggesting that these spaces have distinct and well-understood physical features that are consistently identified by observers. Spaces like Sitting Room and Media Room were among the least accurately identified spaces across both GenAI images and GI. This low accuracy may be because of the similarity of these spaces to more commonly recognized spaces like Living Room (vs. Sitting Room) or Game Room (vs. Media Room). Less popular spaces like the Sitting Room and Media Room may be difficult to identify because judges may have less exposure to them than to more common spaces like Living Room or Kitchen (see Table 2).
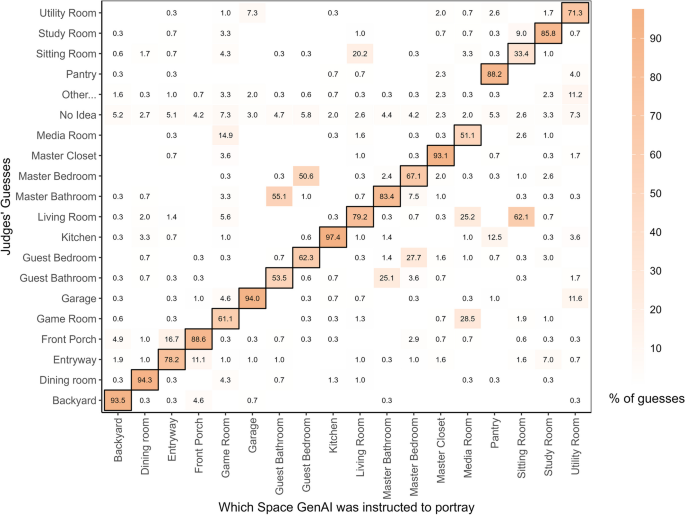
Space Accuracy Matrix for Generative-AI Images. Note. Illustrates the distribution of judges’ guesses about the spaces in the images (y-axis), categorized in terms of the spaces that the GenAI was instructed to convey (x-axis). The dark borders denote the cells where the judges’ guesses intersect with the space the GenAI was instructed to convey; therefore, these cells are where any evidence for Space Accuracy are to be found
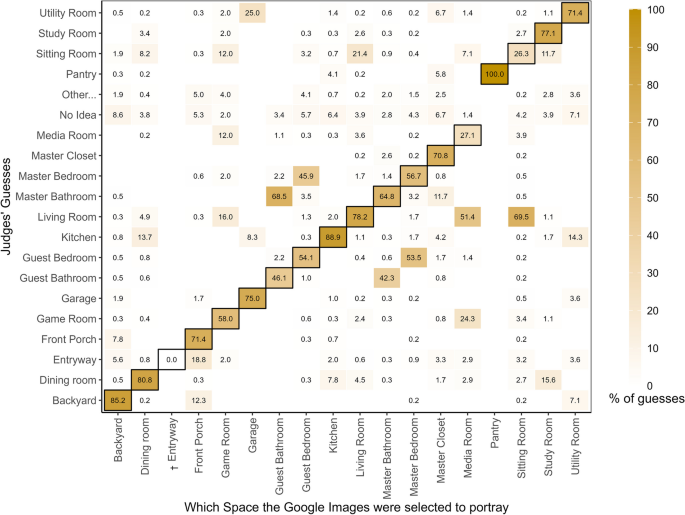
Space Accuracy Matrix for Google Images. Note. Illustrates the distribution of judges’ guesses about the spaces in the images (y-axis), categorized in terms of the spaces that the GI were selected to portray (x-axis). The dark borders denote the cells where the judges’ guesses intersect with the spaces the GI were selected to portray; therefore, these cells are where any evidence for Space Accuracy are to be found. Entryway (marked with †) shows a zero value because no images met the study criteria for the ambiance
3.3 Ambiance accuracy
Images generated from DALL-E2 received a mean ambiance accuracy of 25.44% (SD = 10.1) (Fig. 7). That means, when human judges were shown an AI-generated image of a space conveying a specific ambiance, there was a 25% chance that they would be able to pick the intended ambiance in one of their two choices from a list of 29 ambiances (where 7% is chance-level guessing). Images collected from Google Images had a statistically lower (t(198) = 6.0245, p < 0.0001) mean ambiance accuracy of 17.61% (SD = 8.18);
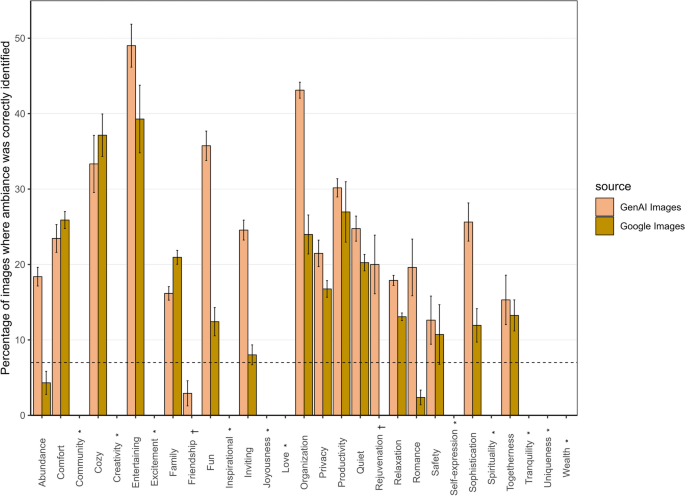
Ambiance Accuracy for Generative-AI vs. Google Images. Note. Illustrates Ambiance Accuracy, the percentage of images where ambiances were correctly identified. Images generated from GenAI had a mean ambiance accuracy of 25.44% (SD = 10.1); images from GI had a mean ambiance accuracy of 17.61% (SD = 8.18). Error bars represent the standard error; the broken line indicates the chance level for guessing ambiances correctly, at 7%. Some ambiances (marked with *) have no bars for both GI and GenAI because certain ambiances that judges could select were not included in the target images. Also, ambiances like “Rejuvenation” and “Friendship” (marked with †) show no bars for GI because no images met the study criteria for these ambiances, reflecting limitations in the availability of suitable images from Google Images
Figures 8 and 9 provide a granular representation of how each ambiance was perceived. Ambiances like Entertainment, Organization, and Cozy were identified with relatively higher levels of accuracy, compared to Abundance, Family, Rejuvenation, and Friendship, which all had considerably lower accuracy. This might have been because concepts like entertainment, organization, or coziness are associated with distinct and recognizable features (e.g., an ambiance conveying Entertainment might include cues like television, sound system, or games, which are typically associated with entertainment spaces; or Organization might be conveyed through the presence of neatly arranged furniture or bookshelves).
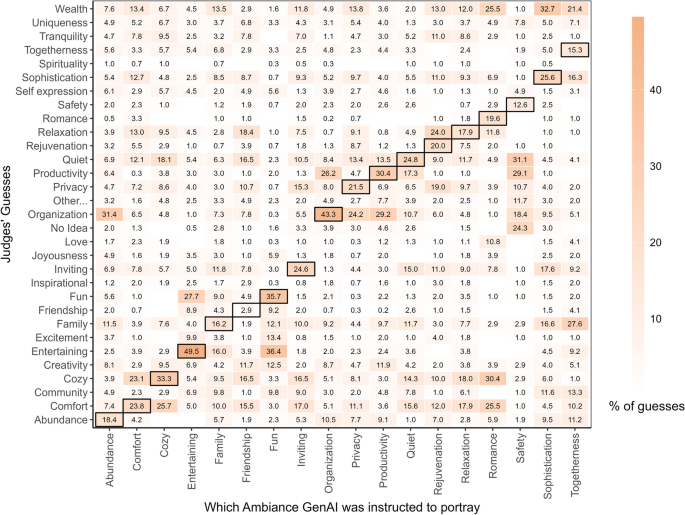
Ambiance Accuracy Matrix for Generative-AI Images. Note. Illustrates the distribution of judges’ guesses about the ambiances of the images (y-axis), categorized in terms of the ambiance that the GenAI was instructed to convey (x-axis). The dark borders denote the cells where the judges’ guesses intersect with the ambiance the GenAI was instructed to convey; therefore, these cells are where any evidence for Ambiance Accuracy are to be found
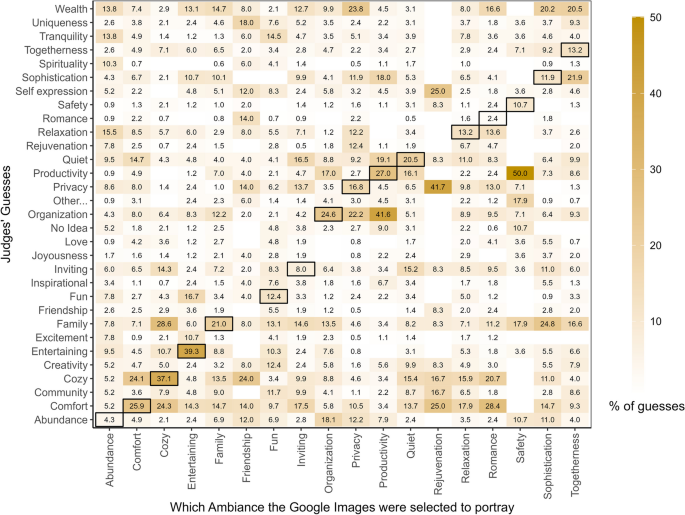
Ambiance Accuracy Matrix for Google Images. Note. Illustrates the distribution of judges’ guesses about the ambiances of the images (y-axis), categorized in terms of the ambiance that the GI were selected to portray (x-axis). The dark borders denote the cells where the judges’ guesses intersect with the ambiance the GI were selected to portray; therefore, these cells are where any evidence for Ambiance Accuracy are to be found
4 Discussion
Our investigation sought to explore the effectiveness of GenAI in accurately conveying spaces and ambiances. To provide a benchmark for our findings, we also collected data on images obtained from GI, using procedures that matched the ones used to collect the data on the GenAI images. The findings indicate that GenAI images were somewhat more successful at depicting the spaces (76% vs 66%) and ambiances (25% vs 18%) than were the GI—at levels substantially above chance (11% and 7% respectively). However, these average trends conceal great variation both across the spaces and ambiances and also in terms of the relative success of the GenAI and GI. We next discuss possible reasons for these differences.
4.1 Space accuracy
GenAI images were generally accurate but the accuracy varied across the types of spaces depicted. Common spaces like kitchens and dining rooms were consistently identified with high accuracy in both GenAI and GI (Fig. 4), perhaps because these spaces often contain elements such as sinks and dining tables that enhance their recognizability. This accuracy is reflected in the cells with dark borders in Figs. 5 and 7, which are shaded dark (reflecting high numbers), along with the light colors (reflecting low numbers) in the corresponding rows and columns.
However, spaces like media rooms and sitting rooms demonstrated lower space accuracy. This is potentially due to the presence of elements such as TVs and couches, which are to be found in multiple spaces, thereby making it more difficult to use such items to unambiguously differentiate the spaces. For example, master bedrooms and guest bedrooms, have a huge number of features in common, making them easy to confuse with each other. Indeed, the guest bedroom of one house could look highly similar to the master bedroom of another house. In reality, many houses may not have a clear distinction between different bedrooms in terms of their decor and contents, making it difficult to tell which one is the master bedroom and which one is the guest bedroom even if the images were placed next to one another. Such errors highlight the challenges in distinguishing spaces that share common features.
Similarly, living rooms were often correctly identified, yet they were frequently mistaken for sitting rooms, which were themselves recognized with lower accuracy (Figs. 5 and 7). The distinction between a sitting room and a living room is further complicated by regional or personal preferences in terminology, especially in contemporary settings. For example, sitting and living rooms are usually two different spaces in West African and European contexts, but might not be distinguishable in many US contexts. These confusions are reflected in the presence of some relatively high numbers in the cells without dark borders in Figs. 5 and 7.
The accuracy of judgments of such spaces increases considerably if we count any judgment of bedroom (master or guest bedroom) as correct if the target image is any type of bedroom (master bedroom or guest bedroom) and if we count any judgment of living room or sitting room as correct if the target image is either a living room or a sitting room. Specifically, in the context of GenAI images, the space accuracy scores jump from 56.7% for master bedroom and 54.1% for guest bedroom to 90.7% for the broader category of any bedroom. Similarly, the space accuracy scores jump from 78.2% for living room and 26.3% for sitting room to 91.6% for the broader category of living room or sitting room.
4.2 Ambiance accuracy
Ambiance accuracy presented a more complex picture. The analyses revealed low overall accuracy for both GenAI and GI, with GenAI showing slightly better performance, suggesting that AI has an edge in capturing and projecting ambiance (an edge that is likely to rapidly increase with improvements of GenAI). Regardless, the variations across ambiances stood out. Ambiances like quiet, cozy, and entertaining were consistently identified with slightly higher accuracy across both GenAI and GI (Fig. 6). This could be analogous to the case of space accuracy discussed above, where some ambiances often contain unique elements; for example, an entertaining space within a home could typically have electronics (other than the ubiquitous TV), or games, while a cozy space could have a plush lounge or bed.
Other ambiances (Fun, Family, Abundance, Inviting, Privacy, Productivity, Relaxation, Romance, Safety, Sophistication, and Togetherness) were often misidentified in GenAI and GI, as reflected in the high numbers in cells without dark borders in Figs. 8 and 9. For instance, togetherness was often incorrectly identified as wealth, family, and sophistication. It is possible that some of these ambiances, like spaces, when depicted within home spaces, often contain common elements that increase ambiguity and make it more difficult to differentiate among the ambiances. For example, a dining room with several chairs and a long table could signify togetherness but also have the characteristic of a group or family, which might be associated with wealth or sophistication. Also, some of the ambiances are likely to be related, such that an image that faithfully depicts one ambiance (e.g., togetherness) may also tend to convey certain other ambiances (e.g., family, wealth). This is an important way in which space and ambiances differ – spaces are more often mutually exclusive (a space that is a kitchen tends not to also be a bedroom) than are ambiances (a space can easily be both cozy and inviting). Past research has identified broader factors of ambiances, consisting of groups of ambiances that tend to co-occur (Graham et al., 2015). Figures 8 and 9, with their numerous substantial correlations in cells without dark borders point to the existence of such higher-order ambiance factors. The identification of such factors is a topic that deserves greater research attention.
It is possible that the variation we see in ambiance accuracy also stemmed from the limited representation of ambiances presented to the human judges. Although the study offered judges a choice of 29 possible ambiances, only 18 of those ambiances were depicted in the images. Specifically, there were no images to represent 11 of the ambiances (e.g., love, joyousness, wealth). Consequently, any time a judge selected one of those ambiances, it was necessarily scored as being incorrect (see Fig. 7). We retained the full list of 29 ambiances to ensure we represented the full range of potential ambiances, as originally identified in the Inventory of Desired Ambiances in the Ideal Home. Had we not done so, the judges may have been frustrated by the absence of ambiances they wanted to choose. Retaining the full range of ambiances also enabled us to capture any subtle distinctions in ambiance-judgment distributions that might arise.
Another factor contributing to the high variability in ambiance accuracy was the fact that for some ambiances, GI failed to provide a full set of images that met our predetermined (Phase I) criteria. Consequently, there were some ambiances (e.g., friendship, rejuvenation, inviting, abundance) for which there were only a few or even zero usable images meeting the study’s criteria (See Supplementary Information-2 for a full list of criteria). This scarcity of images affected the ambiance accuracy assessment (Fig. 7) because it led to higher variability in the measured accuracy for those ambiances, as indicated by the large standard error values. For example, in the cases of spaces like Pantry, the study’s reliance on judgments of only a single image resulted in accuracy estimates with large standard errors, indicating high uncertainty in these estimates (Fig. 4). Future research would benefit from image sources that are not restricted by the limited availability of certain space-ambiance combinations. It is of course possible that no such image sources exist outside of GenAI.
4.3 Realism
The GenAI images were judged to be just below the midpoint (“somewhat realistic”) on a 5-point scale. Unsurprisingly, given that the GI consisted of photos of real spaces, the realism ratings of the GI were rated as significantly more realistic than the GenAI images. However, even these real photos of real spaces were given an average realism rating of only 3.75, substantially below the maximum of 5. One possible explanation for these lower-than-expected realism ratings for the Google Images could be that the images were so obviously real photographs of real places that the judges might have thought that the realism ratings were meant to capture some other interpretation of “realistic”, such as the degree to which the photos appeared contrived. Future research will be needed to understand why real photos of real places elicited such low realism ratings. For example, one possible experimental design would be to include both AI-generated and Google-image images in the same set of ratings to ensure that both sets of images were being judged using the same definition of “realistic.” Another useful step, which with hindsight we now wish we had taken, would be to debrief the judges to ask them how they were interpreting the instructions.
As shown in Figs. 2 and 3, the realism ratings covered the full range of possibilities, raising the question of whether the realism of the images is related to the degree to which they convincingly depict the intended spacesand ambiances. Theoretically, at least, an unrealistic image could still clearly depict an organized kitchen. Our analysis did not find a strong correlation between the realism of an image and its ability to accurately convey space or ambiance, particularly for GenAI images; specifically, for the GenAI images, a Point-biserial correlation between Realism and Space Accuracy was -0.014 (p = 0.286), and between Realism and Ambiance Accuracy, 0.02 (p = 0.138), suggesting that factors beyond mere realism influence how observers perceive and interpret images. Additionally, we found no significant correlation between space accuracy and ambiance accuracy, indicating that recognizing a space does not necessarily mean the associated ambiance will also be correctly identified. These findings indicate that additional factors might play a role in how images are interpreted. Such factors could include how perceivers rely on contextual or cultural cues that are not captured by mere realism. For example, cozy could be associated with warm elements like a fireplace, or thick blankets, which are not strictly tied to the realism of the image, but more to the context these elements suggest.
Ambiance perception can be highly subjective, depending on individual experiences or expectations. For example, when viewing a family space, an observer’s personal background, like growing up in a large family that gathered in the kitchen, might lead them to identify a large kitchen as a family space, even if the image is not realistic. Such factors may help explain why realism does not play a major role in portraying space or ambiance.
5 Limitations and future directions
The present study was subject to several limitations that should be noted. The most obvious of which is the rapid pace of AI development. New versions of AI models typically come out faster than a typical research cycle (from conception to publication), making it virtually impossible for careful empirical studies, such as the present one, to stay up-to-date with the latest technology. In the present case, when the present research commenced DALL-E2 was the latest version of the software but by the time of submission, this model had already been superseded by DALL-E3. It is hoped that by developing research infrastructure and establishing research paradigms such as those presented here, it will be possible for researchers to shorten the time taken to evaluate new technologies so that findings can be published before they are obsolete. To that end, we have made our materials and code available to the research community and we hope the present results can provide an initial benchmark against which future research can be compared to gauge any improvements in realism and accuracy.
The use of GI presented difficulties in finding suitable images, which relied heavily on accurate tagging and Search Engine Optimization (SEO). It was challenging to locate images that matched the required ambiance criteria, especially when compared to the flexibility of GenAI. Moreover, it is possible that the unanticipated disparity between the number of GenAI images (540) and GI (242) might result in the GI estimates being less robust than the estimates based on the GenAI images. As a preliminary test of whether the differences in the sizes of the image sets could be driving the accuracy findings, we undertook a post-hoc analysis of just those space-ambiance combinations with equal numbers of images for both GenAI and GI. Results in this limited set of space-ambiance combinations (Ambiance Accuracy [GenAI = 22%; GI = 16%]; Space Accuracy [GenAI = 74%; GI = 67%]) were highly similar to the overall findings both in terms of magnitude and overall patterns (Ambiance Accuracy [GenAI = 25%; GI = 18%]; Space Accuracy [GenAI = 76%; GI = 66%]). Although far from conclusive, the results of this follow-up analysis are inconsistent with the idea that the observed accuracy differences between the GenAI and GI images are an artifact of the different numbers of images in the GenAI and GI image sets. Nonetheless, future studies in this domain should find ways to reduce such potential discrepancies in the representativeness of the image sources. This could involve developing more advanced image retrieval techniques, creating dedicated image databases, or using machine learning tools to better classify and retrieve relevant images. At the same time, the fact that GenAI could easily yield enough images of any space-ambiance combination and GI could not, reveals a major practical advantage of GenAI over conventional methods of acquiring images.
Effective prompt engineering is critical when working with GenAI. Consistent with recommended procedures, our GenAI prompt was shaped iteratively via trial-and-error, with the goal of generating the kinds of images that might realistically be used by architects and designers seeking to convey what various spaces with various ambiances might look like (e.g., a relaxing living room). Such procedures inevitably involve a degree of judgment regarding what is wrong with images produced by the prompts and what instructions can be used to improve them, thereby raising concerns about the standardization and replicability of the process. To address these issues, we make two recommendations. First, future research will need to focus on adopting and developing a comprehensive database of prompt structures that have been effective in generating accurate images categorized by specific and relevant keywords and phrases. At the same time, new technologies are emerging that are designed to assist with prompt engineering, which will improve standardization (Wang et al., 2024). Second, researchers should report their own prompt engineering procedures in great detail so that readers can evaluate findings in light of these steps. To that end, we report our own prompt engineering process in detail, along with example images (Supplementary Information-2).
Another limitation is the lack of exact equivalence between the procedures used and the images produced across the two methods of image generation (GenAI and GI). In practice, there is a tension between optimizing the equivalence of the procedures and optimizing the equivalence of image sets. For example, when using the prompts that are designed to be as equivalent as possible across GenAI and GI, the resulting images differed in significant ways across the two methods; for example, humans and animals were present in many of the images from GI, the images also ranged from pixelated low-quality images to images that were too large to use, and some images had visible text added in them. Recall that our goal was to simulate the kinds of images an architect or designer might seek; we reasoned that they would probably focus on the image itself (rather than the process used to generate the image), so we sought to increase equivalence between image sets rather than between the image-generation procedures. Therefore, to address this lack of equivalency between the two image sets, we implemented several selection criteria (e.g., removing images including humans or animals, removing images with low resolutions). The introduction of criteria to increase equivalence in image sets inevitably decreased equivalence in image-selection procedures, including the introduction of some elements that involved human judgment (e.g., “is there a person or animal in the image?”). In cases where human judgments were needed, we sought to reduce the effects of judge biases and other idiosyncrasies by combining the judgments of two independent judges, who showed strong interjudge agreement (Cohen’s Kappa = 0.88). Future research will need to find ways to balance such concerns but we are optimistic that rapid advancements in image generation and image recognition technologies will facilitate greater automation and less reliance on human judgment.
Another potential limitation of this study is the design in which the judges rating the images were grouped without overlap; the limitation arises because such a design does not provide means for a direct statistical control for individual differences across the judges. Our design sought to account for such potential differences by drawing all judges from the same population, assigning judges randomly to image sets, and using a relatively large set of judges (at least 10) per image. It can be assumed that under such conditions that most individual differences in judgments will be absorbed in the aggregation process (Block, 1961), an assumption empirically supported by the high levels of interjudge agreement reported here. Nonetheless, future studies might benefit from exploring alternative designs, such as using within-subject designs, where different sets of judges overlap in the images they rate, thereby providing more direct control over potential individual differences among the judges.
The present work was very much rooted in the context of US-centric spaces. The images generated by DALL-E2 predominantly depicted spaces influenced by Western (especially US) architecture, which features elements like the prominent use of wood in interior spaces, while excluding features like brick walls (as used in West African architecture). Such cultural nuances can significantly impact how architectural elements are interpreted and experienced. Consequently, a particular design feature may evoke different emotions or ambiances across diverse cultures. For example, wooden flooring could signify sophistication for someone from West Africa but could mean something else for someone from the US. Recognizing and capturing these variations is challenging but important. Therefore, future studies should also consider the cultural contexts that influence the perception of spaces and ambiance by studying a wider variety of contexts. Fortunately, OpenAI’s continuous work to improve DALL-E aims to reduce biases and enhance the model’s overall complexity, and its real-world usability. In the meantime, it will be important for researchers to carefully specify the populations and cultural contexts in which the research is undertaken so that readers can interpret the findings accordingly.
6 Conclusion
In this article, we examined the capabilities of GenAI in architectural design, with a particular focus on their ability to convey the spaces and ambiances intended by the user. DALL-E2 demonstrated an impressive ability to depict spaces with a degree of accuracy that often surpassed traditional methods, although conveying ambiances remained a greater challenge. One surprising finding to emerge from our ad hoc analyses revealed that the ability of an image to convey a specific space or ambiance was largely unrelated to the realism of the image. These findings offer an essential framework for understanding AI’s role in architectural research and design, emphasizing its existing strengths and highlighting areas that need further development.
This study contributes to the growing body of knowledge in the intersection of AI and architecture and also paves the way for future explorations aimed at harnessing the potential of AI for creating spaces that resonate with human experiences. The ongoing dialogue between technological potential and human-centric design is expected to shape the future of architectural visualization and creativity. More importantly, these insights underline the critical importance of meticulously evaluating such tools to ensure they meet the diverse demands of architectural practice. Such rigorous assessments are crucial not only for validating the effectiveness of GenAI models but also for advancing their integration into creative processes that emphasize both practicality and emotional depth.