Article Content
1 Introduction
Because of increasing semiconductor production, the demand for high-precision photo-lithography has never been higher. In lithography, accurate optical positioning is crucial for manufacturing nanometer-scale semiconductor features; this requires high-performance optical glass lenses with excellent optical quality. A lens’s performance is determined by numerous factors, including aberrations, scattering, and distortion. During lens manufacturing, after the initial surface grinding, the optical axis and geometrical center axis of glass lenses are often misaligned, potentially resulting in coma and tilt aberrations, which have the greatest effect on photo-lithography performance. To minimize these errors, lenses typically undergo a key manufacturing process known as centering. In centering, the lens’s optical axis is aligned with the workpiece axis of the centering machine, and excess lens edge is ground away. This process minimizes the deviation of the lens’s optical axis from its geometrical center axis, aligning them to reduce the aforementioned optical artifacts.
However, batch centering is difficult to achieve; operators manually fix lenses, and the original lens dimensions may have substantial variability. Moreover, since centering process is a kind of cylindrical grinding, the grinding depth cannot be too high, thus lowering productivity [1]. These uncertainties result in unexpected defects, such as edge cracks, which occur suddenly during centering process and further negatively affect lens appearance and optical performance, and circularity errors, which get worse by the uneven removal due to decentered lens geometry [2]. Furthermore, in glass lens centering, a single-layer electroplated diamond grinding wheel is used to maximize the finish quality of edges, especially for high-value lenses [3, 4]. However, these grinding wheels eventually wear out, causing the edge of the glass lens to crack and producing an even greater circularity error [5, 6]. Such a lens is out of specification and must be scrapped, resulting in efficiency and product losses. Combining all complexity above leads to few monitoring methods for the centering process being developed. Manufacturers instead rely on experience to determine the problems in a process and adjust parameters accordingly. While adjusting parameters can alleviate some errors, it can only partially solve the problem, limiting the effect of parameter adjusting to improve yield rate. Moreover, centering lens defect happens instantaneously, hence it is impossible to predict or intervene during processing without real-time monitoring [7]. Most defects are only discovered after processing is completed, resulting in significant inefficiency and quality variability. Therefore, developing a real-time monitoring and predictive system for the optical lens-centering process is essential to promptly detect anomalies, minimize losses, improve process control, and enhance yield and product quality.
Acoustic emission (AE) sensors, which can record inaudible high-frequency sounds created during structural changes, have been demonstrated to be effective for monitoring the status of structures [8, 9] and manufacturing processes [10, 11]. These structural changes normally correspond to certain status responses of the monitored element. Choi et al. developed a real-time monitoring system that employed AE signals during cutting to identify tool breakages [12]. They found that a reduction in intensity of the AE signal was correlated with tool breakage, which enabled the trigger of an alarm to prevent further damage to the workpiece. Wu et al. experimented with multi-sensor signals, including AE signals, to identify features related to tool wear [13]. Their experiments revealed that AE sensor signals combined with accelerometer measurements had the highest accuracy for tool wear prediction. Lopes proposed a method of monitoring the dressing of an aluminum oxide grinding wheel [14]. Segreto et al. proposed a method of using AE and other sensors to monitor a robot-assisted polishing process for online assessment of a workpiece’s surface roughness [15]. Behnia et al. developed a robust method to introduce a damage-sensitive feature from AE response in time domain data [16]. An autoregressive model was integrated with exponentially weighted moving average (EWMA) to present a damage detection scheme for multilayer cementitious composite slabs.
Process prediction researchers select models appropriate for the desired task [17, 18]. Ding et al. experimentally compared time-series prediction models based on wavelet process neural networks [19]. Cortez et al. reported that long short-term memory (LSTM) had higher accuracy than other machine-learning models for predicting time-series emergency events [20]. By establishing a nonlinear relationship between past and future short-term periods, the predictive output can reflect the short-term signal trends [21]. This method is widely applied in machine health monitoring and prediction [22, 23]. However, normal regression models including LSTM only predict signals according to the forward direction of the input data, but ignore the future timeline of the input. The regression model based on bidirectional method can learn the past and future data in both forward and backward directions, and analyze the data more comprehensively [24, 25]. In order to predict the AE signal in real time, the prediction model should output the result as soon as possible, especially in the condition that the model repeats computing as centering is still processing. The compute unified device architecture-based (CUDA) processing system is executed on a GPU to speed up a complicated and time-limited calculation. The integration of CUDA can implement hybrid computing to enhance real-time monitoring and processing diagnosis [26,27,28]. Existing studies lack real-time AE signal prediction solutions for continuous centering. This study develops a CUDA-accelerated LSTM model to achieve high-frequency forecasting with low latency for enhanced real-time decision-making.
In this study, a monitoring system is proposed to forecast the abnormal conditions during centering process using AE signal prediction models. By predicting upcoming AE signal trends during centering, the goal is to alarm any abnormalities prior to it happening and preventing damage to the lens. Down-sampling, time-series decomposition, and exponential weighted moving average (EWMA) were applied to preprocess and analyze the AE signal. LSTM-based prediction models were trained, verified, and compared to determine the most suitable model for AE signal prediction in centering process. By predicting abnormal AE signals, centering process problems can be forecasted and prevented. The production yield rate and efficiency can be highly enhanced.
2 Centering process
Centering is begun by fixing a glass lens between two bell-shaped clamps mounted on a rotary axis. If the clamping forces are balanced, the optical axis is centered on the rotary axis. The edge of the lens is ground using a grinding wheel to align the geometrical and optical axes, as shown in Fig. 1. However, grinding the edge of a glass lens can easily cause edge cracks. Moreover, the severity of an optical axis error is related to the degree of error between the geometrical and optical axes. A circularity error after grinding in the lens can result in a large optical axis error even if the optical axis is perfectly aligned with the rotary axis. Edge cracks occur due to an instantaneous concentration of stress while the lens edge is being ground. These cracks can cause light diffraction on the edge of the optical system, generating a light spot and degrading image quality, as shown in Fig. 2.
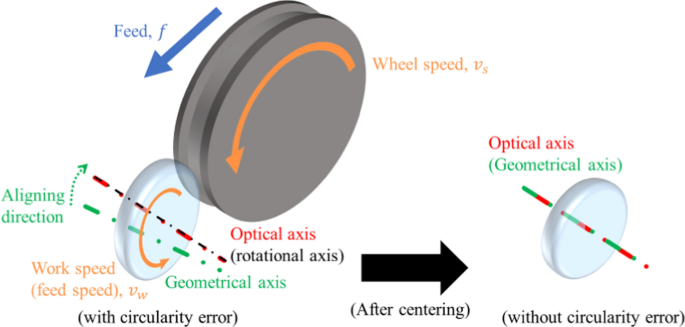
Centering process
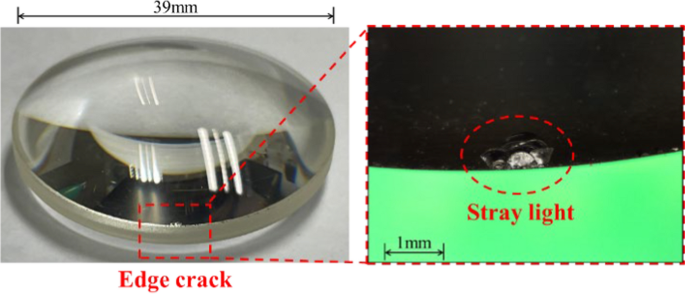
Edge crack on a glass lens and the resultant stray light
Centering is cylindrical grinding process of hard-and-brittle material. The material removal rate (MRR) is derived by the following equation:
where is the depth of cut that changes over time due to feed rate , is the width of cut, is the speed of grinding point on the lens, is the rotation speed of the lens, and is the lens radius.
During centering process, the grinding energy u is a key factor affecting the quality of a glass lens’s edge. The specific energy is related to the grinding power and MRR. It can be calculated using the following equation [29]:
where is the grinding speed, is the depth of cut, and is the feed rate.
The grinding power is related to the tangential grinding force and can be calculated with force and grinding speed :
Therefore, based on Eqs. (2) and (3), the specific energy is derived as the following equation:
Centering is a cylindrical grinding process. Due to the hard-and-brittle nature of glass, the rotational speed of the lens is typically maintained at a modest speed of < 5 rpm to minimize edge cracking. The grinding wheel is fed toward the lens while the lens is rotated, increasing the depth of cut d over time t, as expressed in Eq. (5) and shown in Fig. 3.
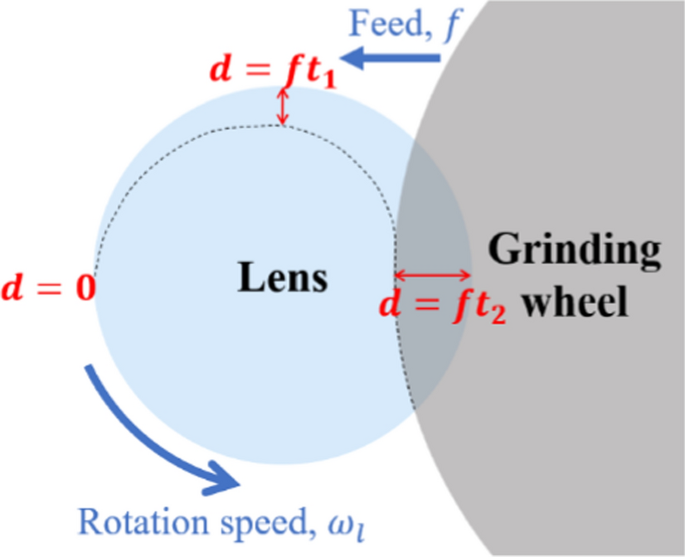
Increasing depth of cut d during centering
Therefore, the grinding energy u in the centering process is:
The grinding energy is transmitted from the grinding wheel through grinding force to the lens edge, resulting in material removal. Furthermore, while the microstructure of material is broken, the grinding energy dissipates into the environments as heat and wave. AE signal is the stress wave that mainly transferred from the grinding energy. It is assumed to be related to the amount of grinding energy.
Machining parameters are critical effects on process condition [30]. The grinding energy and grinding force in centering are intrinsically affected by various centering parameters, such as the grinding wheel speed, lens rotational speed, and depth of cut [31]. Figure 4 presents grinding wheel surfaces with various levels of wear. For a given grinding wheel granularity and lens material, when the normal grinding force Fn increases, the tangential grinding force increases, thus increasing the material removal rate, diamond granule wear, and grinding temperature [32], as shown in Fig. 4b. An increase in the normal grinding force increases the radial stress on the lens edge, resulting in an increase in crack depth. Elevated grinding temperature can also result in the glass of the lens’s edge being softened and deformed, increasing the circularity error. Furthermore, this heated glass may melt and stick to the grinding wheel’s surface, forming a layer of glass and covering the diamond granules, thus decreasing the grinding efficiency, as shown in Fig. 4c.
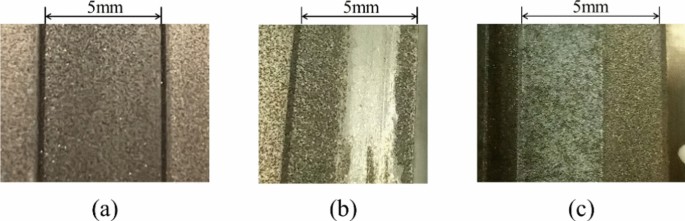
Grinding wheel surfaces. a Normal, b worn, and c covered with a melted glass layer
The grinding wheel’s surface, composed of diamond grains, plays a key role in material removal during grinding [33]. Along with centering parameters, the grinding wheel’s surface quality significantly impacts lens quality [34, 35]. Material removal involves cutting, plowing, and rubbing, with cutting requiring the least grinding force, followed by plowing and rubbing [36]. Figure 5 illustrates material removal through cutting and rubbing. Cutting removes material as shavings, while rubbing increases lens temperature, causing glass melting and removal.
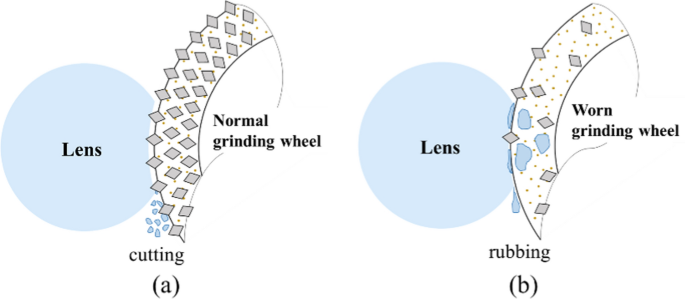
Material removal mechanisms for glass lenses. a Cutting with a normal grinding wheel. b Rubbing with a worn grinding wheel
Grinding with a worn diamond wheel increases normal and tangential forces, shifting material removal from cutting to rubbing. The raises grinding temperatures, leading to circularity errors, edge cracks, and production losses [37]. Generally, centering conditions vary with grinding wheel wear, original lens diameter, circularity, size error, and even machine state. These undetectable factors limit the yield rate and production efficiency [38].
Studies have used support vector machine (SVM) in conjunction with wavelet analysis to analyze the wear of grinding wheel. However, data can only be collected after a lens has been ground. Hence, real-time monitoring is difficult, and a grinding wheel cannot be identified as worn without it damaging a lens. Researchers have shown that vibrations during machine warm-up are correlated with the root mean square (RMS) of AE signals during processing. This study collected the third detailed layer (D3) of high-frequency signals from lens grinding for wavelet analysis. These two signal features, RMS and D3, were employed to analyze grinding wheel wear. For large batches of lenses that are processed 24 h per day by warmed-up machines, the RMS of AE signals is a valid parameter for predicting grinding wheel health.
In this study, the RMS of short AE signals was calculated as a characteristic time-series signal and then used to train models for predicting real-time centering conditions. A flowchart of the monitoring system is presented in Fig. 6.
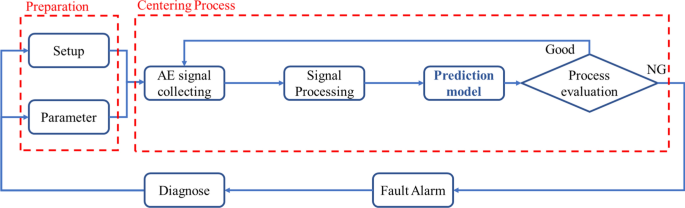
Flowchart of monitoring system
3 Acoustic emission in centering process
AEs are elastic stress waves and are generated when a solid undergoes irreversible structural changes [39]. AE sensors can detect acoustic signals with frequencies of 0.01–1000 kHz. They are sensitive to and can collect high-frequency signals. In grinding, AE signals are commonly utilized to monitor grinding conditions. The frequency range of AEs is much higher than that of surrounding environmental frequencies. Hence, AE signals are immune to interference and suitable for in-process monitoring [40].
Figure 7a presents AE signal data collected from the centering of a batch of lenses. The RMS value was calculated with the AE signal of a complete centering processing. Given the same specifications, the degree of wear on the grinding wheel increased as the process order increased. The figure suggests that the RMS AE also increased. A previous study reported that, given the same processing conditions and if the machine has been warmed up, the AE RMS is directly correlated with the wear of the grinding wheel. A comparison of RMS centering AE signals for normal and worn grinding wheels is presented in Fig. 7b [41]. After the processing of numerous lenses, the AE signal is clearly higher, indicating greater wear on the grinding wheel.
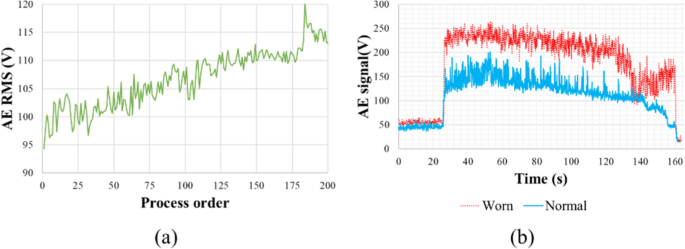
Centering AE signals. a RMS for batch production. b Signals for normal and worn grinding wheels
4 Experiment of mass production
In this study, a Shonan 502N horizontal centering machine was used for lens-grinding experiments. The machine was equipped with a single-layer electroplated diamond grinding wheel, featuring a granularity of #230. This specific grinding wheel type was chosen due to its effectiveness in achieving the desired grinding precision and surface quality. Figure 8 shows the experimental setup, a hydrophone AE sensor was strategically positioned at the cutting fluid outlet. This positioning allowed the cutting fluid to flow by the AE sensor toward the grinding point. The AE signal generated by wheel grinding was thus transferred from the grinding point to the AE sensor through the cutting fluid.
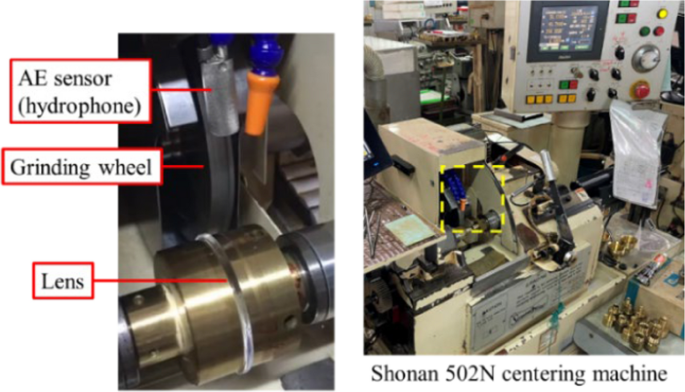
Experimental centering setup with an AE sensor
In the experiment, the centering of quartz lenses with diameters of 39 mm was monitored. These lenses were randomly chosen from the lenses that would be processed in batches of 300 lenses on a production line. The lens was ground from the diameter of 39 mm to 38.3 mm, which was 0.35 mm total feed. The grinding wheel moved to the start position for 5 s, and started feeding from the distance 0.05 mm between the wheel’s and lens’ edge. The feed rate was 0.01 mm/s. After feeding for 45 s, 30 s spark out, in which the grinding wheel stopped feeding and dressed the lens edge for 1 revolution of the lens, was performed. The processing time for a lens centering was totally 75 s. During the centering process, the grinding wheel speed was 3000 rpm, and the lens speed was 2 rpm.
By selecting lenses with similar specifications to those used in real-world manufacturing, the experiment aimed to provide relevant and practical insights into the lens-grinding process. During the monitoring process, the AE signals were collected only during the centering processes except for standby periods. Therefore, the data can be effectively analyzed without the effect of standby time. Finally, approximately 2250 s of AE signals were collected, as shown in Fig. 9. The collected AE signals were subjected to thorough processing, including normalization and segmentation, to prepare them for the subsequent training and evaluation of prediction algorithms.
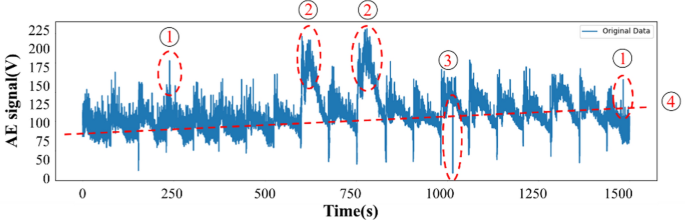
The processed AE signals from the centering process of 20 quartz lenses
After processing AE signals, the abnormal features were identified, as shown in Fig. 9, all corresponding to defective lenses upon inspection. Signal feature 1 showed momentary spikes, linked to edge cracks. Feature 2 exhibited higher amplitudes with a reduced gradient, associated with poor circularity due to large blank sizes. Feature 3 showed momentary amplitude decreases, linked to existing edge cracks. Unlike feature 1, feature 3 was found to appear when the grinding wheel reached an existing crack instead of when it generated a new crack. Signal feature 4 was an increase in amplitude during the batch production of centering process. As grinding wheel wear or machine abnormalities developed, the amplitude of AE signal increased. Correspondingly, the lens had poorer circularity and more edge cracks.
These insights enhance real-time lens-centering monitoring, enabling operators to detect and address defects promptly, reducing losses and improving product quality.
5 Data process of AE signals
5.1 Down-sampling
In this study, AE signals over time were analyzed, and trends in these signals were predicted. The AE sensor had a data collection frequency of 50 kHz. Its signals were processed in real time. The raw signal data oscillates around 0. To avoid the algorithm being overwhelmed with an excessive amount of data, the frequency of the collected time-series signals was first down-sampled to 20 Hz by emphasizing the signals’ amplitude. That is, each data point was the RMS value of 2500 data points from the original signal, as shown in Fig. 10. This down-sampling process reduced the amount of data input to the algorithm, enabling real-time processing of the grinding signals, and still retained enough information corresponding to the condition of the centering process.
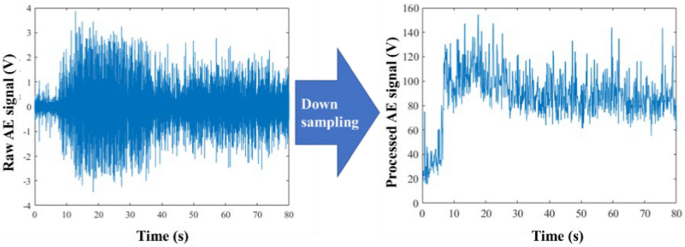
Transformation from the raw signal (left) to processed signal (right)
5.2 Exponential weighted moving average, EWMA
To further enhance the predictive performance of the model, the exponential weighted moving average (EWMA) technique was employed for signal smoothing. Unlike a simple moving average, EWMA incorporates observations from different time points, assigning varying weights to these observations to more flexibly reflect the changing trends of recent observations. Its computation is defined by Eq. (7):
where is the exponential weight moving average at time t, is the observed value at time t, α is the smoothing parameter, controlling the weight of observation, ranging from 0 < α < 1.
Mathematically, EWMA acts as a first-order low-pass filter in the frequency domain. Its transfer function H(z) in the z-domain is given by Eq. (8):
This transfer function indicates that EWMA suppresses high-frequency noise while preserving low- and mid-frequency components where essential process features typically reside. Therefore, although EWMA reduces the prominence of sudden spikes, the fundamental signal characteristics necessary for abnormality detection remain intact.
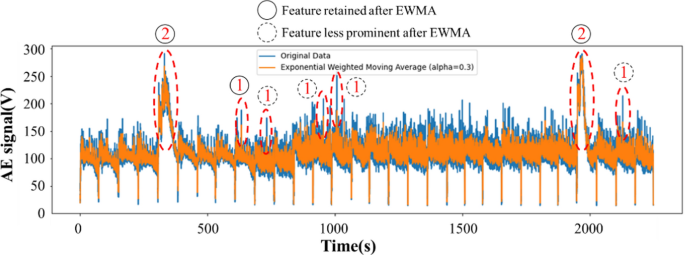
The EWMA of the processed AE signals is shown in Fig. 11. The fluctuation in AE signal was significantly reduced by EWMA. The signal amplitudes and trends became more obvious since less fluctuation interfered the signal analysis. The signal features 2 and 4 can be easily identified. However, the smoothing process filtered out the momentary spikes in the signal, which represented edge cracks on the lens in centering process. The signal features 1 and 3 were removed. Therefore, EWMA effectively clarifies the signal trends, but ignores the momentary spikes of AE signals. The grinding wheel wear and circularity errors can be observed, but the edge cracks during centering process are hidden in the processed AE signals. This series of methodologies enables a better grasp of signal characteristics, laying a robust foundation for constructing predictive models.
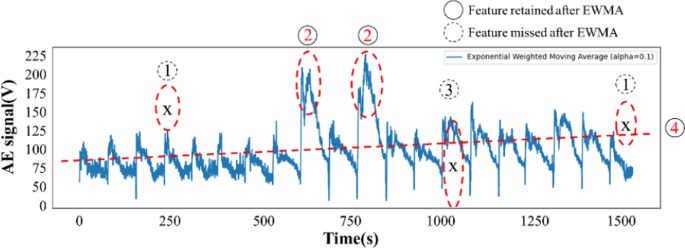
The EWMA of processed AE signals from the centering process of 20 quartz lenses
6 Prediction models
In this study, we developed deep learning neural network prediction models based on long short-term memory (LSTM) architecture, including LSTM, Bi-LSTM, CuDNNLSTM, and Bi-CuDNNLSTM, for forecast in the centering process. After analyzing preprocessed AE signals, they were segregated into training and testing sets, subsequently evaluated and compared across the four distinct prediction models. The workflow is depicted in Fig. 12. Considering the intended real-time application of these models within practical manufacturing environments, this study employed CUDA deep neural network (CuDNN) to expedite the computation process.
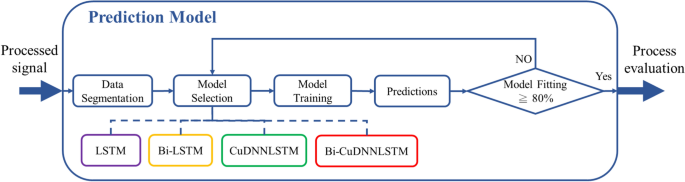
Flowchart of prediction model construction
6.1 Long short-term memory, LSTM
LSTM, a type of recurrent neural network (RNN) [42], is designed for time-related problems with feedback connections, unlike feedforward networks [43]. Its structure is shown in Fig. 13. LSTM is effective for predicting manufacturing processes with long time intervals [44, 45]. Gradient descent was used to adjust model weights and minimize training error.
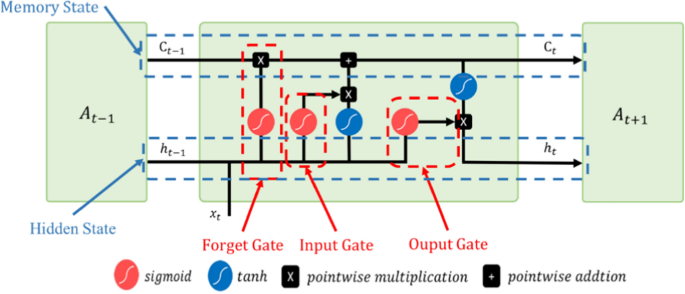
LSTM cell
LSTM units include four components: the forget gate decides data retention or removal, the input gate updates the cell state, the output gate determines the next hidden state, and the memory unit preserves relevant information for long-term use. The formulas for these gates are as follows:
The proposed LSTM model consists of three LSTM layers, each with 128 hidden units, followed by a dense layer whose hidden units match the prediction horizon. Two activation functions, sigmoid function and tanh function, are used. The sigmoid function, Eq. (14), generates probabilistic outputs. The tanh function, Eq. (15), is a scaled and shifted sigmoid function to enhance gradient strength and convergence speed.
6.2 Bidirectional Long Short-Term Memory, Bi-LSTM
Bidirectional long short-term memory (Bi-LSTM) extends the LSTM architecture by processing time-series data in both forward and backward directions. Unlike conventional LSTM, Bi-LSTM captures past and future contextual information, enhancing pattern and dependency recognition in time-series data.
The Bi-LSTM architecture consists of two LSTM layers that process input sequences in forward and backward directions, with their outputs concatenated to form the final output, as illustrated in Fig. 14. The forward LSTM captures past information, while the backward LSTM captures future information. This bidirectional learning mechanism addresses limitations of conventional RNNs, making Bi-LSTM more effective for temporally dependent data. For complex time-series analysis, Bi-LSTM improves prediction accuracy and robustness. The final hidden layer output of Bi-LSTM concatenates the outputs from the forward LSTM and from the backward LSTM, as expressed in Eqs. (16)-(18), where σ represents the activation function.
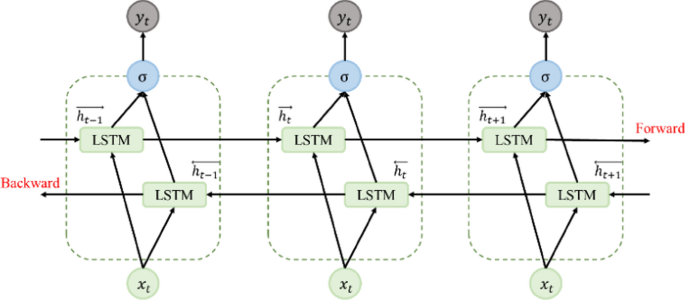
Bi-LSTM model architecture
Each prediction model is trained and evaluated on preprocessed signals [46,47,48,49]. This study employed four error metrics, namely coefficient of determination (R2), root mean squared error (RMSE), mean absolute error (MAE), and mean absolute percentage error (MAPE), to assess the accuracy of the models.
7 Results and discussion
7.1 Comparison of prediction models
This study investigated the use of EWMA as a signal preprocessing technique for predicting AE signals in the centering process. Models with and without EWMA preprocessing were compared to evaluate its impact on prediction accuracy. Additionally, various LSTM-based models were analyzed to assess their performance.
A total of 45,000 AE signals from 30 centering processes were collected using an industrial computer (4-core i5-7500 CPU, 16 GB RAM, 256 GB SSD) for edge computing. The AE signals underwent down-sampling and EWMA preprocessing before training on four prediction models. Figure 15 shows the down-sampled signals, including abnormal features. While EWMA smoothing reduces the prominence of certain signal peaks, including those related to cracks, careful reanalysis of the processed signals confirmed that the fundamental patterns and anomalies necessary for accurate defect detection are still preserved. Five lenses with edge cracks and two lenses with circularity errors were successfully identified, although EWMA smoothing caused four crack-related features to appear less prominent. The signals were standardized, and the dataset was split 90% for training and 10% for testing.
AE signals and abnormal features before and after EWMA of 30 centering processes
To prevent overfitting in the predictive models, this study conducted sensitivity analysis and K-fold cross-validation for four different models. The dataset was divided into five subsets for training, with five repetitions of validation performed to identify the optimal hyperparameters. Once the optimal hyperparameters were obtained, they were applied to the predictive models for training and used to evaluate the final performance.
Firstly, the prediction model was trained Firstly, the prediction models were trained using AE signals both with and without EWMA preprocessing, as shown in Tables 1 and 2.
The comparison results indicate that while the Bi-LSTM model achieved better prediction performance than the standard LSTM in terms of R2, RMSE, and MAE, it also incurred approximately double the computational time and significantly higher memory usage.
To address the limitations of computational cost, the CuDNNLSTM model was introduced with GPU-accelerated execution using the CUDA framework. The results showed that CuDNNLSTM maintained comparable or even better prediction accuracy than Bi-LSTM while substantially reducing execution time and keeping memory usage at a manageable level.
Among all evaluated models, CuDNNLSTM demonstrated the most favorable trade-off between prediction performance and computational efficiency. It achieved high R2 values, indicating strong explanatory power for target variability, along with low RMSE and MAE, confirming its reliability in real-time industrial applications. These advantages make CuDNNLSTM the most suitable model for integration into real-time AE signal monitoring systems.
Comparing the results in Tables 1 and 2, EWMA signal preprocessing significantly improved model performance in terms of R2, RMSE, and MAE, while computational time and memory consumption remained at similar levels. The prediction models that underwent EWMA signal preprocessing exhibited superior performance than those without EWMA.
These results highlight EWMA’s role in enhancing predictive accuracy. However, as noted in Sect. 5.3, EWMA cannot fully capture all abnormal conditions, warranting further evaluation of its benefits. Figure 16 illustrates the fitting results for training and test data, visually comparing the accuracy and consistency of models with and without EWMA preprocessing in capturing key patterns and trends.
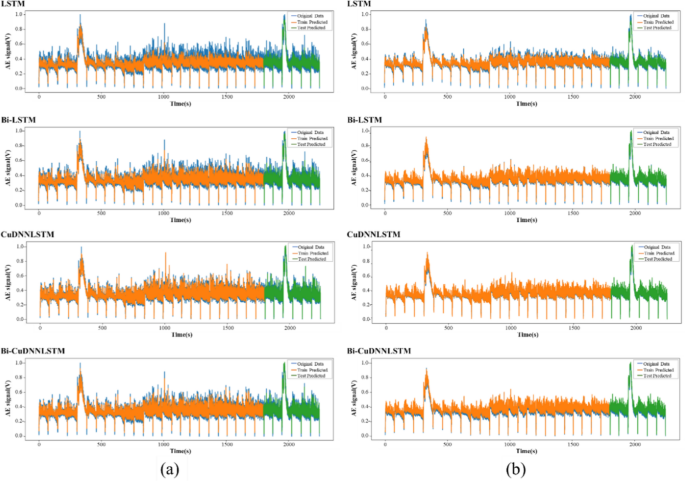
Prediction results a without EWMA preprocessing and b with EWMA preprocessing
In Fig. 16a, without EWMA preprocessing, the model could identify basic signal trends but exhibited significant fluctuations between predicted and actual values, highlighting challenges in capturing fundamental variations. Conversely, Fig. 16b demonstrates that with EWMA preprocessing, the predicted values closely aligned with actual values, indicating enhanced accuracy in capturing the features and trends of AE signals.
7.2 Verification of monitoring system
In process monitoring and prediction of abnormal conditions, system reliability depends on signal readability, which determines the clarity of abnormal conditions in the signal, and model accuracy, which affects operators’ judgments. AE signal features are predicted before abnormal conditions occur and must be effectively identified in a reliable intelligent centering process.
A series of centering processes were conducted to verify the benefits of the monitoring system. Additional 50 quartz lenses with the same specification were processed. The target specification is edge crack < E0.2, circularity error < 0.02 mm. To minimize human factors, an operator stood by during the centering processing. If an AE signal feature appeared, the operator could immediately record and check the lens. According to Tables 1 and 2, CuDNNLSTM has the best performance. In this verification, the traditional approach, CuDNNLSTM and CuDNNLSTM with EWMA preprocessing were compared. The objective was to estimate the probability of the detection of abnormal process conditions. The yield rate and production time are evaluated, as shown in Table 3.
In traditional centering process, inspection was conducted once after processing every five lenses. It took 10 min to inspect once. During inspection, the batch centering process was stopped to prevent further unnoticed abnormal conditions. As an abnormal condition including a lens defect was found, the operator generally took 5 min to adjust the process parameters. By using the proposed monitoring system, the process condition was monitored and predicted in real time. Most lens defects and abnormal conditions could be prevented without routine lens inspection.
Therefore, as shown in Table 3, the total inspection time in the traditional method took more than half of the total production time. Furthermore, every detected lens defect took an additional 5 min to adjust the process, and the lens was inevitably scrapped. In this verification, the traditional method was unable to prevent lenses from scraping, leading to 36% scrap rate and only 64% yield rate in the end. In the proposed method, in-process inspection was skipped, and abnormal conditions were entirely identified through process monitoring. Although this increased the total adjustment time to 1.4 to 2 times that of the traditional method, the overall production time was significantly reduced due to the absence of inspection downtime. Furthermore, real-time monitoring could predict the potential lens defects, thus preventing most of the scrap. As a result, the yield rate could be maintained over 80%, and over 30% of the production time was saved.
Consequently, the proposed monitoring system by this study can effectively improve the yield rate and reduce the production time. Based on the verification results, the monitoring system employing the CuDNNLSTM prediction model showed an enhancement in yield rate from 64 to 92% and reduced the total production time by 32.9%. Though CuDNNLSTM with EWMA has lower prediction accuracy of edge cracks, it can perfectly predict circularity errors. Moreover, the total production time was saved up to 43.0%. Therefore, according to production line requirements, different prediction methods can be selected to optimize the mass production. If the reduction of production costs is focused, CuDNNLSTM is recommended to maintain high yield rate. If the production efficiency is emphasized, CuDNNLSTM with EWMA is the optimal choice.
The proposed monitoring system by this study has been introduced into real production line. Besides quartz, for different materials such as BK7, S-NBM51, S-LAH, and so on, with higher hardness, lower abrasion of lens, or lower granularity of grinding wheel, the level of AE signal goes higher. Furthermore, the signal features of edge cracks and circularity errors are much more obvious. For different surface types, concave surface tends to contain more edge cracks during centering, and plane surface or surface with lower curvature has higher circularity error. Therefore, the detection sensitivity of the defects varies with different materials and shapes of the lens products.
8 Conclusion
This study developed a real-time lens-centering monitoring system that can predict trends in AE signals during centering to enable triggering of a warning about manufacturing abnormalities. This early warning can prevent product loss due to damage such as cracks and circularity errors. The four prediction models: LSTM, Bi-LSTM, CuDNNLSTM, and Bi-CuDNNLSTM were trained, and the accuracy and computational time of the models were compared. Among these models, CuDNNLSTM had almost the highest accuracy (R2 = 0.9833) and the shortest time (36s) per prediction. Hence, CuDNNLSTM is the most suitable model for real-time monitoring of centering processes. Moreover, EWMA data preprocess improves the performance of prediction model but sacrifices some signal features. It not only enhances the accuracy, but also increases the calculation efficiency.
A verification including 50 centering processes of quartz lenses was conducted. Based on the results, the proposed monitoring system by this study was evaluated and can effectively improve the yield rate and reduce the production time. CuDNNLSTM prediction model showed an improvement in yield rate from 64 to 92% and reduced the total production time by 32.9%. Moreover, CuDNNLSTM with EWMA perfectly predicted circularity errors and saved the total production time by 43.0%.
The proposed monitoring system has been imported into real production line in the optical company. During the application in real batch production, the signal levels and abnormality data of different materials and types of lenses were recorded as database. This historical data is used to tune the parameters of the monitoring system and broaden the applicable range of the system. In the future, as the production data is collected and referred by the system, the monitoring system will become more precise and widely applicable monitoring system.
The successful development of this real-time lens-centering monitoring system represents a significant advancement in the glass lens-grinding industry. It enables autonomous error detection and moves companies closer to Industry 4.0 principles. By integrating these prediction models into production lines, manufacturers can proactively monitor centering processes, leading to timely interventions and improved stability. Anticipating machining conditions and identifying anomalies empowers operators to take prompt corrective actions, reducing product defects and ensuring efficient operations. Future research can further optimize these models, refine architectures, explore additional features, and incorporate real-time feedback for enhanced accuracy and adaptability. Integrating advanced prediction models into machining workflows improves productivity, quality control, and operational efficiency. This study demonstrates real-time monitoring and prediction feasibility in lens grinding for centering, contributing to intelligent manufacturing practices in the industry.