Article Content
Abstract
Eye-tracking technology has emerged as a powerful tool in science education research, providing unparalleled insights into learners’ visual attention, cognitive processing, and engagement with complex visual stimuli. This systematic review synthesises findings from 170 studies published in Web of Science-indexed journals, selected from an initial pool of 525 articles. The analysis reveals that most studies were conducted in Europe (with physics education dominating at 34%) and primarily targeted university students (55%), while only 22% focused on younger learners, including preschool and lower-secondary students. The median sample size across studies was 36 participants, highlighting a methodological constraint that merits attention. The results identify key research themes: the processing of scientific representations (29%), reading behaviours in learning materials (28%), problem-solving tasks (19%), experiments and simulations (18%), and video-based learning environments (6%). Eye-tracking metrics such as fixation duration, dwell time, and transition patterns were predominantly used to measure learners’ attention and cognitive load. Findings underscore the critical influence of learner expertise, prior knowledge, and spatial abilities on visual processing patterns. Novice learners exhibited surface-level engagement, frequent switching between representations, and difficulty integrating visual and textual information, whereas experts demonstrated focused, deeper processing. Instructional interventions were shown to enhance learners’ comprehension and performance significantly. However, challenges persist, including methodological inconsistencies, small sample sizes, and underexplored factors like emotional responses and self-regulation. The review highlights the pressing need for further research that utilises meta-analytical approaches, addresses diverse learner populations, and explores complex learning environments with eye-tracking technology. By offering actionable insights for instructional design and visual learning strategies, this review advances our understanding of how visual stimuli shape learning in science education and paves the way for evidence-based pedagogical innovations.
Explore related subjects
Discover the latest articles and news from researchers in related subjects, suggested using machine learning.
- Educational Research
- Education Science
- Public Engagement with Science
- Public Understanding of Science
- Research Methods in Education
- Science Education
1 Introduction
Learning context, teaching, and learning conception, i.e. research about how students learn science, have long been among the most researched topics in science education research (Lee et al., 2009; Lin et al., 2014, 2018, 2024). Historically, the ways of learning science have been influenced by shifts in educational paradigms and the introduction of new tools and techniques (Matthews, 1994). The advent of technology represents a significant milestone in this continuum as new tools are being developed to investigate learning processes in more depth. In the last several years, eye-tracking (ET) technology became available offering unprecedented possibility to record students’ cognitive processes in real-time, therefore disclose (science) learning. It provides unique insights that traditional methods, like think-aloud protocols, cannot offer, especially for analysing cognitive processes during learning.
Eye-tracking technology offers significant advantages in educational research by addressing the methodological limitations of traditional methods for examining learners’ cognitive processes (Beach & McConnel, 2019; Chen, 2024; Hahn & Klein, 2022; Ke et al., 2024; Lai et al., 2013). Methods such as interviews, think-aloud protocols, and students’ written justifications, while valuable, face validity challenges due to their reliance on learners’ metacognitive abilities and verbalization skills. In contrast, eye tracking enables real-time analysis of visual attention and information processing, providing reliable, objective data on attention allocation and offering unique insights into these cognitive dynamics. Its applications span diverse educational contexts, including problem-solving, knowledge construction, and laboratory work, facilitating a deeper understanding of how visual attention supports learning. By capturing detailed temporal and spatial data, such as fixation durations and gaze sequences, eye tracking illuminates cognitive engagement at a level previously unattainable (Ke et al., 2024; Lai et al., 2013).
Furthermore, observing learners’ attention distribution has proven valuable for instructional design by identifying effective visual cues and signalling techniques to guide attention—insights that learners themselves may not consciously recognise, therefore report through traditional methods (Hahn & Klein, 2022). By bridging these methodological gaps and providing domain-specific insights, eye tracking has become a powerful tool for advancing educational research and practice. Consequently, a comprehensive review of current findings and trends, alongside emerging research directions, is both timely and essential.
2 Theoretical Framework
2.1 Application of Eye Movement in Education Research
The ET methodology is grounded in eye movement characteristics and cognitive science. It builds upon the eye-mind hypothesis (Just & Carpenter, 1976) which suggests that eye movements reveal direction of attention. The eye-mind hypothesis states that visually fixed information is also processed mentally. Following these assumptions, eye movements can be interpreted as a temporal-spatial decoding process of visual information (Holmqvist et al., 2011). In other words, the way an individual perceives information reflects cognitive information processing, and many studies postulate a relationship between visual attention and cognitive processing (e.g. Tsai et al., 2012). Despite the existence of studies with contradicting results, the hypothesis that attention during complex processes is closely linked with eye movements is widely accepted (Rayner, 1998).
ET is also heavily influenced by constructivist theories of learning. These theories assert that knowledge is actively constructed by learners through their interactions with the environment (Piaget, 1954). ET enables researchers to observe these interactions in real-time, providing empirical data that can validate or challenge existing educational theories. By revealing information about visual attention, ET offers insights into where individuals focus their gaze. This capability contributes to the philosophy of science by refining or challenging established theories. ET also facilitates the investigation of individual differences and conceptual development, addressing epistemological questions about how knowledge is acquired and processed by different individuals (novices vs. experts, disadvantaged learners etc.). Furthermore, in educational research, ET methods explore how educational technologies influence and are influenced by societal norms and behaviours. The collaborative nature of ET research, involving multiple researchers and institutions, highlights the sociological aspects of scientific inquiry, including academic collaboration dynamics and the dissemination of scientific knowledge (Lai et al., 2013).
Eye tracking enables researchers to study the allocation of visual attention, thereby implying it can tell us which elements of a visual stimulus (e.g. learning material) a participant looked at, for how long, and in what order. For this purpose, eye-tracking measures, such as fixation duration, fixation count, and saccade length, can be defined that allow to study attention allocated to different parts of a representation (Gegenfurtner et al., 2011) or to quantify differences in visual processing of different representations (e.g. formulas and graphs). In addition, many researchers exploit the number of transitions between certain aspects of a stimulus to study solution strategies. However, the step from eye movements to actually running mental processes is not trivial. Following a new approach of an embodied and extended cognition perspective to the integration of external representations by Pande (2021), a crucial role in learning with representations is attributed to the coupling of internal and external representations through sensorimotor interaction processes (e.g. perception). Therefore, it seems appropriate to apply a method that captures these sensorimotor processes when information must be selected, organised, or integrated for learning, thus supporting the use of eye tracking methodology.
2.2 Eye Tracking in Science Education Research
In order to design quality education, constant feedback is necessary. One of the most influential international programs impacting curricula worldwide is the Programme for International Student Assessment (PISA) which mainly focuses on reading, mathematical and science literacy. Despite facing substantial criticism (Serder & Ideland, 2016; Sjøberg, 2007; Zhao, 2020), PISA results have driven curricular changes in numerous educational systems by providing comparative data on student performance across more than 70 countries for over two decades. However, while these results offer valuable insights, they still represent a “black box”. The lengthy test format can only partially reveal students’ reasoning processes and provide limited understanding of the cognitive mechanisms underlying their performance (Forestier & Crossley, 2015).
This is an example of unique opportunity eye-tracking offers to understand the results in a way which can be translated into teaching practice (Hu et al., 2017; Krstić et al., 2018; Tóthová & Rusek, 2021b).
In particular, eye tracking has proven its importance as both visualizations and texts are crucial in science learning (Anagün & İşcen, 2010; Gilbert, 2010; Repnik et al., 2011). Also, it proved useful in problem-solving processes’ mapping (Klein et al., 2019a; Susac et al., 2018; Tóthová et al., 2021)—a part of scientific literacy (Cipkova et al., 2018; Hild et al., 2018).
The use of eye-tracking methodology in education has been increasing (Jarodzka et al., 2017; Ke et al., 2024; Lai et al., 2013) in the last decade. In reaction to this the European Science Education Research Association (ESERA) established the seventh Special Interest Group, titled “Eye-Tracking in Science Education Research”. This development highlights the increasing consensus among science education researchers in Europe, and beyond, regarding the relevance and potential of this method in advancing educational research.
As the use of eye tracking continues to grow, the number of published studies has naturally increased as well. Therefore, a need for an overview and categorization has been rising too. With the technology increasingly available, researchers can enter this field more often. Despite there were several reviews focusing on eye tracking published (Hahn & Klein, 2022; Kekule, 2014; Lai et al., 2013; Strohmaier et al., 2020), none focused on its use in science education research. Having an overview helps connecting one’s own work to the emerging field of eye tracking, while showing how various methods have been used in the science education research community thus far. Apart from novice researchers or researchers new in the field, it may instruct others to carry on their research and even construct a framework revealing already known (and confirmed) knowledge and, on the contrary, unmapped areas requiring research interest. Last but not least, with many research groups learning how to use the technology and present their results on their own, different nomenclature (viewing time or dwell time), measurement standards (e.g. viewing time or fixation time) (see e.g. Lai et al., 2013), or standards concerning other details (accuracy, calibration) may also be a barrier for some to find inspiration in literature. Such a systematic review of papers in science education is still missing. Therefore, this paper brings an overview of the use of ET in science education with the main results. For this reason, this review was done to support all these enthusiasts to promote the use of eye-tracking not only in science education to reveal so far fuzzy questions of learning.
3 Goals and Methodology
The presented review aimed to identify and report empirical studies which employed eye-tracking as a source of information about science education. The concrete benefits of this review are in answering the following research questions.
- RQ1: What are the trends in science education research using eye-tracking methodology?
- RQ2: What are the technical and methodological aspects?
- RQ3: What are the most addressed topics in this type of research and their results?
The trends’ identification addresses the dissemination of the eye-tracking method. It includes identifying the number of studies using ET within science education research, the year and location of publication or the focus of studies. Technical and methodological aspects include hardware and software, used metrics, and sample size specifications. The main results of the included studies are categorised and discussed.
3.1 Methods
In this study, a systematic literature review of empirical studies focused on science education that used eye-tracking was performed, aiming at comprehensively summarise the existing literature pertaining to our research questions.
3.1.1 Paper Selection
Database.
In accordance with similar studies in this field (Lai et al., 2013; Lin et al., 2018; Teo et al., 2014), the Social Sciences Citation Index (SSCI) database from the Web of Science (WoS) was used as one of the highly recognised databases indexing core journals in the social sciences.
The Search
As far as the keywords’ selection was concerned, the papers were identified in several stages. In accordance with other reviews on eye tracking, different versions of this method’s indication were used with the Boolean operator “OR”. Operators “AND” were used to include the field of science (and its subdisciplines) and education. The final search rule added to the Web of Science Core Collection search engine within Topics was as follows:
(eyetracking OR eye-tracking OR “eye gaze tracking” OR “eye-based gaze tracking” OR “eyegaze tracking” OR “eye-movement”) AND (science OR biology OR physics OR chemistry OR geography) AND (learning OR teaching OR instruction OR education).
The whole process together with numbers of papers is shown in the Prisma flow diagram in Fig. 1.
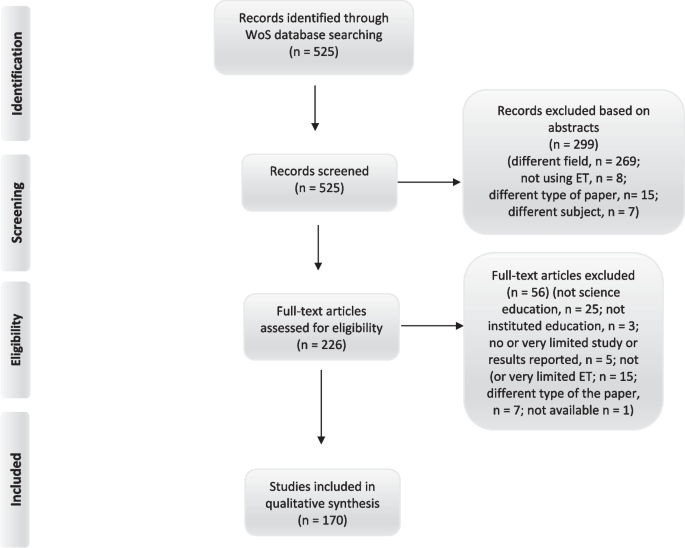
PRISMA flow diagram
Identification
As eye-tracking is still quite a young methodology, no bottom bound was set for the search. To capture most of the papers published, the final search was performed in mid-September 2024. With respect to the field’s dynamics, the document type was set to articles, early access articles and conference papers. As the review aims at international readership offering them directions for their research, only papers in English were reviewed.
Screening
Initial results of this search were subsequently systematically and manually screened by two researchers independently in order to check if the search results fit the study’s purpose based on titles and abstracts. Studies not using ET, other types of paper (non-empirical papers, papers with non-origin research, reviews, etc.), studies from other fields (e.g. mathematics, computer science, medical science), and studies focused on different subjects (infants, animals, etc.) were excluded. In case of inconsistences between the two researchers’ decision, consensus by agreement was sought. After this round, the papers were submitted to a whole text reading.
Eligibility
This process led to 56 papers’ exclusion due to the above-mentioned reasons (not obvious from the abstracts). It was mainly a focus on different field with a scientific background (e.g. reading in a second language, mathematics), not using eye-tracking as a research method, and papers of technological nature (hardware and software being the primary focus). Finally, the resulting 170 papers were submitted for the review.
3.1.2 Coding Procedure
To code the papers, categories from previous reviews focusing on eye tracking (Kekule, 2014; Lai et al., 2013) were used and later completed with others (Chen, 2024; Hahn & Klein, 2022): author, continent, country, level of education, subject, topic, RQ/goals, technological and methodological aspects, results, implications. First, contents of the papers were preliminary coded using the categories above, eventually new categories were added. Second, information in broader categories were unified to enable easier coding. This was the case of the categories: level of education and subject which reflected differences among school systems worldwide. Also, categories such as topic and technological and methodological aspects had to be unified under inductively formed categories.
The analysed studies were coded using the following categories and subcategories:
- Publication information (document type, authors, publication year, publication title, title)
- Demographics (region, locality)
- The analysed papers were assigned to the locality according to the authors’ affiliations. When authors from two or more countries were participating, the paper was assigned to the country the study was conducted in.
- Focus (level of education, school subject, topic, aim, research questions)
- Methodological aspects
- Research sample (original, excluded, reasons for exclusions, final)
- Research design + Educational factor
- ET information (hardware, sampling rate, calibration, software, eye-movements metrics)
- Additional methods (other methods, performance measures)
- Procedure
- Results
- Implications
To answer RQ 3, the mainly addressed topics were determined inductively after coding all papers. The categories that emerged included: reading of a learning material, scientific representations, experiments/simulations, problem-solving, video lectures.
Third, to ensure objectiveness, the first coding was done using a customised bot in ChatGPT prompted to provide required information from uploaded papers. After the first round, one researcher checked the results to confirm the information fits the papers’ content. After this, the second researcher checked 10% of randomly selected papers to ensure the inter-coder reliability (O’Connor & Joffe, 2020). Though the ChatGPT bot made several mistakes which needed to be corrected, there were only three inconsistencies (from all double-coded papers and categories—each analysed paper was coded in 27 categories) between the two researchers’ codings. This points to an excellent agreement. The inconsistencies were solved by discussion among the authors.
In case of the topics addressing RQ3, in order to maintain the highest degree of objectivity, each article was assigned in the topic based on two coders’ decision. In case of their discrepancy (happened nine times of all papers included in the review), the article’s topic was evaluated by another coder. Subsequently, a consensus by discussion was reached.
The review also included papers consisting of more than one experiment. The way these articles’ parts were coded depended on the purpose of the analysis. In case of general trends and methodologies (RQ1 and partly RQ2), the studies were counted only once as they were published in one article to avoid aggregation bias. In the case of the research design (methodological aspect) and RQ3, the individual studies in the multi-study articles were coded when dealing with different research problem. In case only one part of multi-study articles used ET, just this part of the research was considered in the analysis.
4 Results
4.1 Trends (RQ1)
4.1.1 Publications Across Years
The number of publications published in years is shown in Fig. 2. An increasing trend (see the line) is in accordance with overall increase in publications, but also shows ET’s increasing use in SER.
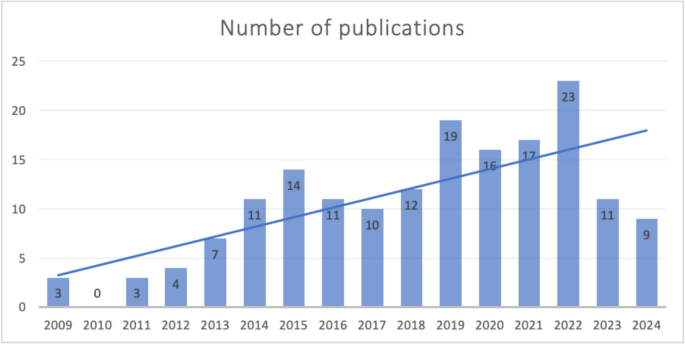
Number of publications during years
4.1.2 Country Ranks
The list of countries represented by researchers who have been using ET the most in SER is shown in Fig. 3. The field has been dominated by researchers from Europe, especially Germany. European countries with only one analysed record are not presented in above mentioned graph for the sake of its clarity. One record was identified in Belgium, Poland, Great Britain, Switzerland, Austria, and Finland. Asia is the second most publishing region, with the significant contributors from Taiwan. One paper was identified in India. From North America, only papers from USA were found. Noth America is represented by Brazil with one record in analysed field.
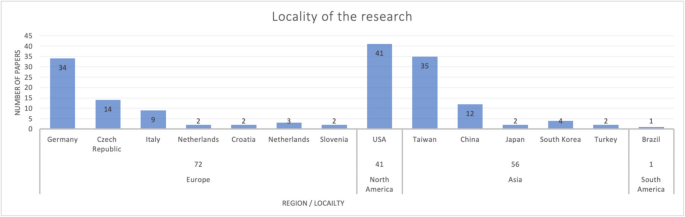
Locality of analysed research
4.1.3 Most Addressed Fields
To inform researchers working in particular fields, the studies were divided into groups according to their original focus. The majority (as shown in Fig. 4) of research aimed at physics (33%) and chemistry (25%). Considering the fact scienceFootnote1 includes several disciplines at lower levels of education in many countries (Blonder & Mamlok‐Naaman, 2019; Forsthuber et al., 2011), only 16% share was surprising. This was later explained by the level of education ET has been used the most for. With an increasing level of education, majority of school systems include separate scientific disciplines. As ET is being used mostly in higher education, the studies specified on concrete fields.
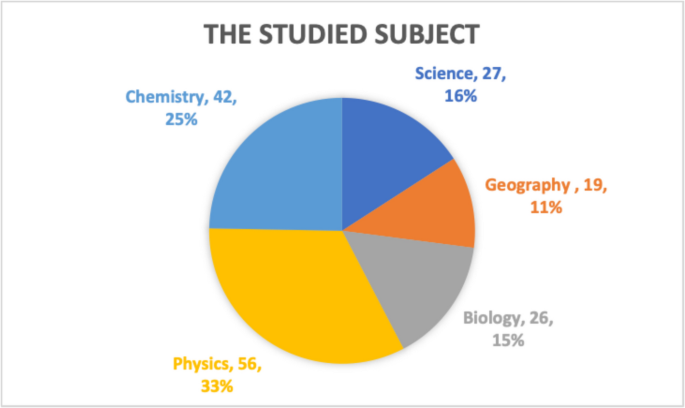
The school subject studied in the analysed research
4.1.4 Most Addressed Level of Education
All levels of education have been targeted by the research however not equally. The university level dominates with 55% (83), followed by lower-secondary level 25 (17%) and upper-secondary education 14 (9%). Only 6 studies (4%) focused on elementary education and one study on pre-school children.
Moreover, 18 (12%) of the studies focused on more than one level of education. For example, they compared university high school and elementary students in solving task with microscopic animation (Slapničar et al., 2020) or compared eye movements of students and their teachers (Beitlova et al., 2020; Pande & Chandrasekharan, 2021). Two studies are referred to as “other”: one was an out-of-school study (Krogh-Jespersen et al., 2020), and the other was aimed at teachers (Drexler et al., 2019). Only one study did not specify the target group.
4.2 The Methodological Aspects (RQ2)
4.2.1 Sample Size
As far as the sample size is concerned, the eye-tracking studies used 54 participants on average (med. = 36). However, sample sizesFootnote2 varied from 3 (Tóthová & Rusek, 2021a) to 663 (Yun, 2020).
Lower sample sizes are typical for studies which combine more methods and focus on qualitative part (for example classical tests, eye tracking, and think-aloud or interviews), as each individual session with a student was considerably time-consuming. Sample size also varied depending on the study design, which included within-subject, between-subject, and mixed (within-between) designs. When identical, unchanging conditions were applied to all participants, the term “assessment” was used (see Table 1).
In some studies, however, the methods were only quantitative, i.e. students in a computer classroom watched a material on a screen with their eye-movements recorded; therefore, higher number of participants was feasible.
4.2.2 ET Equipment
The corner stone of eye tracking is the equipment. Studies used variable cameras and software. The five most used manufacturers are shown in Table 2. Majority of the analysed studies used stationary eye trackers. Only in 19 cases, the eye-tracking glasses were used.
Other, less frequently used devices were from the following manufacturers: PupilLab, EyeFollower (LC), Viewtracker, EyeGaze, Eye Tribe, APL, Eyetech, and EYESO.
The sampling rate of the eye trackers varied from 30 Hz (n = 6) to 2000 Hz (n = 1), with the most frequently used sampling rate 60 Hz (n = 72) and 120 Hz (n = 66). Other sampling rates were 1000 Hz (n = 15), 250 Hz (n = 10), 300 Hz (n = 4), 100 Hz (n = 4), 90 Hz (n = 4), and 50 Hz (n = 6). Many (n = 38) studies did not report hardware’s sampling rate.
While hardware was mentioned in all but 6 analysed studies, the software for raw data analysis was not reported in 64 cases. Most of the studies used software by the hardware distributor: Tobii (n = 53), SMI (n = 15), Eyelink (data viewer) (n = 13), FaceLab software (n = 7). Some studies (n = 10) used freely available software OGAMA. In some cases, other software was used, e.g. LG technologies software (n = 2), Mangold Vision (n = 1) or EYESO studio software (n = 1).
4.2.3 Sample Reduction
Contrary to more traditional methods used in SER, studies using eye-tracking are specific for their sample reduction as not every participant fulfils the criteria for eye-tracking measurements. The technology requires a certain vision quality as well as measurement conditions to provide reliable data (see, e.g. Tóthová & Rusek, 2021c). These problems are often the cause of some participants’ exclusion. The numbers of reported exclusions varied from 1 to 31 (mean = 9, Med. = 6) in the analysed papers. The exclusions were based on technical problems: incomplete data (e.g. Dever et al., 2019; Hinze et al., 2013b), poor or problematic calibration (Beitlova et al., 2020; Schnotz et al., 2014), or device’s malfunction (e.g. Novick et al., 2012; Stull et al., 2018), but also caused by human factor: students did not follow instructions (Chiou et al., 2019; Ishimaru et al., 2017), researcher’s error (Kastens et al., 2016), outliers (van der Graaf et al., 2020), or a study subject’s learning disabilities (Mason et al., 2015a). Many studies (n = 105) did not refer about participants’ exclusion.
4.2.4 ET Measurement Metrics
Eye-tracking metrics represent the way of participants’ visual attention analysis. The most frequent measures are shown in Fig. 5. They were coded in accordance with Lai et al. (2013) in order to show homogeneity of ET-based SER with other fields of education research.
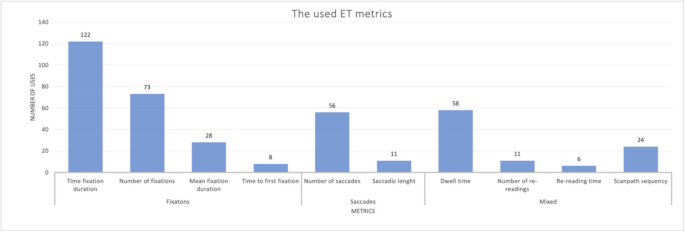
Eye-tracking metrics used in analysed studies
The studies used mostly metrics based on fixations. The most used was total fixation duration (96 studies) and proportion of total fixation durationFootnote3 (n = 26). The use of the metric reading time was found problematic. Some authors use the term “sum of fixations in the area” (Jian & Ko, 2017; Yang, 2017), and others used “time spent in area” (e.g. Ho et al., 2014; Wang et al., 2016), which included both, fixations and saccades. In this review, the term dwell time (n = 49) is used, some authors also used its proportion (n = 9). The second most used metric was fixation count (n = 58), again being used also as a proportion (n = 15). Other fixation-related metrics were as follows: mean (average) fixation duration (n = 26), first fixation duration (n = 3), time to first fixation (n = 7), probability of first fixation (n = 1), fixation density (n = 1) or dispersion (n = 5), and distribution (n = 1).
As far as saccades were concerned, the saccade count or transition countFootnote4 (n = 56) was used most often. In some cases (n = 4), regressions were mentioned too. Length (scanpath length, total length of saccades; n = 12), duration (n = 1), angle (n = 4), amplitude (n = 2), velocity (n = 3), and distribution (n = 1) were also measured.
Students’ repeated visits of areas of interest (AOIs) were measured with the use of: number of visits (n = 4), re-reading count (n = 11), re-reading time (n = 5), or its proportion (n = 1) as well as re-reading frequency (n = 1).
From other metrics, the authors used scanpaths or fixations’ sequences (n = 24). Two studies used sequences’ similarity. For the similarity count, the ScanGraph program proved useful (Škrabánková et al., 2020). Gaze frequency was used only in one case. On top of this, some studies (n = 11) used the pupil radius (size, dilatation) or blinks count/rate (n = 4).
When a sole metric was used in an analysed study, the attention of subject was measured by time spent in an area (or total fixation duration in an area). Only in one case, fixation sequence was used as the only metric (Cullipher & Sevian, 2015).
Also, more advanced metrics were used in some cases, on the basis of the standard metrics above, e.g. gaze or transition entropy (Mozaffari et al., 2016b, 2020) or saccade to previous transition ratio (Yun, 2020).
These metrics were often specific to the research, e.g. laminarity rate (Liu et al., 2021). This rate indicates the level to which student watched the same area as their partner during collaborative learning, or volatility (Pande & Chandrasekharan, 2021), which indicates participants’ flexibility when exploring AOIs and their relationships. As these metrics are research-specific, they are not included in the graph (Fig. 5).
4.2.5 Research Design
The research design classification was done based on each study’s sample treatment. Studies in which each subject was exposed to only one identical treatment were classified as the assessment design. Other classifications followed the common distinction of between- and within-subjects design (see, e.g. Charness et al., 2012). A study was classified as between-subjects design, when everyone was exposed to only one out of various treatments whereas two or more groups were formed to be exposed to different interventions, for example different learning environments. In contrast, a study fell onto the within-subjects design category, when everyone was exposed to more than one of the tested treatments, for example if one subject underwent successive learning conditions or phases or if a pre- and a post-test was conducted using eye tracking. In addition, a mixed design category was used for studies which combined the treatments. The shares of studies’ designs are shown in Table 3.
Over a half of all analysed studies used an assessment design to examine the eye movements during different activities. These studies used the same conditions for all students without comparing educational factors in stimuli (see, e.g. Dong et al., 2018). About one-fifth of the studies used the within-subjects design. For these studies, the treatment factors were extracted. Some studies described a distinction of different phases of education or tasks: for example Chiou et al. (2019) learning with a physical simulation in “setting-up” and “implementation” stage. Hinze et al. (2013b) and Ishimaru et al. (2016) investigated the learning process and the subsequent assessment using eye tracking by differentiating “instruction”, “viewing session”, and “problem set” for a learning session about molecular visualizations.
About a quarter (23%) of the analysed studies used the between-subjects design. Regarding the educational factors, the latter has primarily been used to analyse learning scenarios. Thus, many studies used a group split between different learning environments, tools, or media. For example, Sweeder et al. (2019), Martinez et al. (2021), and VandenPlas et al. (2021) compared the use of screencasts and simulations in learning different chemical concepts. Chen et al. (2015) compared static and dynamic 3D representations regarding their influence on students’ atomic orbital model conceptions. Except for the multiple representations, the influence of learning approaches was also studied, e.g. the use of analogy or metaphors in (Chen & She, 2020).
Moreover, 4% of the analysed studies used mixed design. Klein et al. (2019b) investigated the influence of visual cues in the analysis of vector field concepts by comparing two groups with and without aids. Hoyer and Girwidz (2020) contrasted different types of training on physical diagram literacy. One study also investigated two time-independent factors (detailed and simplified examples as between-subjects and pictures and lessons as within-subjects factor) in multi-representational learning of human anatomy (Lin et al., 2017).
4.2.6 Performance Measures
As far as performance measures were concerned, research procedures in individual studies were analysed and grouped. The overview of performance measures is in Table 4.
The most numerous groups of studies (51%) used some sort of tasks presented during eye-tracking session. Various tasks were used: graph-based tasks (Harsh et al., 2019), different models of molecules (Rau et al., 2015; Tang et al., 2016), diagrams (Jian, 2021; Taub & Azevedo, 2016), etc. The tasks were represented by problems for students to solve. A special group within this category was formed by laboratory tasks. For example, one study investigated students’ interaction with guidance to conduct scientific inquiry (see Chiou et al., 2019). After checking if the students completed the requirements of the guidance, correctness of their answer to an inquiry task was checked together with their visual patterns. About 4% of studies using tasks used some sort of verbal answers during the actual eye-tracking process. This included students’ responses to a tester based on tasks given on the screen (Slapničar et al., 2020; Tóthová et al., 2021). In another study, students read a text aloud and were later asked to retell it (Hung, 2014). The oral responses are usually being used to avoid students’ head movements or shifts in attention when giving an answer.
A knowledge gain during a lesson or eye-tracking session was tested in 38% of the analysed papers. Typically, these studies’ participants were given a scientific text to read/study with their eye movements recorded. After this procedure, they were given a test with their results’ being associated with their ET-measured behaviour. This was the case for example of a study looking into the effect of the concrete vs. abstract illustrations’ use (Mason et al., 2013b) or the effect of geographical comic on students’ learning (von Reumont & Budke, 2020). Within this group, 11 studies focused directly on students’ working with/understanding scientific concepts. For example, Karafyllidis et al. (2019) used ET to investigate how different groups of learners’ on a different level of expertise behave in a simulations-based learning environment. A performance tests used in the studies aimed at the effect of seductive details in learning materials on students of different learner characteristics (Park et al., 2015), effect of a video showing an expert’s progression when reading a text about food chain (Mason et al., 2015b), or students’ text processing with or without pictures associated with particular sentences (Mason et al., 2015a). Apart from tests, concept maps were also used to identify students’ knowledge gain (Dogusoy-Taylan & Cagiltay, 2014).
In 4% of the studies, students’ reading was examined. Yun (2020) investigated influences of scientific terminology comprehension on students’ cognitive processes during science text reading. Familiarity with scientific terms was ascertained in this research. Also, reading performance in connection with readers’ epistemic believes and motivation towards science was examined among university students (Yang et al., 2016).
Some studies also used practical (3%) tasks in their study, for example (Zang et al., 2022) let the students solve hands-on problem tasks.
In about 2% of the analysed papers, attention was given to students’ spatial ability and its effect on performance in science. For instance, Hinze et al. (2013b) investigated the effect of students’ spatial ability on their understanding scientific experiment. As another example, an activity useful in chemistry education—ability to imagine rotating molecular models—was evaluated (Moen et al., 2020). The authors investigated the effect of training on mental rotation (a spatial reasoning task) on the completeness of an encoded representation and students’ ability to rotate the representation.
4.2.7 Additional Methods
The methods used (except eye-tracking) in analysed studies are reported in Table 5.
Most studies used additional methods to enrich and explain the findings. However, almost one-fifth of the analysed studies reported only the main task (see performance measures) without reporting the use of other additional sources of information.
The most frequent method is pre-tests in various forms with knowledge-based pre-tests being the most common (used in 33% of the studies). They served either to divide students into groups according to their knowledge level (e.g. high degree of comprehension vs. low degree of comprehension (e.g. Tsai et al., 2016) or to ensure groups of students are equal before a treatment (Moon & Ryu, 2021). In some cases, pre-tests were used to select a sample of students for the eye-tracking study from a classroom/school (e.g. Tóthová et al., 2021). In other cases, pre-tests served as an indicator the subjects were not familiar with the topic which was central for the studies. Some of the studies used a pre-test and post-test design mostly to describe an effect of an intervention observed using ET (see, e.g. Peterson et al., 2015).
Another significant number of studies (11%) used a form of ability test. Several standardised spatial-ability tests (Hinze et al., 2013b; Mason et al., 2013a), working-memory test (Mason et al., 2013b), metacognitive skills test (Dever et al., 2019; Park et al., 2015), or reading-ability test (Jian, 2017; Jian & Ko, 2017) were used.
One quarter of the analysed studies supported the ET measures with other sources of students’ performance explanations. Twenty-one studies reported using the think-aloud method (Slapničar et al., 2020; VandenPlas et al., 2021). Although, in some studies, its description was not thorough enough to evaluate whether the conditions of think-aloud were fulfilled or whether it was a mixture of think-aloud and interview. Thirteen studies reported using interview (e.g. Tang et al., 2014). Another 7 studies applied a written reasoning (Jin & Yu, 2019; Rosengrant et al., 2009). In some cases, researchers used interviews to control the process of data-gathering. In 8 of the studies, researchers performed interviews with the students to check for their understanding (Jian et al., 2013; Mason et al., 2015a). Eighteen percent of the studies also used methods to describe the student sample in more detail. These were focused on students’ motivation. Motivation inventory, scale, or questionnaire was used to connect students’ performance with their willingness to solve science problems (n = 14) (Tsai et al., 2016; van der Graaf et al., 2020). Also, studies considered students’ science grades, study major, level of expertise in a certain topic, ability to apply scientific reasoning, learning style test, epistemic beliefs questionnaire, etc.
Additional source of information from students gathered after the procedure concerned students’ opinion of the solved task, learning material, etc. (Yang, 2017). This was used in 10% of the studies. It concerned materials’ usability, students’ perceived difficulty of tasks/problems, etc. Five percent of the studies used a comprehension questionnaire, and 3% a subjective lesson-rating scale. Nine percent of the studies used a self-confidence scale to inform their results (Klein et al., 2019b; Mason et al., 2013a).
In 5% of the studies, additional technology was used to gather data. One study used a thermal camera to associate the nose temperature difference with pupil dilatation when reading (Ishimaru et al., 2017). One more study used a mouse cursor tracking (Tsai et al., 2012). Perhaps the most curious was the use of fMRI brain scan to compare the results with the ET record (Moen et al., 2020). Other studies used brain waves and heartbeat combination (Wu et al., 2014).
4.3 The Most Addressed Topics (RQ3)
In order to categorise research topics studied with the ET’s help, the studies were divided into inductively defined categories shown in Fig. 6 inspired by Hahn and Klein’s (2022) review. Naturally, some of the categories overlap as many studies focus on several topics. Therefore, the line between categories is not sharp and the brief results are grouped according to the similarity of studies’ foci.
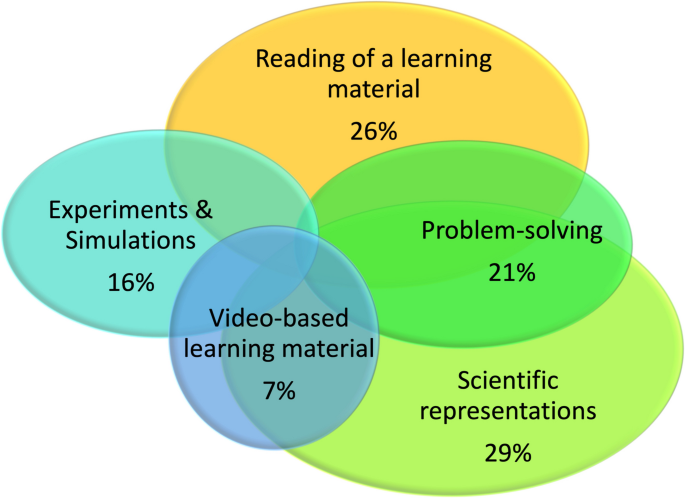
The most addressed topics
4.3.1 Reading of a Learning Material
The influence of learning material on students’ reading behaviour is crucial for authors and publishers of educational resources to instruct their work as well as for researchers to design effective evaluation studies. ET has provided valuable insights in this area.
The findings presented here underscore the complex interplay between material design, student expertise, and cognitive engagement during reading. The use of eye tracking enabled to study so far hidden processes. The studies showed attention distribution is shaped by factors such as text structure, prior knowledge, and image placement, emphasising the need for purposeful material design. Differences in reading behaviour between novices and experts highlight the value of scaffolding strategies to guide learners towards more effective information processing. Illustrations, while critical in science education, require careful integration to maximise their impact. Providing clear instructions or using techniques like gaze replays can help students effectively link visual and textual elements. Furthermore, the influence of epistemic beliefs and engagement on reading behaviour suggests that material design must consider both cognitive and psychological dimensions to foster deeper comprehension and critical thinking.
These insights provide a foundation for designing educational materials that align with diverse learner needs, bridging gaps between theory and practice.
Attention Distribution in Learning Materials (e.g. Textbooks).
Research has shown that attention distribution during textbook reading is influenced by factors such as the time allocated for reading a chapter (Drexler et al., 2018), prior knowledge,(Altan & Cagiltay, 2022; Ishimaru et al., 2016), and the placement of images (Drexler et al., 2019). Text structure also plays a role, with refutation texts significantly affecting eye movement behaviours (Ariasi & Mason, 2011; Ariasi et al., 2017; Catrysse et al., 2022; Jian, 2019). The difficulty of the text, including the use of scientific terminology, can prolong reading times (Jian & Ko, 2017; Jian et al., 2013), though this effect varies with students’ expertise (Yun, 2020)—see below. These findings contrast with Mudrychova et al. (2018), who studied students’ performance on science and common texts. Participants achieved similar rates of correct answers for questions based on both text types, indicating comparable cognitive effort in processing knowledge and common texts. The authors suggested the influence of additional factors to be further tested.
Reading Behaviour According to the Expertise.
In a similar manner, studies highlighted differences in reading behaviour based on age and expertise. For example, children and adults displayed distinct reading patterns (Jian, 2016), as do novice and expert readers. Experts show more transitions and longer average fixation durations (Cheng & Yang, 2022; Jian, 2017; Wang et al., 2022b). Expertise, influenced by prior knowledge (Kessler et al., 2020; Taub & Azevedo, 2016) or susceptibility to seductive details (Park et al., 2015), was found to affect students’ ability to extract relevant information (Yang, 2017).
Illustrations
The combination of illustrations and text is essential in science education, but students often struggle to integrate them effectively (Wu et al., 2021). The processing of illustrations is critical, with transitions metrics serving as key indicators (Ho et al., 2014; Jian, 2018, 2021). Strategies such as providing integration instructions (Ariasi & Mason, 2011; Mason et al., 2013a; Pardi et al., 2022) or using expert gaze replays as cues (Mason et al., 2015a) have proven helpful. Other studies (Lin et al., 2017; Mason et al., 2013b) found that simplicity in illustrations (and the phase of content processing—see Mason et al. (2014)) also influence attention. Students tend to evaluate a source’s reliability by spending longer inspecting illustrations, and active engagement methods like generating illustrations or hands-on activities effectively direct their attention to relevant information (Hellenbrand et al., 2019; Jian, 2022). Lin et al. (2017) and Mason et al. (2013b) found that simplicity in illustrations (and the phase of content processing (see Mason et al., 2014)) also influences attention. Students tend to evaluate a source’s reliability by inspecting illustrations longer, and active engagement methods like generating illustrations or hands-on activities effectively direct their attention to relevant information (Hellenbrand et al., 2019; Jian, 2022).
Illustrations in tests may enhance performance by acting as mental scaffolds that support comprehension and decision-making (Lee, 2023). In presentations, integrating additional information sources on slides (Yang et al., 2013) and employing multipage displays can enhance attention (Chuang & Liu, 2012). Choi et al. (2023) demonstrated that Eye Movement Modelling Examples (EMME) in illustrated scientific texts had a more substantial positive impact on comprehension than prompting. The study suggests combining illustrated texts with EMME-driven strategies for better learning outcomes.
The Influence of Epistemic Beliefs and Mood
In addition to material design, students’ state of mind was shown to affects reading behaviour. For example, university students spend more time inspecting sources they perceive reliable (Ishimaru et al., 2017). Epistemic beliefs significantly influence students’ interactions with study materials and should be considered during their design (Dever et al., 2019; Yang et al., 2016). Moreover, mood can also impact reading behaviours, further underscoring the complexity of these interactions (Scrimin & Mason, 2015).
4.3.2 Scientific Representations
The use of scientific representations, including data, models, and maps, is a key element of science communication and has been widely studied. Research encompasses various formats used in science education materials such as follows: graphs, charts, diagrams, and combinations of textual and visual elements, as well as comparisons across representation types. The reviewed studies which employed eye-tracking illustrate the critical role of scientific representations in fostering comprehension and problem-solving. Students’ ability to process maps, graphs, and diagrams is strongly influenced by their expertise, task familiarity, and the design of the materials. While experienced learners engage in deeper and more systematic processing, novices often exhibit surface-level interactions that hinder comprehension.
Dynamic representations offer potential benefits, particularly for students with lower spatial abilities, but their effectiveness depends on the context and task demands. The integration of multiple representations emerges as a key determinant of success, underscoring the need for targeted instruction to guide students in effectively transitioning between formats.
Spatial Ability and Map-Based Tasks
Spatial ability is frequently assessed with pre-tests to evaluate how it affects interaction with scientific representations. The new technology enabled deepened understanding to their processing by students. For instance, Hinze et al. (2013a) and Moen et al. (2020) used eye tracking to examine the effects of mental rotation training. They observed increases in saccade amplitude and angular disparity, suggesting that such training enhances eye movement behaviour and information encoding. However, Pande and Chandrasekharan (2021) found no significant differences in eye movements, even among students with advanced spatial competencies, although specific tasks revealed subtle variations in visual processing.
A specific group of studies focused on map-based tasks in earth science contexts further highlighted representations’ processing. Dong et al. (2018) identified measures such as initial fixation duration and search efficiency as indicators of map-reading ability. Similarly, Beitlova et al. (2020) noted stark differences between students and teachers in reading school atlases, particularly in interpreting legend scales, leading to divergent problem-solving strategies. Familiarity with map-based tasks, as shown by Havelková and Hanus (2021), improves strategy efficiency over time.
Graph Diagrams and Other Field-Specific Representations
A substantial body of research has focused on reading graphs (Atkins & McNeal, 2018; Bruckner et al., 2020; Harsh et al., 2019; Klein et al., 2019a; Škrabánková et al., 2020; Susac et al., 2018) and working with diagrams (Baluyut & Holme, 2019; Dobesova, 2016; Mozaffari et al., 2016a). Key reading skills the studies focused on include understanding integrated diagram features, frequent integration of diagram components, spatial comparisons, and interpreting slopes and areas. Studies consistently show that as participants gain experience, they pay more attention to contextual elements such as chart titles, labels, variables, and data sources. Experienced students also distribute their attention more evenly across diagrams and review line diagrams more frequently, resulting in better performance. Langendorf et al. (2022) observed that low-performing students focused on fewer diagram elements, while high-performing students transitioned more frequently between diagram parts and other areas of interest (AOIs), leading to superior results (Baluyut & Holme, 2019).
Consistent with these findings, Atkins and McNeal (2018) and Kastens et al. (2016) found that novice learners tend to focus on surface features, such as colour bars, while experienced learners prioritise data and key chart areas. Novick et al. (2012) noted a strong general tendency to read diagrams from left to right, although this pattern is influenced by the task. Moreover, in the context of physics, studies have also explored the role of vectors in guiding students’ attention. For instance, Mozaffari et al. (2021) reported that vector flow shapes saccadic movements, influencing how students process information in diagrams.
Several authors reported findings that could inform the development of targeted pedagogical interventions aimed at addressing the studies’ unflattering results. Hahn and Klein (2023) demonstrated that incorporating sketching techniques positively influenced students’ attention distribution towards critical graph components. Similarly, Becker et al. (2023) highlighted the need for targeted teaching strategies to facilitate the transfer of mathematical skills to physics, leveraging eye tracking and retrospective think-aloud methods to develop adaptive learning systems. In addition, Dobesova (2016) found that task-driven viewing encourages a more systematic approach to diagrams compared to free exploration.
The Use of Multiple Representations
Similarly to the specific approaches used for data visualization in science, studies examining students’ understanding and ability to interpret scientific representations report comparable findings. Studies on multiple representations reveal distinct patterns of use between novices and experts. Mozaffari et al. (2016b) found that novices were more likely to switch between different representations compared to experts. In a similar study, Mozaffari et al. (2018) analysed students’ preferences when solving physics problems using graphs, tables, and vectors. Across all groups, tables and vector representations were favoured over diagrams, a trend further supported by Wu and Liu (2021). When presented with numbers and diagrams, novices showed a preference for numerical data, contrary to the experts’ approach, which prioritised diagrams (Mozaffari et al., 2016a).
The tendency of novices to focus on superficial relationships between representations was noted by Rau and Evenstone (2014), who studied students’ perceptions of graphical molecule representations. Rau et al. (2015) further suggested that frequent switching between representations may not reflect effective integration of conceptually relevant material but rather confusion or surface-level processing.
In chemistry, the interplay of macroscopic, submicroscopic, and symbolic representations is critical (Johnstone, 1991). Hamerská et al. (2024) found that students preferred symbolic representations over submicroscopic ones when balancing chemical equations using an applet, despite the latter simplifying the task. This finding highlights the counterproductive emphasis on symbolic representations in chemistry education. Similarly, Braun et al. (2022) underscored the importance of learner flexibility in drawing productive organic structures and advocated for using eye tracking to characterise drawing processes in STEM disciplines. In another study, Stieff et al. (2011) observed that students performed well on molecular mechanics questions requiring models and diagrams but struggled when tasks required integrating models, diagrams, and equations. Braun et al. (2022) reinforced this by showing that productive molecule drawing involved frequent transitions to relevant visual elements.
The integration of multiple representations also appears to enhance learning in other contexts. She and Chen (2009) demonstrated a correlation between eye fixation duration and learning depth in multimedia presentations on mitosis and meiosis. Similarly, Wu and Liu (2021) reported that students with high prior knowledge made more transitions, focused more on equations, and used graphs or tables depending on the task. In contrast, low prior knowledge students relied predominantly on tables. Hinze et al. (2013a) noted that prior knowledge influenced students’ choice of models, with low-knowledge participants favouring simpler “ball and stick” models that lacked critical information.
In addition, von Reumont and Budke (2020) highlighted the importance of integrating representations in geographic comics, where maps, pictures, and text were combined. Students who frequently switched between maps and other visual elements outperformed their peers on post-tests. Similarly, O’Keefe et al. (2014) found that transitions between simulation elements were indicative of successful learning, as they facilitated the knowledge-building processes required for comprehension.
The study by Appel et al. (2023) lies at the intersection of this category and problem-solving. The authors examined differences in cognitive load across mathematical tasks, chemical tasks, and tasks combining both disciplines. Participants performed best on mathematical tasks, less effectively on chemical tasks, and encountered the greatest difficulty with combined-context tasks. Eye-tracking metrics indicated similar problem-solving approaches across the tasks, with differences attributed to domain-specific challenges.
Design of Representation
Several studies have examined whether students perform better using static or dynamic representations. Chen and Wang (2015) and Chen et al. (2015) investigated learning outcomes from static and dynamic representations of atomic orbitals. Their findings indicated that dynamic 3D visualisations were particularly beneficial for students with low spatial abilities, who also devoted more attention to these representations. Similarly, Slapničar et al. (2020) used tasks involving dynamic 3D animations based on submicroscopic representations and observed that successful students spent more time justifying their choice of the correct representation, particularly in more challenging tasks. However, Tang et al. (2016) found no significant differences in eye movement measures between dynamic animations and static images, suggesting that task context may moderate these effects.
In a study on chemistry problem-solving, Savec et al. (2016) found that the presence of colour in explanatory keys did not influence the time students spent on tasks or working with the key, regardless of its design. Schnotz and Wagner (2018) highlighted the inherent asymmetry between text and images during joint processing. They found text primarily supports the initial construction of a mental model, while images facilitate adaptive elaboration, particularly in task-solving contexts, as evidenced by fixation and transition metrics.
Text and Representations
Chen and She (2020) compared different approaches to learning about electrical circuits, using metaphors, analogies, text-only materials, and text-picture combinations. Their findings showed that analogies facilitated stronger and longer integration processes than metaphors, as they provided a clear one-to-one correspondence between the circuit and water pipes. Additionally, the presence of pictures elicited more integration processes across systems than text-only learning materials. However, Liu and Chuang (2011) observed that textual content often dominates in model-building tasks, suggesting that incorporating more detailed pictures could enhance the perception and use of pictorial information.
Klein et al. (2019a) and Klein et al. (2018) investigated the use of text-diagram combinations in vector analysis problem-solving. Their results demonstrated that students who received cues directing their attention to key elements of the diagram paid more attention to it, made more transitions between text and diagram, and achieved better learning outcomes compared to students who did not receive such cues.
4.3.3 Experiments and Simulations
The integration of simulations, virtual laboratories, and educational games in science education underscores their potential to connect abstract concepts with real-world applications. These tools, through dynamic visualisations and interactive environments, cater to diverse learner needs and foster inquiry-based learning. However, their effectiveness depends on thoughtful design and instructional support. As shown in several studies reviewed in this chapter, simulations and screencasts enhance attention and representation transitions but require structured guidance. Similarly, AR and virtual labs show promise in fostering self-regulated and collaborative learning, though their cognitive demands must align with educational goals. Overall, the studies emphasise the importance of aligning technological tools, instructional design, and learner needs to maximise educational impact.
Simulations
To connect sub-microscopic representations with real objects and their symbolic descriptions, simulations, animations, and applets serve as valuable tools. For instance, Hoyer and Girwidz (2020) examined the effects of training with supportive animations and interactive tasks with feedback. While animations attracted more attention, the shorter saccades they induced did not significantly enhance learning. In contrast, Karafyllidis et al. (2019) observed that experienced applet users fixated on the output after modifying conditions, whereas novices focused on the phenomenon itself, observing its effects.
The effectiveness of simulations has also been evaluated against screencasts in which an instructor directed viewers’ focus (Sweeder et al., 2019). Interestingly, screencasts held students’ attention longer, a finding corroborated by Martinez et al. (2021), who reported that screencasts were more likely to promote transitions between macro and sub-microscopic representations. Similarly, Chiou et al. (2019) observed whether participants followed guidance to complete inquiry-based activities and manipulate variables to achieve correct answers. VandenPlas et al. (2021) found that screencasts with instructor narration improved conceptual understanding, although not always satisfactorily.
Collaborative simulations have also been studied extensively. Liu et al. (2021) found that while collaborative simulations elicited low individual attention, they fostered constructive discourse and effective collaborative learning. Becker et al. (2021) used ET glasses to assess collaborative hands-on experiments, highlighting the critical role of initial partner collaboration. Liu et al. (2022) demonstrated that groups with high functional interdependency paid greater attention to simulations. Similarly, Lämsä et al. (2022) explored collaborative knowledge construction, finding that effective pairs balanced visual attention, integrated verbal and visual cues, and critically evaluated ideas. High-quality interactions featured frequent shifts between generating, explaining, and evaluating ideas, unlike low-quality interactions that relied on incorrect ideas and lacked critical discourse.
These findings underscore the potential of integrating eye-tracking with video data to optimise simulation-based learning environments. Such integration can help students engage more effectively with visual elements, identify misaligned attention, and support real-time instructional interventions.
Educational Games
Visual behaviours and game flow of science game players with high and low conceptual comprehension were investigated by Tsai et al. (2016). High-achievers demonstrated better multi-tasking skills, likely due to superior reading strategies involving graphic icons, labels, and terminological definitions. Similarly, Wang et al. (2022a) found that students with high prior knowledge transitioned more frequently between representations while playing physics educational games. Gauthier et al. (2022) emphasised the critical importance of game design in enhancing student learning. However, game-based learning can sometimes negatively impact emotions (Wu et al., 2014), and in their study, attention did not correlate with learning outcomes, an unexpected finding.
(Virtual) Laboratories
Küchemann et al. (2020) explored how university students understand and apply concepts of rotating frames of reference through a lecture demonstration experiment. Students who successfully transferred their observations to assessments were more confident, which corresponded to shorter dwell times on task-relevant areas compared to less confident students. Chien et al. (2015) compared real and virtual physics labs, finding that students using online apps tended to act without prior planning but made more measurement attempts and demonstrated deeper cognitive processing than in real lab settings.
The importance of instruction in virtual inquiry-based learning was highlighted by van der Graaf et al. (2020). They found that while reading informational texts did not directly correlate with knowledge gain, frequent integration of text and lab activities was associated with better learning outcomes. These findings stress the importance of designing learning experiences that combine procedural knowledge-building with appropriately challenging content.
The advent of augmented reality (AR) has further influenced science education. Thees et al. (2022) compared AR-based head-mounted displays (HMDs) with separate-display setups during laboratory work. Contrary to expectations, HMDs neither reduced extraneous cognitive load nor enhanced learning outcomes. Eye-tracking data revealed that separate-display users aligned their focus more effectively with task-relevant problem-solving questions. The authors concluded that AR’s effectiveness depends on aligning its design with the cognitive demands of specific tasks. Similarly, Syskowski and Huwer (2023) emphasised the need for careful integration of AR into instructional design.
Fleischer et al. (2023) investigated gaze transitions between AR-based sequential scaffolds and physical experiments. Their findings demonstrated the potential of AR scaffolds to enhance self-regulated inquiry-based learning by providing visual guidance that facilitates independent progress without overwhelming cognitive load.
In real-world experiments, Susac et al. (2018) found that students engaged in hands-on activities outperformed those in lecture-based demonstrations during post-tests. Eye-tracking data showed shorter dwell times on multiple-choice patterns, likely due to greater familiarity with the topic, resulting in more confident answers. Nehring and Busch (2018, 2020) examined the impact of chemistry demonstration setups on students’ visual attention, finding that apparatus symmetry and irrelevant objects negatively affected focus.
Finally, Wiebe et al. (2009) studied the effects of virtual experiments with haptic feedback. While eye tracking complemented video analysis, the haptic feedback had minimal impact on conceptual understanding, with students’ attention drawn to the novelty of the device rather than the sensor’s educational value.
Out-of-School Learning
Several papers included in this review aimed to out-of-school settings. Heim and Holt (2022) studied biology students’ eye behaviour in a zoo. Novices paid more attention to the signs than actual animals. This kind of experience seems not only to have stronger emotional responses, but in the case of fieldwork participation, also lead to faster visual information processing (Wang et al., 2021). Krogh-Jespersen et al. (2020) targeted museum exhibitions’ improved curation by enhancing visitors’ awe and curiosity.
4.3.4 Problem-Solving
Eye-tracking research has provided valuable insights into the cognitive processes and strategies employed during problem-solving tasks across various disciplines. The studies introduced below highlighted the interplay between students’ expertise, task complexity, and instructional design in shaping their visual attention and reasoning patterns. Eye tracking revealed not only how students allocate attention across task elements but also how these behaviours predict problem-solving success. By identifying expansive and limiting strategies, gaze patterns, and attention distribution, researchers have uncovered critical differences between novices and experts, as well as variations linked to task design and problem complexity.
Moreover, eye tracking has proven effective in diagnosing students’ reasoning processes, particularly in integrating textual and visual representations, as well as in fostering conceptual change. Studies emphasised the importance of creating instructional environments that guide students’ attention to relevant information while minimising distractions. The ability to triangulate eye-tracking data with other methods, such as think-aloud and retrospective analyses, offers a comprehensive view of problem-solving processes, enabling educators to design more effective, tailored interventions.
This growing body of evidence underscores the potential of eye-tracking not only as a tool for understanding problem-solving but also as a predictor of performance and a driver for innovation in instructional design, particularly in STEM education.
Strategy and Process of Problem-solving
Karch et al. (2019) analysed gaze patterns during students’ multi-representational multiple-choice task solving, finding that most examined a diagram during their initial reading. Those who skipped the diagram early on also failed to fixate on it during the final phase of answering. In chemistry education, Topczewski et al. (2016) studied problem-solving strategies involving NMR spectra, revealing distinct differences in gaze behaviour between experts and novices. Experts concentrated on the correct answer, while novices’ attention was dispersed across all areas of interest. Likewise, Tang et al. (2014) compared strategies among expert groups solving stoichiometry word problems using triangulated gaze and verbal data. More successful students systematically applied dimensional analysis step-by-step, knowing every conversion factor, whereas less-successful students struggled with identifying factors and procedures. Tóthová et al. (2021) and Tóthová and Rusek (2022) conducted similar analyses, combining eye-tracking and retrospective think-aloud methods to distinguish expansive and limiting strategies in periodic table tasks. While students predominantly used expansive strategies, limiting strategies emerged when individual challenges, such as low prior knowledge, arose.
Rosiek and Sajka (2017) explored eye tracking’s diagnostic potential through mechanics tasks to uncover individual problem-solving strategies. Škrabánková et al. (2019) similarly examined periodic table tasks, identifying differences in problem-solving approaches between boys and girls. On another science problem, Klein et al. (2018) investigated vector reading strategies, showing that combining multiple strategies led to the best outcomes. Within the same area, Mozaffari et al. (2020) studied the effect of instructional types on vector field problem-solving, noting that gaze patterns differed based on the strategy used and vector flow orientation.
In contrast to stimulus-specific studies, Schnotz et al. (2014) examined text-picture integration strategies using tasks from biology and geography textbooks. Their findings suggested that texts and pictures play complementary roles, serving distinct functions and requiring different processing strategies for goal-directed knowledge acquisition.
Beyond specific strategies, some studies explored broader cognitive processes in problem-solving. For example, Dogusoy-Taylan and Cagiltay (2014) found that novices displayed higher fixation counts than experts during concept-mapping tasks. Rodemer et al. (2020) observed that advanced students worked more consistently across case comparison tasks in chemistry and were less influenced by varying task features than novices. Advanced students also transitioned between representations more frequently. Similarly, Chen and Yang (2014) analysed spatial science problem-solving, highlighting the critical role of effective attention-guiding strategies in shaping successful outcomes.
Attention Distribution During Problem-solving
In addition to strategy- and process-focused approaches, several studies have explored visual attention during problem-solving through open research questions. Han et al. (2017) analysed students’ attention to answer choices and found that while students focused on naïve answers in the pre-test, they primarily looked at expert answers in the post-test. However, significant focus on naïve choices persisted, indicating conceptual blending during problem-solving. Tsai et al. (2012) similarly observed that successful problem solvers concentrated on relevant factors, whereas unsuccessful ones struggled to decode problems and identify key elements.
In addition, Li et al. (2022) noted that attention patterns can also be influenced by the solver’s perspective. For example, pre-service teachers predicting students’ answers reviewed information in distinct areas. Tóthová and Rusek (2021b) found that students’ eye movement transitions revealed difficulties in understanding assignments and applying given information, which negatively impacted their results.
Finally, Chandran et al. (2024) examined learners’ attentional and cognitive states during online multimedia learning, highlighting the utility of multimodal data for categorising attentional states and linking them to learning outcomes. Their findings underscore the importance of instructional designs that enhance engagement and minimise distractions. Integrating machine learning with multimodal data could enable the development of attention-aware educational technologies that provide real-time feedback and interventions, improving learning efficiency and retention.
ET as a Predictor of Problem-solving
Some studies also investigated the predictive capabilities of the eye-tracking method. For example, Peterson et al. (2015) analysed whether gaze behaviour could predict performance and learning gains in a visual intelligent tutoring system in chemistry. They found that certain fixation-based gaze characteristics were strong predictors of performance but less of learning gains, while pupil diameter had a small effect on learning gains but not on performance. Moreover, Tsai and Wu (2021) examined online information problem solving process of a science problem, finding visual attention directed by students to irrelevant web information significantly and positively predicted their information anxiety but negatively affected their task performance.
Gaze data were also used to predict performance in a computer-based physics test (Chen et al., 2014). On the one hand, the authors reported that mean fixation time and re-reading time in proportion best predicted students’ performance. Mean saccade distance, on the other hand, had the least and negative predictive power for the probability of correctly solving physics problems. Average fixation duration was significant in the study of Zang et al. (2022) for predicting success in problem solving. Another study identified problems with online collaboration (e.g. lack of coordination, misunderstanding partner’s attention), and while solving problems (Hsieh et al., 2019), it also depends on the role of students (e.g. sharing screen) (Lämsä et al., 2022).
Expertise Level in Problem-solving
Another group of studies focused on comparing expertise in problem-solving. Chou and She (2015) examined optic reasoning in physics, comparing science and non-science majors. They found that science majors exhibited longer eye movement patterns, mean fixation durations, and regression durations on relevant areas, reflecting deeper cognitive processing and greater attention to visual arguments.
In analysing problem-solving behaviours in electrical circuit tasks, Rosengrant et al. (2009) observed differences between experts and novices despite similar gaze patterns across individual circuit components. Unlike novices, experts revisited the circuit during task-solving or simplified the circuits, a finding echoed by Ye et al. (2024). Conversely, Tóthová and Rusek (2022) did not observe differences in time spent across areas but attributed successful outcomes to effective use of provided information. Moreover, Škrabánková et al. (2019) revealed cardinal differences in problem-solving processes among gifted boys, while other boys displayed similar strategies when solving periodic table tasks. These findings highlight the influence of expertise on problem-solving and suggest further exploration in reasoning-focused studies.
Reasoning in Problem-solving
Eye-tracking has also been widely applied to analyse scientific reasoning, such as students’ ability to relate molecular structures to infrared spectral properties in chemistry (Cullipher & Sevian, 2015), tackle organic chemistry tasks (Ye et al., 2024), solve periodic table-related tasks (Tóthová et al., 2021), or serve as a metacognitive tool in science problem-solving (Tsai et al., 2019). These studies concluded that fixation sequence analysis offers deeper insights into students’ thought processes, particularly when associating molecular structures with spectroscopic reactions, compared to think-aloud methods. Eye tracking also proved effective in enhancing metacognitive problem-solving strategies.
In addition, Ye et al. (2024) identified four reasoning types: descriptive, relational, simple causal, and mechanistic reasoning. They found that cognitive processes were influenced by task complexity and students’ ability to integrate symbolic and textual information effectively. These findings emphasise the importance of assessing students’ understanding of scientific terminology and dedicating more instructional time to explicit teaching of specialised vocabulary to improve reasoning and problem-solving skills.
Influence of Task Design
Several studies have examined the influence of task complexity, multiple representations, and learning styles on problem-solving, using eye-tracking to gain deeper insights. Tang and Pienta (2012) investigated the impact of problem difficulty and cognitive processes on solving gas law word problems in chemistry. Their findings identified complexity factors that significantly influenced students’ problem-solving abilities. Likewise, in the context of multiple representations, Lindner et al. (2017) observed that students spent less time fixating on incorrect answer choices when text-picture tasks were provided, concluding that the inclusion of images in tests enhanced performance. Regarding learning styles, Kekule (2017) found no strong correlation between a preference for visual learning and fixation-based eye-tracking metrics in physics multiple-choice problems. Finally, Jin and Yu (2019) explored conceptual change using tasks that included misconceptions showing that students who achieved conceptual change focused their visual attention on areas relevant to the scientific concept, while others fixated on areas tied to the misconception.
4.3.5 Video-Based Learning Material
Finally, eye-tracking studies investigating the educational effects of videos have explored various factors influencing learning outcomes, including attention distribution, mind wandering, and the role of virtual agents or teachers’ nonverbal cues. This body of research highlights how videos, enriched with social and cognitive cues, impact students’ focus, comprehension, and engagement across diverse learning contexts. By examining attention patterns, these studies provide valuable insights into designing video-based learning materials that optimise attention, reduce distractions, and enhance self-regulated learning.
Mind Wandering
In Jang et al.’s (2020) study, students were trained to distinguish attention from mind wandering and from attention such as task related thoughts. This was tested on a physics content. The study confirmed several mind wandering signals: pupil size, fixation duration etc., however excluded blink which was not proven to be a reliable marker. Within the same field of study, Hutt et al. (2019) investigated the possibility to use commercial off-the-shelf (COTS) eye trackers to automatically detect mind wandering when students learn on a computer. They also examined attention-aware learning technology to automatically assess mind wandering and reorient students’ attention (Hutt et al., 2021). The studies used biology content and a virtual environment hosted by a virtual character. The study concluded COST eye-trackers are sufficient to detect students’ mind wandering suggesting future of computer-regulated learning.
Attention Distribution
The King’s and Marakan’s (2022) study aimed at video-based learning at early age. Similarly to the text reading (see above), children with higher prior knowledge focused more on relevant pictures.
The Influence of “the Teacher”
Studies have explored how virtual characters and teacher behaviours influence students’ attention, comprehension, and engagement in video-based learning. For instance, research focusing on virtual environments examined students’ attention distribution to a “teacher”, represented by a virtual character, whose face and upper body attracted the most attention, followed by multimedia panels and response boxes. Moon and Ryu (2021) further investigated the effects of social cues (provided by a virtual character) and cognitive cues on students’ learning comprehension in water science video lessons. They found that social cues resulted in shorter eye-dwell times and fewer fixations on pictorial information compared to cognitive cues. Conversely, cognitive cues employing dynamic signals helped students focus better on relevant features than static ones (Rodemer et al., 2020).
The effectiveness of virtual characters was also demonstrated in physics simulations where animated graphics of a virtual character enhanced users’ awareness of essential graphic components, particularly for those in a passive learning state (Matsuura & Shigihara, 2015). Stull et al. (2018) examined the use of transparent and conventional whiteboards in organic chemistry video lessons. Students watching videos with transparent boards were distracted by the teacher, often ignoring gaze guidance, while those using conventional whiteboards followed the cues. Despite these differences in attention, both groups showed similar engagement and learning outcomes, with equivalent attention to the teacher’s direct gaze.
Wiedbusch et al. (2023) highlighted the importance of metacognitive scaffolding and emotion perception in supporting self-regulated learning (SRL). They demonstrated that educational technologies featuring pedagogical agents can enhance learning by aligning agent feedback with students’ emotional and cognitive needs, addressing social-emotional factors such as avoiding embarrassment.
Teacher enthusiasm was also found to play a critical role in multimedia learning environments. Huangfu et al., (2022, 2024) found that students paid greater attention to highly enthusiastic teachers. However, increased enthusiasm raised students’ cognitive load, underscoring the need for balance. The findings suggest that integrating nonverbal teaching cues, such as gestures and facial expressions, can improve engagement and learning outcomes in video-based education.
5 Discussion and Conclusions
The results clearly indicate an increasing trend in the use of ET in science education research, reflecting its growing importance and application within the field (Chen, 2024; Hahn & Klein, 2022; Lai et al., 2013). Comparison with the use of eye-tracking in mathematics education research (Strohmaier et al., 2020) reveals that, although its application in science education research began later, the number of published papers is now comparable. From a researcher’s perspective, this study diverged from the common focus on English-speaking and non-native authors (Lin et al., 2018, 2024) by examining “eye-tracking in science education bastions”. German researchers have established a prominent position in science education research (Lin et al., 2024), particularly dominating ET studies within Europe. Similarly, Taiwan has emerged as a leading contributor among Asian science education researchers. Collaboration across these and other regions could lead to a more comprehensive understanding of the method’s applications and limitations in science education.
With advancements in technology and the increasing affordability of ET equipment—improvements in sampling frequency and reduced technical requirements—eye tracking is expected to become a standard tool for evaluating various educational aspects in the near future. This trend is reflected in the growing number of published papers, with the earliest analysed in this study dating back to 2004. Although ET was applied in mathematical education as early as 1921 (Strohmaier et al., 2020) and appeared in early science education studies (e.g. Hannus & Hyönä, 1999), these works were not published in journals indexed in Web of Science. As the technology evolves, ET is likely to complement traditional assessments, such as tests for reading ability, spatial ability, and problem-solving, alongside other methods like evaluation sheets, interviews, and observations. Additionally, advances in laptop camera capabilities (Wisiecka et al., 2022) may soon enable widespread eye movement detection, paving the way for machine learning applications, including adaptive learning materials and intelligent testing systems. In this respect, researchers should also explore the implications of ET’s accessibility and its ethical considerations, as this question is gaining on urgency with every paper published.
In terms of disciplinary focus, 16% of the analysed papers addressed science education in general. Interestingly, despite biology being a field where many phenomena are easily observable to the naked eye, ET has not been frequently utilised. This could indicate that biology education researchers rely on alternative tools to evaluate student observations or that the field has not yet prioritised investigating visual attention. In contrast, physics and chemistry, which heavily employ sub-microscopic and symbolic representations (Johnstone, 1991), have garnered significantly more attention from ET researchers. This is perhaps the reason there were literature review papers focusing on the use of ET in physics (Hahn & Klein, 2022) and chemistry (Chen, 2024) education research published recently.
The limited application of ET in biology education indicates a need to investigate why this field has not fully embraced the technology. Researchers could explore whether existing tools sufficiently address biology-specific learning needs or if ET could complement these methods to offer new insights. On the other hand, the higher adoption of ET in physics and chemistry may provide biology education researchers examples of applicable methodologies especially in fields reliant on sub-microscopic and symbolic representations. Educators and researchers should leverage ET to design instructional materials that better address the challenges students face when interpreting complex visual representations.
From the perspective of educational levels, researchers using eye tracking often prefer university students as participants (over half of the studies) probably due to technical and organisational challenges associated with measuring (school) children’s eye movements (Ishimaru et al., 2016), the ease of acquiring samples, and the opportunity to investigate more complex scientific phenomena. This preference aligns with trends observed in other educational research fields (Alemdag & Cagiltay, 2018; Strohmaier et al., 2020). However, the expansion of eye tracking to lower educational levels requires the development of methodologies tailored to studying younger learners. Recent technological advancements, such as portable ET devices that do not require sitting at a fixed monitor and the creation of less intrusive ET goggles, are paving the way for more effective studies involving children. Expanding studies to include younger participants will offer more comprehensive insights into developmental differences in visual attention and learning processes further education can build upon. Despite the obvious challenges, researchers should prioritise developing methodologies that ensure accuracy while minimising discomfort for younger participants.
As far as the research methodologies are concerned, sample size is one of the issues eye-tracking studies need to deal with. On one hand, there is a need to be able to generalise the findings, and on the other, there is a considerable time difficulty, especially when ET is being followed by additional qualitative methods. The sample size median was 36 participants. The sample size is higher than reported in mathematics education (Strohmaier et al., 2020) but the variety of sample size must be taken into account. The study which used 663 participants (Yun, 2020) is a clear example of the stream focused on as many data as possible from students’ vision—in this case scientific terms reading comprehension of students with high and low level of comprehension. This review also aims to initiate a serious discussion about the optimal sample size for ET studies. Since the method is quite new, it is understandable some reviewers keep reserved opinion to the data generalisability. Excessively large samples risk overlooking valuable data, while eye-tracking studies with too few participants lack the robustness needed to draw meaningful conclusions. The research design needs to be taken into account when calculating research sample. Between-subject and mixed designs are typically more demanding in this aspect (see Popelka, 2018), presented review results corresponded with this assumption. The authors suggest a via media to be proposed for certain research types, especially when ET is complemented with other (qualitative) additional methods. While studies focused on analysing well-balanced distractors in tests (Hinze et al., 2013a), experimental setups (Nehring & Busch, 2020), or web-based environment design (Liu et al., 2024) may rely solely on eye-tracking (ET) and large student samples, research on problem-solving (Lämsä et al., 2022), reasoning (Tóthová & Rusek, 2022), or the use of representational levels (Locatelli et al., 2024) often requires integrating ET data with additional sources, such as think-aloud protocols or interviews. Furthermore, study participants are typically selected based on pre-test results, which enhances the validity of the data. Moreover, the authors of this paper highlight these considerations to challenge overly rigid expectations from some reviewers and editorial boards, which may not account for the nuanced methodological requirements of different research contexts.
A detailed analysis of the research methodologies also revealed problem in the use of ET metrics’ names (e.g. fixation duration or reading time, sum of the fixation in the area, time spent in area). The promotion of ET methodologies would greatly benefit from standardised reporting of methodological details. Many studies fail to provide information on procedures, calibration protocols, or participant drop-outs and their underlying reasons. Establishing standardised guidelines would assist novice researchers in addressing methodological challenges more efficiently and facilitate the preparation of robust meta-analyses.
Regarding the science education topics for which ET has been applied, the two recent reviews on the physics and chemistry education (Chen, 2024; Hahn & Klein, 2022) shared several categories, including problem-solving, experiments, computer-based/assisted learning, and representations. Hahn and Klein (2022) further categorised the examined topics into student assessment and problem-solving, knowledge construction, and laboratory work—categories that also emerged inductively when science education research papers were reviewed.
As for the findings, the role of visual attention in knowledge construction emphasised its importance in integrating prior knowledge with new content. Eye-tracking studies offered insights into how students read scientific texts including illustrations and multiple representations. While the latter represents a discipline unique to science education, there are numerous parallels with other fields when it comes to the effective integration of illustrations in learning materials. Educators can use these insights to design visual cues that enhance conceptual understanding.
Eye tracking has provided deeper insights into students’ reading processes. Dynamic research on science textbooks (see Vojíř & Rusek, 2019) is soon likely to take a new form in the near future, as traditional research questions can now be addressed directly through the “eyes of students”. This shift is already evident for instance in traditional evaluations of text difficulty (Rusek & Vojíř, 2019) increasingly being complemented by eye-tracking research (Jian, 2022). In addition to identifying text elements that increase cognitive load (e.g. Copeland et al., 2015) and monitoring students’ reading strategies (e.g. Liu, 2014; Schutte, 2023), it has revealed patterns of behaviour when non-textual components are included (e.g. Meyer & Pietzner, 2022). With the advent of “Textbook Analysis 3.0”, publishers and authors are on the verge of creating adaptive textbooks that adjust to readers’ levels, styles, preferences, and moods, paving the way for significantly more efficient learning materials (Bottos & Balasingam, 2019) which already appeared also in science education (Ishimaru et al., 2016).
The ability to use representations, which is closely linked to science text reading, highlights the need for greater emphasis on this aspect of science instruction. For example, in using maps (e.g. Dong et al., 2018; Havelková & Hanus, 2021) or organic chemistry formulas (e.g. Rodemer et al., 2020), research has shown spatial training should include tailored tasks to enhance specific visual processing behaviours and account for differences in task complexity and student abilities.
Similarly, a specific area of graphs showed several improvements for science instruction. For example, incorporating sketching techniques improves attention to critical components (Hahn & Klein, 2023), while task-driven viewing encourages systematic approaches to diagrams (Dobesova, 2016). Research also showed teaching strategies should guide students to focus on conceptual elements and employ task-driven techniques such as sketching to enhance performance. Greater attention, however, must be directed towards evaluating adapted instruction.
Research on scientific representations has revealed that this area is often neglected in certain fields (e.g. Hamerská et al., 2024). Instruction should, therefore, explicitly address the teaching of integration strategies for multiple representations to help students move beyond surface-level processing (Mozaffari et al., 2016b; Rau et al., 2015). Additionally, the design and use of educational representations should be carefully aligned with learners’ abilities and task demands, striking a balance between static and dynamic visuals to optimise cognitive processing (Chen et al., 2015; Slapničar et al., 2020).
In context science reading context, findings from other fields also offer some perspective on the role of cognitive, affective, metacognitive, and motivational (CAMM) processes to scaffold self-regulated learning in online environments (Azevedo et al., 2022). Research thus informs effective machine learning to make the shift from “black-box” to “white-box” approach (Sharma et al., 2019) stressing the importance of attention as a key factor in achieving performance (e.g. Sharma et al., 2016) and emotions which help explain the learning process (Pekrun, 2006). Eye tracking has also proven instrumental in revealing the cognitive load students experience during problem-solving (Appel et al., 2023; Hahn & Klein, 2023; Karch et al., 2019; Susac et al., 2019). While the eye-tracking metrics used to measure cognitive load have certain limitations, several studies have successfully utilised them to provide insights into the factors influencing students’ performance. Various metrics have been employed in the reviewed studies to measure cognitive load during learning and problem-solving tasks.
In the analysed studies, laboratory work stands out as a hands-on category where eye-tracking aids in understanding interactions with experimental setups, including reading instruments and aligning apparatus. Also in this area, ET data could improve the design of safer and more effective lab experiences. Based on the findings, laboratory instructors should prioritise the use of cues to effectively guide students’ attention (e.g. Becker et al., 2021; Susac et al., 2021), an element often overlooked in traditional “cookbook” laboratory exercises. In this regard, virtual lab environments could serve as a valuable resource for informing real (hands-on) instruction (Fleischer et al., 2023; Sáiz-Manzanares et al., 2023), as mapping students’ attention is methodologically more straightforward in virtual settings due to the possibility to limit disturbing factors of real laboratory environment.
Research using eye tracking (ET) has also contributed to the debate on the effectiveness of experimental activities in science education (e.g. Hofstein & Lunetta, 2004; Osborne, 2015; Rusek et al., 2022). Findings suggest that certain aspects are better developed in virtual environments, while hands-on settings are most effective for others (Chien et al., 2015).
Assessment and problem-solving, as intertwined areas, benefit from eye tracking’s ability to reveal real-time cognitive processes, such as working with representations, interpreting diagrams or decoding test questions. Eye tracking could enhance test validity by aligning tasks with cognitive demands to better fit students’ needs. This also offers a possibility to inform educational standards (Jarodzka et al., 2017).
Given the increasing shift from in-person to remote learning, it is unsurprising that many studies have focused on video lessons. A significant challenge identified in this context is mind-wandering, which is considerably more prevalent in remote learning than in traditional in-person settings (cf. Cotton et al., 2023). Jang et al. (2020) and Hutt et al., (2019, 2021) investigated this phenomenon, demonstrating the potential of ET metrics, such as pupil size and fixation duration (excluding blinks), for the automatic detection of mind-wandering in computer-based learning environments. Similarly to the adaptive or intelligent textbooks, future educational tools should integrate attention-aware systems to monitor and manage cognitive engagement, particularly in virtual settings, leveraging cost-effective commercial off-the-shelf (COTS) eye-tracking technology (see Hutt et al., 2019).
When designing video materials, established principles (Brame, 2016; Fyfield et al., 2022) have been further validated by ET studies. For instance, ET-supported research has reinforced the importance of signalling cues (Moon & Ryu, 2021) and adapting content to learners’ needs (King & Markant, 2022). Additionally, ET studies have highlighted the influence of the instructor’s placement and enthusiasm on student engagement, both of which should be carefully considered when designing educational videos (Huangfu et al., 2022, 2024; Stull et al., 2018).
These findings could be a springboard for developing cross-disciplinary tools that improve representational literacy across multiple subjects as they underscore the transformative potential of eye tracking in advancing educational research and practice.
6 Limitations
Despite the comprehensive scope of this systematic review, several limitations must be acknowledged. First, the selection of studies was limited to those indexed in the Web of Science Core Collection, potentially omitting relevant research from other databases or grey literature. The database was chosen due to its rigorous indexing standards, ensuring the inclusion of high-quality, peer-reviewed research. Expanding to other sources, while valuable, would have significantly broadened the scope, potentially reducing the focus and feasibility of the review. Second, the review primarily focuses on research published in English, which may exclude significant contributions from non-English sources. The focus on English-language research aligns with the accessibility of the literature to a global audience and the predominance of English in scientific publishing. Including non-English studies would have required additional resources for translation, potentially delaying the review process.
Finally, a possible limitation is the reliance of many studies on small, often convenience-based samples, which may reduce the generalisability of findings to broader educational contexts. This reflects practical constraints in eye-tracking research, such as the high cost of equipment and the complexity of data collection. The review acknowledges this limitation to highlight the need for larger and more diverse samples in future studies.
Future reviews could address these limitations by adopting meta-analytical approaches to systematically quantify the effects of visual attention on learning outcomes.
Data Availability
The data is available upon request.
Notes
-
Science = science + more than one subject (e.g. biology + geography), Biology = biology + environmental studies, Geography = geography + earth science.
-
This refers to the final sample size (after some participants exclusions).
-
For transparency’s sake, the metrics were associated when time or percentage was used (for example time fixation duration and percentual TFD).
-
In this review, saccades and inter-scannings are presented as one metric, as some authors (e.g. Stieff et al., 2011) do not divide those categories.
References
-
Alemdag, E., & Cagiltay, K. (2018). A systematic review of eye tracking research on multimedia learning. Computers & Education, 125, 413–428. https://doi.org/10.1016/j.compedu.2018.06.023
-
Altan, T., & Cagiltay, K. (2022). An eye tracking based investigation of multimedia learning design in science education textbooks. Educational Technology & Society, 25(2), 48–61. https://www.jstor.org/stable/48660123
-
Anagün, ŞS., & İşcen, C. F. (2010). Pre-service teachers’ perceptions and preferences about visualization. Procedia-Social and Behavioral Sciences, 2(2), 2227–2232. https://doi.org/10.1016/j.sbspro.2010.03.313
-
Appel, T., Kärcher, K., & Körner, H.-D. (2023). Investigating cognitive load for tasks with mathematics and chemistry context through eye tracking. Proceedings of the 2023 Symposium on Eye Tracking Research and Applications, Article 82. https://doi.org/10.1145/3588015.3589199
-
Ariasi, N., Hyona, J., Kaakinen, J. K., & Mason, L. (2017). An eye-movement analysis of the refutation effect in reading science text. Journal of Computer Assisted Learning, 33(3), 202–221. https://doi.org/10.1111/jcal.12151
-
Ariasi, N., & Mason, L. (2011). Uncovering the effect of text structure in learning from a science text: An eye-tracking study. Instructional Science, 39(5), 581–601. https://doi.org/10.1007/s11251-010-9142-5
-
Atkins, R. M., & McNeal, K. S. (2018). Exploring differences among student populations during climate graph reading tasks: An eye tracking study. Journal of Astronomy and Earth Sciences Education, 5(2), 85–114. https://doi.org/10.19030/jaese.v5i2.10219
-
Azevedo, R., Bouchet, F., Duffy, M., Harley, J., Taub, M., Trevors, G., Cloude, E., Dever, D., Wiedbusch, M., Wortha, F., & Cerezo, R. (2022). Lessons learned and future directions of MetaTutor: Leveraging multichannel data to scaffold self-regulated learning with an intelligent tutoring system. Frontiers in Psychology, 13. https://doi.org/10.3389/fpsyg.2022.813632
-
Baluyut, J. Y., & Holme, T. A. (2019). Eye tracking student strategies for solving stoichiometry problems involving particulate nature of matter diagrams. Chemistry Teacher International, 1(1). https://doi.org/10.1515/cti-2018-0003
-
Beach, P., & McConnel, J. (2019). Eye tracking methodology for studying teacher learning: A review of the research. International Journal of Research & Method in Education, 42(5), 485–501. https://doi.org/10.1080/1743727X.2018.1496415
-
Becker, S., Knippertz, L., Ruzika, S., & Kuhn, J. (2023). Persistence, context, and visual strategy of graph understanding: Gaze patterns reveal student difficulties in interpreting graphs. Physical Review Physics Education Research, 19(2), 020142. https://doi.org/10.1103/PhysRevPhysEducRes.19.020142
-
Becker, S., Mukhametov, S., Pawels, P., & Kuhn, J. (2021). Using mobile eye tracking to capture joint visual attention in collaborative experimentation. Physics Education Research Conference 2021 Proceedings,
-
Beitlova, M., Popelka, S., & Vozenilek, V. (2020). Differences in thematic map reading by students and their geography teacher. ISPRS International Journal of Geo-Information, 9(9), 492. https://www.mdpi.com/2220-9964/9/9/492
-
Blonder, R., & Mamlok-Naaman, R. (2019). Factors affecting the study of chemistry in different countries around the world: Findings from an international survey. Israel Journal of Chemistry, 59(6–7), 625–634. https://doi.org/10.1002/ijch.201800100
-
Bottos, S., & Balasingam, B. (2019). An approach to track reading progression using eye-gaze fixation points. ArXiv, abs/1902.03322.
-
Brame, C. J. (2016). Effective educational videos: Principles and guidelines for maximizing student learning from video content. CBE—Life Sciences Education, 15(4), es6. https://doi.org/10.1187/cbe.16-03-0125
-
Braun, I., Langner, A., & Graulich, N. (2022). Let’s draw molecules: Students’ sequential drawing processes of resonance structures in organic chemistry. Frontiers in Education, 7. https://doi.org/10.3389/feduc.2022.1055280
-
Bruckner, S., Zlatkin-Troitschanskaia, O., Kuchemann, S., Klein, P., & Kuhn, J. (2020). Changes in students’ understanding of and visual attention on digitally represented graphs across two domains in higher education: A postreplication study. Frontiers in Psychology, 11, Article 2090. https://doi.org/10.3389/fpsyg.2020.02090
-
Catrysse, L., Chauliac, M., Donche, V., & Gijbels, D. (2022). Keeping an eye on the refutation effect: The role of prior knowledge and text-based interest on attention allocation. Discourse Processes, 59(10), 745–770. https://doi.org/10.1080/0163853x.2022.2142459
-
Cipkova, E., Karolcik, S., Sladkova, K., & Usakova, K. (2018). What is the level of scientific literacy among geography students studying bachelor’s studies in natural sciences? International Research in Geographical and Environmental Education, 27(4), 295–310. https://doi.org/10.1080/10382046.2017.1389044
-
Copeland, L., Gedeon, T., & Caldwell, S. (2015, 19–21 Oct. 2015). Effects of text difficulty and readers on predicting reading comprehension from eye movements. 2015 6th IEEE International Conference on Cognitive Infocommunications (CogInfoCom),
-
Cotton, K., Sandry, J., & Ricker, T. J. (2023). The effects of mind-wandering, cognitive load, and task engagement on working memory performance in remote online experiments (Vol. 70). Hogrefe Publishing. https://doi.org/10.1027/1618-3169/a000599
-
Cullipher, S., & Sevian, H. (2015). Atoms versus bonds: How students look at spectra. Journal of Chemical Education, 92(12), 1996–2005. https://doi.org/10.1021/acs.jchemed.5b00529
-
Dever, D. A., Wiedbusch, M., spsampsps Azevedo, R. (2019, 2019//). Learners’ gaze behaviors and metacognitive judgments with an agent-based multimedia environment. Artificial Intelligence in Education, Cham.
-
Dobesova, Z. (2016). Student reading strategies of GIS workflow diagrams.Advances in Social Science Education and Humanities Research [Proceedings of 2016 2nd international conference on humanities and social science research (ichssr 2016)]. 2nd International Conference on Humanities and Social Science Research (ICHSSR), Singapore, Singapore.
-
Dogusoy-Taylan, B., & Cagiltay, K. (2014). Cognitive analysis of experts’ and novices’ concept mapping processes: An eye tracking study. Computers in Human Behavior, 36, 82–93. https://doi.org/10.1016/j.chb.2014.03.036
-
Dong, W. H., Jiang, Y. H., Zheng, L. Y., Liu, B., & Meng, L. Q. (2018). Assessing map-reading skills using eye tracking and Bayesian structural equation modelling. Sustainability, 10(9), Article 3050. https://doi.org/10.3390/su10093050
-
Drexler, M., Drexler, D., & Sladek, P. (2018). Eye-tracking as a tool for measuring students’ attention when working with physics textboks. Edulearn18: 10th International Conference on Education and New Learning Technologies, 9219–9228.
-
Drexler, M., Drexler, D., Válek, J., & Sládek, P. (2019). Perception of the layout of study texts by a teacher. Proceedings of INTED2019 Conference, 3791–3799.
-
Fleischer, T., Deibl, I., Moser, S., Strahl, A., Maier, S., & Zumbach, J. (2023). Mobile eye tracking during experimenting with digital scaffolding—Gaze shifts between augmented reality and experiment during zinc iodide electrolysis set-up. Education Sciences, 13(2), 170. https://www.mdpi.com/2227-7102/13/2/170
-
Forestier, K., & Crossley, M. (2015). International education policy transfer – Borrowing both ways: The Hong Kong and England experience. Compare: A Journal of Comparative and International Education, 45(5), 664–685. https://doi.org/10.1080/03057925.2014.928508
-
Forsthuber, B., Motiejunaite, A., & de Almeida Coutinho, A. S. (2011). Science Education in Europe: National Policies, Practices and Research. EACEA P9 Eurydice.
-
Fyfield, M., Henderson, M., & Phillips, M. (2022). Improving instructional video design: A systematic review. Australasian Journal of Educational Technology, 38(3), 155–183. https://doi.org/10.14742/ajet.7296
-
Gauthier, A., Porayska-Pomsta, K., Dumontheil, I., Mayer, S., & Mareschal, D. (2022). Manipulating interface design features affects children’s stop-and-think behaviours in a counterintuitive-problem game. Acm Transactions on Computer-Human Interaction, 29(2), Article 12. https://doi.org/10.1145/3485168
-
Gegenfurtner, A., Lehtinen, E., & Säljö, R. (2011). Expertise differences in the comprehension of visualizations: A meta-analysis of eye-tracking research in professional domains. Educational Psychology Review, 23, 523–552. https://doi.org/10.1007/s10648-011-9174-7
-
Gilbert, J. K. (2010). The role of visual representations in the learning and teaching of science: An introduction. Asia-Pacific Forum on Science Learning & Teaching, 11(1). https://eduhk.hk/apfslt/download/v11_issue1_files/foreword.pdf
-
Hahn, L., & Klein, P. (2022). Eye tracking in physics education research: A systematic literature review. Physical Review Physics Education Research, 18(1), 013102. https://doi.org/10.1103/PhysRevPhysEducRes.18.013102
-
Hahn, L., & Klein, P. (2023). Analysis of eye movements to study drawing in the context of vector fields. Frontiers in Education, 8. https://doi.org/10.3389/feduc.2023.1162281
-
Hamerská, L., Matěcha, T., Tóthová, M., & Rusek, M. (2024). Between symbols and particles: Investigating the complexity of learning chemical equations. Education Sciences, 14(6), 570. https://www.mdpi.com/2227-7102/14/6/570
-
Han, J., Chen, L., Fu, Z., Fritchman, J., & Bao, L. (2017). Eye-tracking of visual attention in web-based assessment using the Force Concept Inventory. European Journal of Physics, 38(4), Article 045702. https://doi.org/10.1088/1361-6404/aa6c49
-
Hannus, M., & Hyönä, J. (1999). Utilization of illustrations during learning of science textbook passages among low- and high-ability children. Contemporary Educational Psychology, 24(2), 95–123. https://doi.org/10.1006/ceps.1998.0987
-
Harsh, J. A., Campillo, M., Murray, C., Myers, C., Nguyen, J., & Maltese, A. V. (2019). “Seeing” data like an expert: An eye-tracking study using graphical data representations. Cbe-Life Sciences Education, 18(3), 12. https://doi.org/10.1187/cbe.18-06-0102
-
Havelková, L., & Hanus, M. (2021). Upper-secondary students’ strategies for spatial tasks. Journal of Geography, 120(5), 176–190. https://doi.org/10.1080/00221341.2021.1981979
-
Heim, A. B., & Holt, E. A. (2022). Staring at signs: Biology undergraduates pay attention to signs more often than animals at the zoo. Curator-the Museum Journal, 65(4), 795–815. https://doi.org/10.1111/cura.12480
-
Hellenbrand, J., Mayer, R. E., Opfermann, M., Schmeck, A., & Leutner, D. (2019). How generative drawing affects the learning process: An eye-tracking analysis. Applied Cognitive Psychology, 33(6), 1147–1164. https://doi.org/10.1002/acp.3559
-
Hild, P., Metzger, S., & Parchmann, I. (2018). Assessing and fostering students’ scientific literacy in doing comparative investigation tasks. Chemkon, 25(3), 90–97. https://doi.org/10.1002/ckon.201810322
-
Hinze, S. R., Rapp, D. N., Williamson, V. M., Shultz, M. J., Deslongchamps, G., & Williamson, K. C. (2013a). Beyond ball-and-stick: Students’ processing of novel STEM visualizations. Learning and Instruction, 26, 12–21. https://doi.org/10.1016/j.learninstruc.2012.12.002
-
Hinze, S. R., Williamson, V. M., Shultz, M. J., Williamson, K. C., Deslongchamps, G., & Rapp, D. N. (2013b). When do spatial abilities support student comprehension of STEM visualizations? Cognitive Processing, 14(2), 129–142. https://doi.org/10.1007/s10339-013-0539-3
-
Ho, H. N. J., Tsai, M.-J., Wang, C.-Y., & Tsai, C.-C. (2014). Prior knowledge and online inquiry-based science reading: Evidence from eye tracking. International Journal of Science and Mathematics Education, 12(3), 525–554. https://doi.org/10.1007/s10763-013-9489-6
-
Hofstein, A., & Lunetta, V. N. (2004). The laboratory in science education: Foundations for the twenty-first century. Science Education, 88(1), 28–54. https://doi.org/10.1002/sce.10106
-
Holmqvist, K., Nyström, M., Andersson, R., Dewhurst, R., Jarodzka, H., & Van de Weijer, J. (2011). Eye tracking: A comprehensive guide to methods and measures. OUP Oxford.
-
Hoyer, C., & Girwidz, R. (2020). Animation and interactivity in computer-based physics experiments to support the documentation of measured vector quantities in diagrams: An eye tracking study. Physical Review Physics Education Research, 16(2), 020124. https://doi.org/10.1103/PhysRevPhysEducRes.16.020124
-
Hsieh, I. C., Liu, C. C., Tsai, M. J., Wen, C. T., Chang, M. H., Chiang, S. H. F., spsampsps Chang, C. J. (2019). The analysis of collaborative science learning with simulations through dual eye-tracking techniques.Lecture Notes in Computer Science [Collaboration technologies and social computing (criwg+collabtech 2019)]. 25th International Conference on Collaboration Technologies and Social Computing (CRIWG+CollabTech), Kyoto, JAPAN.
-
Hu, Y., Wu, B., & Gu, X. (2017). An eye tracking study of high- and low-performing students in solving interactive and analytical problems. Journal of Educational Technology & Society, 20(4), 300–311. http://www.jstor.org/stable/26229225
-
Huangfu, Q., Li, H., Ban, Y. Y., & He, J. M. (2024). An eye-tracking study on the effects of displayed teacher enthusiasm on students’ learning procedural knowledge of chemistry in video lectures. Journal of Chemical Education, 101(2), 259–269. https://doi.org/10.1021/acs.jchemed.3c00498
-
Huangfu, Q., Li, H., Tang, S., Wang, J., Liu, Q., & Chen, G. (2022). How teacher enthusiasm affects students’ learning of chemistry declarative knowledge in video lectures. Chemistry Education Research and Practice. https://doi.org/10.1039/D2RP00095D
-
Hung, Y.-N. (2014). “What are you looking at?” An eye-movement exploration in science text reading. International Journal of Science and Mathematics Education, 12(2), 241–260. https://doi.org/10.1007/s10763-013-9406-z
-
Hutt, S., Krasich, K., Brockmole, J. R., D’Mello, S. K., & Assoc Comp, M. (2021). Breaking out of the lab: Mitigating mind wandering with gaze-based attention-aware technology in classrooms. [Chi ’21: Proceedings of the 2021 chi conference on human factors in computing systems]. CHI Conference on Human Factors in Computing Systems, Electr Network.
-
Hutt, S., Krasich, K., Mills, C., Bosch, N., White, S., Brockmole, J. R., & D’Mello, S. K. (2019). Automated gaze-based mind wandering detection during computerized learning in classrooms. User Modeling and User-Adapted Interaction, 29(4), 821–867. https://doi.org/10.1007/s11257-019-09228-5
-
Chandran, P., Huang, Y., Munsell, J., Howatt, B., Wallace, B., Wilson, L., D’Mello, S. K., Hoai, M., Rebello, N. S., & Loschky, L. C. (2024). Characterizing learners’ complex attentional states during online multimedia learning using eye-tracking, egocentric camera, webcam, and retrospective recalls. Proceedings of the 2024 Symposium on Eye Tracking Research and Applications.
-
Charness, G., Gneezy, U., & Kuhn, M. A. (2012). Experimental methods: Between-subject and within-subject design. Journal of Economic Behavior & Organization, 81(1), 1–8. https://doi.org/10.1016/j.jebo.2011.08.009
-
Chen, C. P., & Wang, C. H. (2015). Employing augmented-reality-embedded instruction to disperse the imparities of individual differences in earth science learning. Journal of Science Education and Technology, 24(6), 835–847. https://doi.org/10.1007/s10956-015-9567-3
-
Chen, S.-C., Hsiao, M.-S., & She, H.-C. (2015). The effects of static versus dynamic 3D representations on 10th grade students’ atomic orbital mental model construction: Evidence from eye movement behaviors. Computers in Human Behavior, 53, 169–180. https://doi.org/10.1016/j.chb.2015.07.003
-
Chen, S. C., & She, H. C. (2020). Effects of analogical learning approaches and presentation modalities on ninth graders’ learning outcome and eye movements: A preliminary study. Journal of Science Education and Technology, 29(4), 547–560. https://doi.org/10.1007/s10956-020-09835-7
-
Chen, S. C., She, H. C., Chuang, M. H., Wu, J. Y., Tsai, J. L., & Jung, T. P. (2014). Eye movements predict students’ computer-based assessment performance of physics concepts in different presentation modalities. Computers & Education, 74, 61–72. https://doi.org/10.1016/j.compedu.2013.12.012
-
Chen, S. S. (2024). The application of eye-tracking technology in chemistry education research: A systematic review. Research in Science & Technological Education, 20. https://doi.org/10.1080/02635143.2024.2435343
-
Chen, Y. C., & Yang, F. Y. (2014). Probing the relationship between process of spatial problems solving and science learning: An eye tracking approach. International Journal of Science and Mathematics Education, 12(3), 579–603. https://doi.org/10.1007/s10763-013-9504-y
-
Cheng, C. H., & Yang, F. Y. (2022). Analyzing visual attention during TAP learning and the effect of epistemic beliefs on the understanding of argument components. International Journal of Science Education, 44(8), 1336–1355. https://doi.org/10.1080/09500693.2022.2076950
-
Chien, K.-P., Tsai, C.-Y., Chen, H.-L., Chang, W.-H., & Chen, S. (2015). Learning differences and eye fixation patterns in virtual and physical science laboratories. Computers & Education, 82, 191–201. https://doi.org/10.1016/j.compedu.2014.11.023
-
Chiou, G.-L., Hsu, C.-Y., & Tsai, M.-J. (2019). Exploring how students interact with guidance in a physics simulation: evidence from eye-movement and log data analyses. Interactive Learning Environments, 1–14. https://doi.org/10.1080/10494820.2019.1664596
-
Choi, H., Yang, I., Kim, S., & Lim, S. (2023). Effects of learner-centered interventions in science learning: Comparing eye movement in eye movement modeling examples and prompting. Journal of Baltic Science Education, 22(4), 579–599. https://doi.org/10.33225/jbse/23.22.579
-
Chou, W. C., & She, H. C. (2015). Explore the eye movement regarding the cognitive process of online optic reasoning learning.IEEE International Conference on Advanced Learning Technologies [15th ieee international conference on advanced learning technologies (icalt 2015)]. 15th IEEE International Conference on Advanced Learning Technologies (ICALT), Hualien, TAIWAN.
-
Chuang, H. H., & Liu, H. C. (2012). Effects of different multimedia presentations on viewers’ information-processing activities measured by eye-tracking technology. Journal of Science Education and Technology, 21(2), 276–286. https://doi.org/10.1007/s10956-011-9316-1
-
Ishimaru, S., Bukhari, S. S., Heisel, C., Kuhn, J., Dengel, A., & Assoc Comp, M. (2016). Towards an Intelligent Textbook: Eye Gaze Based Attention Extraction on Materials for Learning and Instruction in Physics. https://doi.org/10.1145/2968219.2968566
-
Ishimaru, S., Jacob, S., Roy, A., Bukhari, S. S., Heisel, C., Großmann, N., Thees, M., Kuhn, J., & Dengel, A. (2017). Cognitive state measurement on learning materials by utilizing eye tracker and thermal camera. 2017 14th IAPR International Conference on Document Analysis and Recognition (ICDAR), 08(32–36.
-
Jang, D., Yang, I., & Kim, S. (2020). Detecting mind-wandering from eye movement and oculomotor data during learning video lecture. Education Sciences, 10(3), 51. https://www.mdpi.com/2227-7102/10/3/51
-
Jarodzka, H., Holmqvist, K., & Gruber, H. (2017). Eye tracking in educational science: Theoretical frameworks and research agendas. Journal of Eye Movement Research, 10(1), Article 3. https://doi.org/10.16910/jemr.10.1.3
-
Jian, Y.-C. (2016). Fourth graders’ cognitive processes and learning strategies for reading illustrated biology texts: Eye movement measurements. Reading Research Quarterly, 51(1), 93–109. https://doi.org/10.1002/rrq.125
-
Jian, Y.-C. (2017). Eye-movement patterns and reader characteristics of students with good and poor performance when reading scientific text with diagrams. Reading and Writing: An Interdisciplinary Journal, 30(7), 1447–1472. https://doi.org/10.1007/s11145-017-9732-6
-
Jian, Y.-C. (2018). Reading instructions influence cognitive processes of illustrated text reading not subject perception: An eye-tracking study. Frontiers in Psychology, 9(2263). https://doi.org/10.3389/fpsyg.2018.02263
-
Jian, Y.-C., & Ko, H. (2017). Influences of text difficulty and reading ability on learning illustrated science texts for children: An eye movement study. Computers & Education, 113, 263–279.
-
Jian, Y. C. (2019). Reading instructions facilitate signaling effect on science text for young readers: An eye-movement study. International Journal of Science and Mathematics Education, 17(3), 503–522. https://doi.org/10.1007/s10763-018-9878-y
-
Jian, Y. C. (2021). The immediate and delayed effects of text-diagram reading instruction on reading comprehension and learning processes: Evidence from eye movements. Reading and Writing, 34(3), 727–752. https://doi.org/10.1007/s11145-020-10089-3
-
Jian, Y. C. (2022). Influence of science text reading difficulty and hands-on manipulation on science learning: An eye-tracking study. Journal of Research in Science Teaching, 59(3), 358–382. https://doi.org/10.1002/tea.21731
-
Jian, Y. C., Chen, M. L., & Ko, H. w. (2013). Context effects in processing of Chinese academic words: An eye‐tracking investigation. Reading Research Quarterly, 48(4), 403–413. http://www.jstor.org/stable/43497163
-
Jin, L. P., & Yu, D. C. (2019). Characteristics of visual attention for the assessment of conceptual change: An eye-tracking study. [2019 10th international conference on e-education, e-business, e-management and e-learning (ic4e 2019)]. 10th International Conference on E-Education, E-Business, E-Management and E-Learning (IC4E), Waseda Univ, Tokyo, JAPAN.
-
Johnstone, A. H. (1991). Why is science difficult to learn? Things are seldom what they seem. Journal of Computer Assisted Learning, 7(2), 75–83. https://doi.org/10.1111/j.1365-2729.1991.tb00230.x
-
Just, M. A., & Carpenter, P. A. (1976). Eye fixations and cognitive processes. Cognitive Psychology, 8(4), 441–480.
-
Karafyllidis, T., Hatzikraniotis, E., & Molohidis, A. (2019). Eye tracking the behaviour of learners with different level of expertise in a simulaion-based learning environment. 11th International Conference on Education and New Learning Technologies, 3794–3802.
-
Karch, J. M., Valles, J. C. G., & Sevian, H. (2019). Looking into the black box: Using gaze and pupillometric data to probe how cognitive load changes with mental tasks. Journal of Chemical Education, 96(5), 830–840. https://doi.org/10.1021/acs.jchemed.9b00014
-
Kastens, K. A., Shipley, T. F., Boone, A. P., & Straccia, F. (2016). What geoscience experts and novices look at, and what they see, when viewing data visualizations. Journal of Astronomy & Earth Sciences Education, 3(1), 27–58. http://files.eric.ed.gov/fulltext/EJ1103064.pdf
-
Ke, F., Liu, R., Sokolikj, Z., Dahlstrom-Hakki, I., & Israel, M. (2024). Using eye-tracking in education: Review of empirical research and technology. Educational Technology Research and Development, 72(3), 1383–1418. https://doi.org/10.1007/s11423-024-10342-4
-
Kekule, M. (2014). Výzkum pomocí oční kamery ve fyzikálním vzdělávání [A research with the use of an eye-tracking camera in physics education][Scientia in educatione, 5(2), 58–73. https://doi.org/10.14712/18047106.107
-
Kekule, M. (2017). Learning style preferences and their influence on students’ problem solving in kinematics observed by eye-tracking method.AIP Conference Proceedings [Didfyz 2016: From the roots to contemporary education]. 20th International Conference on From the Roots to Contemporary Education in Physics (DIDFYZ), Slovakia.
-
Kessler, S. H., Mede, N. G., & Schafer, M. S. (2020). Eyeing CRISPR on Wikipedia: Using eye tracking to assess what lay audiences look for to learn about CRISPR and genetic engineering. Environmental Communication-a Journal of Nature and Culture, 14(7), 886–903. https://doi.org/10.1080/17524032.2020.1723668
-
King, J., & Markant, J. (2022). Selective attention to lesson-relevant contextual information promotes 3-to 5-year-old children’s learning. Developmental Science, 25(4), Article e13237. https://doi.org/10.1111/desc.13237
-
Klein, P., Kuchemann, S., Bruckner, S., Zlatkin-Troitschanskaia, O., & Kuhn, J. (2019a). Student understanding of graph slope and area under a curve: A replication study comparing first-year physics and economics students. Physical Review Physics Education Research, 15(2), Article 020116. https://doi.org/10.1103/PhysRevPhysEducRes.15.020116
-
Klein, P., Viiri, J., & Kuhn, J. (2019b). Visual cues improve students’ understanding of divergence and curl: Evidence from eye movements during reading and problem solving. Physical Review Physics Education Research, 15(1), 010126. https://doi.org/10.1103/PhysRevPhysEducRes.15.010126
-
Klein, P., Viiri, J., Mozaffari, S., Dengel, A., & Kuhn, J. (2018). Instruction-based clinical eye-tracking study on the visual interpretation of divergence: How do students look at vector field plots? Physical Review Physics Education Research, 14(1), 010116. https://doi.org/10.1103/PhysRevPhysEducRes.14.010116
-
Krogh-Jespersen, S., Quinn, K. A., Krenzer, W. L. D., Nguyen, C., Greenslit, J., & Price, C. A. (2020). Exploring the awe-some: Mobile eye-tracking insights into awe in a science museum. PLoS ONE, 15(9), e0239204. https://doi.org/10.1371/journal.pone.0239204
-
Krstić, K., Šoškić, A., Ković, V., & Holmqvist, K. (2018). All good readers are the same, but every low-skilled reader is different: An eye-tracking study using PISA data. European Journal of Psychology of Education, 33(3), 521–541.
-
Küchemann, S., Klein, P., Fouckhardt, H., Gröber, S., & Kuhn, J. (2020). Students’ understanding of non-inertial frames of reference. Physical Review Physics Education Research, 16(1), 010112. https://doi.org/10.1103/PhysRevPhysEducRes.16.010112
-
Lai, M. L., Tsai, M. J., Yang, F. Y., Hsu, C. Y., Liu, T. C., Lee, S. W. Y., Lee, M. H., Chiou, G. L., Liang, J. C., & Tsai, C. C. (2013). A review of using eye-tracking technology in exploring learning from 2000 to 2012. Educational Research Review, 10, 90–115. https://doi.org/10.1016/j.edurev.2013.10.001
-
Lämsä, J., Kotkajuuri, J., Lehtinen, A., Koskinen, P., Mantyla, T., Kilpelainen, J., & Hamalainen, R. (2022). The focus and timing of gaze matters: Investigating collaborative knowledge construction in a simulation-based environment by combined video and eye tracking. Frontiers in Education, 7, Article 942224. https://doi.org/10.3389/feduc.2022.942224
-
Langendorf, R., Schneider, S., & Klein, P. (2022). Extracting information from the Hertzsprung-Russell diagram: An eye-tracking study. Physical Review Physics Education Research, 18(2), Article 020121. https://doi.org/10.1103/PhysRevPhysEducRes.18.020121
-
Lee, M. H., Wu, Y. T., & Tsai, C. C. (2009). Research trends in science education from 2003 to 2007: A content analysis of publications in selected journals. International Journal of Science Education, 31(15), 1999–2020.
-
Lee, S. (2023). The role of spatial ability and attention shifting in reading of illustrated scientific texts: An eye tracking study. Reading Psychology, 44(8), 915–935. https://doi.org/10.1080/02702711.2023.2202186
-
Li, Q. Y., Xu, S. R., Chen, Y. L., Lu, C. T., & Zhou, S. N. (2022). Detecting preservice teachers? Visual attention under prediction and nonprediction conditions with eye-tracking technology. Physical Review Physics Education Research, 18(1), Article 010134(19). https://doi.org/10.1103/PhysRevPhysEducRes.18.010134
-
Lin, T.-C., Lin, T.-J., & Tsai, C.-C. (2014). Research trends in science education from 2008 to 2012: A systematic content analysis of publications in selected journals. International Journal of Science Education, 36(8), 1346–1372. https://doi.org/10.1080/09500693.2013.864428
-
Lin, T.-J., Lin, T.-C., Potvin, P., & Tsai, C.-C. (2018). Research trends in science education from 2013 to 2017: A systematic content analysis of publications in selected journals. International Journal of Science Education, 1–21. https://doi.org/10.1080/09500693.2018.1550274
-
Lin, T.-J., Lin, T.-C., Potvin, P., & Tsai, C.-C. (2024). Research trends in science education from 2018 to 2022: A systematic content analysis of publications in selected journals. International Journal of Science Education, 1–29. https://doi.org/10.1080/09500693.2024.2340811
-
Lin, Y. Y., Holmqvist, K., Miyoshi, K., & Ashida, H. (2017). Effects of detailed illustrations on science learning: An eye-tracking study. Instructional Science, 45(5), 557–581. https://doi.org/10.1007/s11251-017-9417-1
-
Lindner, M. A., Eitel, A., Strobel, B., & Koller, O. (2017). Identifying processes underlying the multimedia effect in testing: An eye-movement analysis. Learning and Instruction, 47, 91–102. https://doi.org/10.1016/j.learninstruc.2016.10.007
-
Liu, C. C., Hsieh, I. C., Wen, C. T., Chang, M. H., Fan Chiang, S. H., Tsai, M.-J., Chang, C. J., & Hwang, F. K. (2021). The affordances and limitations of collaborative science simulations: The analysis from multiple evidences. Computers & Education, 160, 104029. https://doi.org/10.1016/j.compedu.2020.104029
-
Liu, C. C., Lin, S. W., Cheng, C. H., Wen, C. T., Chang, M. H., Chiang, S. H. F., Tsai, M. J., Lin, H. M., & Hwang, F. W. (2022). The impact of functional interdependencies of computer simulations on collaborative learning: Evidence from multiple sources. Journal of Computer Assisted Learning, 38(2), 455–469. https://doi.org/10.1111/jcal.12625
-
Liu, H. C., & Chuang, H. H. (2011). An examination of cognitive processing of multimedia information based on viewers’ eye movements. Interactive Learning Environments, 19(5), 503–517. https://doi.org/10.1080/10494820903520123
-
Liu, P.-L. (2014). Using eye tracking to understand learners’ reading process through the concept-mapping learning strategy. Computers & Education, 78, 237–249. https://doi.org/10.1016/j.compedu.2014.05.011
-
Liu, Y., Lu, Y., Ren, S., & Zhang, D. (2024). Exploring primary school students’ self-regulated learning profiles in a web-based inquiry science environment. Research in Science Education, 54(4), 687–705. https://doi.org/10.1007/s11165-024-10159-4
-
Locatelli, S. W., de Oliveira, L. S., da Silva, S. R., Jr., & Sato, J. R. (2024). Perspectives of the eye-tracking application to understand access to representational levels in chemistry. Journal of Science Education and Technology. https://doi.org/10.1007/s10956-024-10123-x
-
Martinez, B. L., Sweeder, R. D., VandenPlas, J. R., & Herrington, D. G. (2021). Improving conceptual understanding of gas behavior through the use of screencasts and simulations. International Journal of STEM Education, 8(1), 5. https://doi.org/10.1186/s40594-020-00261-0
-
Mason, L., Pluchino, P., & Ariasi, N. (2014). Reading information about a scientific phenomenon on webpages varying for reliability: An eye-movement analysis. Etr&d-Educational Technology Research and Development, 62(6), 663–685. https://doi.org/10.1007/s11423-014-9356-3
-
Mason, L., Pluchino, P., & Tornatora, M. C. (2013a). Effects of picture labeling on science text processing and learning: Evidence from eye movements. Reading Research Quarterly, 48(2), 199–214. https://doi.org/10.1002/rrq.41
-
Mason, L., Pluchino, P., & Tornatora, M. C. (2015a). Eye-movement modeling of integrative reading of an illustrated text: Effects on processing and learning. Contemporary Educational Psychology, 41, 172–187. https://doi.org/10.1016/j.cedpsych.2015.01.004
-
Mason, L., Pluchino, P., Tornatora, M. C., & Ariasi, N. (2013b). An eye-tracking study of learning from science text with concrete and abstract illustrations. Journal of Experimental Education, 81(3), 356–384. https://doi.org/10.1080/00220973.2012.727885
-
Mason, L., Tornatora, M. C., & Pluchino, P. (2015b). Integrative processing of verbal and graphical information during re-reading predicts learning from illustrated text: An eye-movement study. Reading and Writing, 28(6), 851–872. https://doi.org/10.1007/s11145-015-9552-5
-
Matthews, M. R. (1994). Science teaching: The role of history and philosophy of science. Routledge.
-
Meyer, D., & Pietzner, V. (2022). Reading textual and non-textual explanations in chemistry texts and textbooks – A review. Chemistry Education Research and Practice, 23(4), 768–785. https://doi.org/10.1039/D2RP00162D
-
Moen, K. C., Beck, M. R., Saltzmann, S. M., Cowan, T. M., Burleigh, L. M., Butler, L. G., Ramanujam, J., Cohen, A. S., & Greening, S. G. (2020). Strengthening spatial reasoning: Elucidating the attentional and neural mechanisms associated with mental rotation skill development. Cognitive Research: Principles and Implications, 5(1), 20. https://doi.org/10.1186/s41235-020-00211-y
-
Moon, J., & Ryu, J. (2021). The effects of social and cognitive cues on learning comprehension, eye-gaze pattern, and cognitive load in video instruction. Journal of Computing in Higher Education, 33(1), 39–63. https://doi.org/10.1007/s12528-020-09255-x
-
Mozaffari, S., Al-Naser, M., Klein, P., Küchemann, S., Kuhn, J., Widmann, T., & Dengel, A. (2020). Classification of visual strategies in physics vector field problem-solving. ICAART (2),
-
Mozaffari, S., Klein, P., Al-Naser, M., Kuchemann, S., Kuhn, J., Widmann, T., spsampsps Dengel, A. (2021). Quantifying gaze-based strategic patterns in physics vector field divergence.Lecture Notes in Artificial Intelligence [Agents and artificial intelligence, icaart 2020]. 12th International Conference on Agents and Artificial Intelligence (ICAART), Valletta, MALTA.
-
Mozaffari, S., Klein, P., Viiri, J., Ahmed, S., Kuhn, J., & Dengel, A. (2018). Evaluating similarity measures for gaze patterns in the context of representational competence in physics education. [2018 acm symposium on eye tracking research & applications (etra 2018)]. ACM Symposium on Eye Tracking Research and Applications (ETRA), SWPS Univ Social Sci & Humanities, Warsaw, OMAN.
-
Mozaffari, S. S., Klein, P., Al-Naser, M., Bukhari, S. S., Kuhn, J., Dengel, A., & Assoc Comp, M. (2016a). A study on representational competence in physics using mobile eye tracking systems. [Proceedings of the 18th international conference on human-computer interaction with mobile devices and services (mobilehci 2016)]. 18th International Conference on Human-Computer Interaction with Mobile Devices and Services (MobileHCI), Florence, ITALY.
-
Mozaffari, S. S. C., Kuhn, J., Klein, P., Dengel, A., Bukhari, S. S., & Assoc Comp, M. (2016b). Entropy based transition analysis of eye movement on physics representational competence. [Ubicomp’16 adjunct: Proceedings of the 2016 acm international joint conference on pervasive and ubiquitous computing]. ACM International Joint Conference on Pervasive and Ubiquitous Computing (UbiComp) / 20th ACM International Symposium on Wearable Computers (ISWC), Heidelberg, GERMANY.
-
Mudrychova, K., Horakova, T., & Berankova, M. H. (2018). Users’ characteristics for analyzing the educational texts with an eye-tracking technology.Divai [Divai 2018: 12th international scientific conference on distance learning in applied informatics]. 12th International Scientific Conference on Distance Learning in Applied Informatics (DIVAI), Sturovo, SLOVAKIA.
-
Nehring, A., & Busch, S. (2018). Chemistry demonstrations and visual attention: Does the setup matter? Evidence from a Double-Blinded Eye-Tracking Study. Journal of Chemical Education, 95(10), 1724–1735. https://doi.org/10.1021/acs.jchemed.8b00133
-
Nehring, A., & Busch, S. (2020). Setting up chemistry demonstrations according to the left-to-right principle: An eye-movement-pattern-based analysis. Journal of Chemical Education, 97(1), 275–282. https://doi.org/10.1021/acs.jchemed.9b00102
-
Novick, L. R., Stull, A. T., & Catley, K. M. (2012). Reading phylogenetic trees: The effects of tree orientation and text processing on comprehension. BioScience, 62(8), 757–764. https://doi.org/10.1525/bio.2012.62.8.8
-
O’Connor, C., & Joffe, H. (2020). Intercoder reliability in qualitative research: Debates and practical guidelines. International Journal of Qualitative Methods, 19, 1609406919899220. https://doi.org/10.1177/1609406919899220
-
O’Keefe, P. A., Letourneau, S. M., Homer, B. D., Schwartz, R. N., & Plass, J. L. (2014). Learning from multiple representations: An examination of fixation patterns in a science simulation. Computers in Human Behavior, 35, 234–242. https://doi.org/10.1016/j.chb.2014.02.040
-
Osborne, J. (2015). Practical work in science: Misunderstood and badly used? School Science Review, 96(357), 16–24. https://eric.ed.gov/?redir=http%3a%2f%2fwww.ase.org.uk%2fjournals%2fschool-science-review%2f2015%2f05%2f357%2f
-
Pande, P. (2021). Learning and expertise with scientific external representations: An embodied and extended cognition model. Phenomenology and the Cognitive Sciences, 20(3), 463–482. https://doi.org/10.1007/s11097-020-09686-y
-
Pande, P., & Chandrasekharan, S. (2021). Expertise as sensorimotor tuning: Perceptual navigation patterns mark representational competence in science. Research in Science Education, 52(2), 725–747. https://doi.org/10.1007/s11165-020-09981-3
-
Pardi, G., Hienert, D., & Kammerer, Y. (2022). Examining the use of text and video resources during web-search based learning-a new methodological approach. New Review of Hypermedia and Multimedia, 28(1–2), 39–67. https://doi.org/10.1080/13614568.2022.2099583
-
Park, B., Korbach, A., & Brünken, R. (2015). Do learner characteristics moderate the seductive-details-effect? A cognitive-load-study using eye-tracking. Journal of Educational Technology & Society, 18(4), 24–36. http://www.jstor.org/stable/jeductechsoci.18.4.24
-
Pekrun, R. (2006). The control-value theory of achievement emotions: Assumptions, corollaries, and implications for educational research and practice. Educational Psychology Review, 18(4), 315–341. https://doi.org/10.1007/s10648-006-9029-9
-
Peterson, J., Pardos, Z., Rau, M., Swigart, A., Gerber, C., spsampsps McKinsey, J. (2015). Understanding student success in chemistry using gaze tracking and pupillometry. In C. Conati, N. Heffernan, A. Mitrovic, spsampsps M. F. Verdejo, Artificial Intelligence in Education Cham.
-
Piaget, J. (1954). The construction of reality in the child. Routledge & Kegan Paul.
-
Popelka, S. (2018). Eye-tracking (nejen) v kognitivní kartografii: praktický průvodce tvorbou a vyhodnocením experimentu [Eye-Tracking (Not Only) in Cognitive Cartography: A Practical Guide to Experiment Design and Evaluation] [Eye-Tracking (Not Only) in Cognitive Cartography: A Practical Guide to Creating and Evaluating Experiments]. Univerzita Palackého v Olomouci pro katedru geoinformatiky.
-
Rau, M. A., spsampsps Evenstone, A. L. (2014). Multi-methods approach for domain-specific grounding: An ITS for connection making in chemistry.Lecture Notes in Computer Science [Intelligent tutoring systems, its 2014]. 12th International Conference on Intelligent Tutoring Systems (ITS), Honolulu, HI.
-
Rau, M. A., Michaelis, J. E., & Fay, N. (2015). Connection making between multiple graphical representations: A multi-methods approach for domain-specific grounding of an intelligent tutoring system for chemistry. Computers & Education, 82, 460–485. https://doi.org/10.1016/j.compedu.2014.12.009
-
Rayner, K. (1998). Eye movements in reading and information processing: 20 years of research. Psychological Bulletin, 124(3), 372–422. https://doi.org/10.1037/0033-2909.124.3.372
-
Repnik, R., Cvetko, M., & Gerlič, I. (2011). Development of some natural science competences in undergraduate study by training visualization skills on subject liquid crystal phases and structures. Molecular Crystals and Liquid Crystals, 547(1), 249/[1939]-1254/[1944]. https://doi.org/10.1080/15421406.2011.572770
-
Rodemer, M., Eckhard, J., Graulich, N., & Bernholt, S. (2020). Decoding case comparisons in organic chemistry: Eye-tracking students’ visual behavior. Journal of Chemical Education, 97(10), 3530–3539. https://doi.org/10.1021/acs.jchemed.0c00418
-
Rosengrant, D., Thomson, C., & Mzoughi, T. (2009). Comparing experts and novices in solving electrical circuit problems with the help of eye-tracking. AIP Conference Proceedings, 1179(1), 249–252. https://doi.org/10.1063/1.3266728
-
Rosiek, R., spsampsps Sajka, M. (2017). Eyetracking in research on physics education.Springer Proceedings in Physics [Key competences in physics teaching and learning]. International Conference of International-Research-Group-on-Physics-Teaching and European-Physical-Society – Physics-Education-Division (GIREP-EPEC), Wroclaw, POLAND.
-
Rusek, M., Sakhnini, S., & Bílek, M. (2022). Experiments safety – The state of art at schools in Czechia. Chemistry-Didactics-Ecology-Metrology, 27(1–2), 153–163. https://doi.org/10.2478/cdem-2022-0009
-
Rusek, M., & Vojíř, K. (2019). Analysis of text difficulty in lower-secondary chemistry textbooks. Chemistry Education Research and Practice, 20(1), 85–94. https://doi.org/10.1039/C8RP00141C
-
Sáiz-Manzanares, M. C., Marticorena-Sánchez, R., Martín-Antón, L.-J., Almeida, L., & Carbonero-Martín, M. -Á. (2023). Application and challenges of eye tracking technology in higher education. Comunicar, 31(76), 35–45. https://doi.org/10.3916/C76-2023-03
-
Savec, V. F., Hrast, S., Devetak, I., & Torkar, G. (2016). Beyond the use of an explanatory key accompanying submicroscopic representations. Acta Chimica Slovenica, 63(4), 864–873. https://doi.org/10.17344/acsi.2016.2835
-
Scrimin, S., & Mason, L. (2015). Does mood influence text processing and comprehension? Evidence from an eye-movement study. British Journal of Educational Psychology, 85(3), 387–406. https://doi.org/10.1111/bjep.12080
-
Serder, M., & Ideland, M. (2016). PISA truth effects: The construction of low performance. Discourse: Studies in the Cultural Politics of Education, 37(3), 341–357. https://doi.org/10.1080/01596306.2015.1025039
-
Sharma, K., Alavi, H. S., Jermann, P., & Dillenbourg, P. (2016). A gaze-based learning analytics model: In-video visual feedback to improve learner’s attention in MOOCs. Proceedings of the Sixth International Conference on Learning Analytics & Knowledge, 417–421. https://doi.org/10.1145/2883851.2883902
-
Sharma, K., Papamitsiou, Z., & Giannakos, M. (2019). Building pipelines for educational data using AI and multimodal analytics: A “grey-box” approach. British Journal of Educational Technology, 50(6), 3004–3031. https://doi.org/10.1111/bjet.12854
-
She, H. C., & Chen, Y. Z. (2009). The impact of multimedia effect on science learning: Evidence from eye movements. Computers & Education, 53(4), 1297–1307. https://doi.org/10.1016/j.compedu.2009.06.012
-
Schnotz, W., Ludewig, U., Ullrich, M., Horz, H., McElvany, N., & Baumert, J. (2014). Strategy shifts during learning from texts and pictures. Journal of Educational Psychology, 106(4), 974–989. https://doi.org/10.1037/a0037054
-
Schnotz, W., & Wagner, I. (2018). Construction and elaboration of mental models through strategic conjoint processing of text and pictures. Journal of Educational Psychology, 110(6), 850-863. https://doi.org/10.1037/edu0000246
-
Schutte, N.-M. (2023). Summary maps: Using eye tracking to investigate where students go wrong. Doctoral dissertation, North-West University (South Africa)].
-
Sjøberg, S. (2007). PISA and “real life challenges”: Mission impossible?
-
Slapničar, M., Tompa, V., Glažar, S. A., Devetak, I., & Pavlin, J. (2020). Students’ achievements in solving authentic tasks with 3D dynamic sub-microscopic animations about specific states of water and their transition. Acta Chimica Slovenica, 67(3), 904–915. https://doi.org/10.17344/acsi.2020.5908
-
Stieff, M., Hegarty, M., & Deslongchamps, G. (2011). Identifying representational competence with multi-representational displays. Cognition and Instruction, 29(1), 123-145. https://doi.org/10.1080/07370008.2010.507318
-
Strohmaier, A. R., MacKay, K. J., Obersteiner, A., & Reiss, K. M. (2020). Eye-tracking methodology in mathematics education research: A systematic literature review. Educational Studies in Mathematics, 104, 147–200. https://doi.org/10.1007/s10649-020-09948-1
-
Stull, A. T., Fiorella, L., & Mayer, R. E. (2018). An eye-tracking analysis of instructor presence in video lectures. Computers in Human Behavior, 88, 263–272. https://doi.org/10.1016/j.chb.2018.07.019
-
Susac, A., Bubic, A., Kazotti, E., Planinic, M., & Palmovic, M. (2018). Student understanding of graph slope and area under a graph: A comparison of physics and nonphysics students. Physical Review Physics Education Research, 14(2), Article 020109. https://doi.org/10.1103/PhysRevPhysEducRes.14.020109
-
Susac, A., Bubic, A., Planinic, M., Movre, M., & Palmovic, M. (2019). Role of diagrams in problem solving: An evaluation of eye-tracking parameters as a measure of visual attention. Physical Review Physics Education Research, 15(1), 6, Article 013101. https://doi.org/10.1103/PhysRevPhysEducRes.15.013101
-
Susac, A., Planinic, M., Bubic, A., Jelicic, K., Ivanjek, L., MatejakCvenic, K., & Palmovic, M. (2021). Effect of students’ investigative experiments on students’ recognition of interference and diffraction patterns: An eye-tracking study. Physical Review Physics Education Research, 17(1), 010110. https://doi.org/10.1103/PhysRevPhysEducRes.17.010110
-
Sweeder, R. D., Herrington, D. G., & VandenPlas, J. R. (2019). Supporting students’ conceptual understanding of kinetics using screencasts and simulations outside of the classroom. Chemistry Education Research and Practice, 20(4), 685–698. https://doi.org/10.1039/c9rp00008a
-
Syskowski, S., & Huwer, J. (2023). A combination of real-world experiments and augmented reality when learning about the states of wax—An eye-tracking study. Education Sciences, 13(2), 177. https://www.mdpi.com/2227-7102/13/2/177
-
Škrabánková, J., Koci, P., Vanek, V., & Nocar, D. (2019). Differences in attitudes to solving task by gifted and standard students monitored by the eye tracking methodology – Pilot study.ICERI Proceedings [12th international conference of education, research and innovation (iceri2019)]. 12th Annual International Conference of Education, Research and Innovation (ICERI), Seville, SPAIN.
-
Škrabánková, J., Popelka, S., & Beitlová, M. (2020). Students’ ability to work with graphs in physics studies related to three typical student groups. Journal of Baltic Science Education, 19(2), 298–316. https://doi.org/10.33225/jbse/20.19.298
-
Tang, H., Day, E., Kendhammer, L. K., Moore, J. N., Brown, S., & Pienta, N. J. (2016). Eye movement patterns in solving science ordering problems. Journal of Eye Movement Research, 9.
-
Tang, H., Kirk, J., & Pienta, N. J. (2014). Investigating the effect of complexity factors in stoichiometry problems using logistic regression and eye tracking. Journal of Chemical Education, 91(7), 969–975. https://doi.org/10.1021/ed4004113
-
Tang, H., & Pienta, N. (2012). Eye-tracking study of complexity in gas law problems. Journal of Chemical Education, 89(8), 988–994. https://doi.org/10.1021/ed200644k
-
Taub, M., spsampsps Azevedo, R. (2016). Using eye-tracking to determine the impact of prior knowledge on self-regulated learning with an adaptive hypermedia-learning environment. 34–47.
-
Teo, T. W., Goh, M. T., & Yeo, L. W. (2014). Chemistry education research trends: 2004–2013. Chemistry Education Research and Practice, 15(4), 470–487. https://doi.org/10.1039/c4rp00104d
-
Thees, M., Altmeyer, K., Kapp, S., Rexigel, E., Beil, F., Klein, P., Malone, S., Brunken, R., & Kuhn, J. (2022). Augmented reality for presenting real-time data during students’ laboratory work: Comparing a head-mounted display with a separate display. Frontiers in Psychology, 13, Article 804742. https://doi.org/10.3389/fpsyg.2022.804742
-
Topczewski, J. J., Topczewski, A. M., Tang, H., Kendhammer, L. K., & Pienta, N. J. (2016). NMR spectra through the eyes of a student: Eye tracking applied to NMR items. Journal of Chemical Education, 94(1), 29–37. https://doi.org/10.1021/acs.jchemed.6b00528
-
Tóthová, M., & Rusek, M. (2021a). An analysis of pre-service chemistry teachers’ progress when solving multicomponent tasks. PROJECT-BASED EDUCATION AND OTHER ACTIVATING STRATEGIES IN SCIENCE EDUCATION XVIII., 211–221.
-
Tóthová, M., & Rusek, M. (2021b). Developing students’ problem-solving skills using learning tasks: An action research project in secondary school. Acta Chimica Slovenica, 68(4), 1016–1026. https://doi.org/10.17344/acsi.2021.7082
-
Tóthová, M., & Rusek, M. (2021c). The use of eye-tracking in science textbook analysis: A literature review. Scientia in educatione, 12(1), 63–74. https://doi.org/10.14712/18047106.1932
-
Tóthová, M., & Rusek, M. (2022). “Do you just have to know that?” Novice and experts’ procedure when solving science problem tasks. Frontiers in Education, 7, 1051098. https://doi.org/10.3389/feduc.2022.1051098
-
Tóthová, M., Rusek, M., & Chytrý, V. (2021). Students’ procedure when solving problem tasks based on the periodic table: An eye-tracking study. Journal of Chemical Education, 98(6), 1831–1840. https://doi.org/10.1021/acs.jchemed.1c00167
-
Tsai, M.-J., Hou, H.-T., Lai, M.-L., Liu, W.-Y., & Yang, F.-Y. (2012). Visual attention for solving multiple-choice science problem: An eye-tracking analysis. Computers & Education, 58(1), 375–385. https://doi.org/10.1016/j.compedu.2011.07.012
-
Tsai, M.-J., Huang, L.-J., Hou, H.-T., Hsu, C.-Y., & Chiou, G.-L. (2016). Visual behavior, flow and achievement in game-based learning. Computers & Education, 98, 115–129. https://doi.org/10.1016/j.compedu.2016.03.011
-
Tsai, M. J., & Wu, A. H. (2021). Visual search patterns, information selection strategies, and information anxiety for online information problem solving. Computers & education, 172, Article 104236. https://doi.org/10.1016/j.compedu.2021.104236
-
Tsai, P. Y., Yang, T. T., She, H. C., & Chen, S. C. (2019). Leveraging college students’ scientific evidence-based reasoning performance with eye-tracking-supported metacognition. Journal of Science Education and Technology, 28(6), 613–627. https://doi.org/10.1007/s10956-019-09791-x
-
van der Graaf, J., Segers, E., & de Jong, T. (2020). Fostering integration of informational texts and virtual labs during inquiry-based learning. Contemporary Educational Psychology, 62, 101890. https://doi.org/10.1016/j.cedpsych.2020.101890
-
VandenPlas, J. R., Herrington, D. G., Shrode, A. D., & Sweeder, R. D. (2021). Use of simulations and screencasts to increase student understanding of energy concepts in bonding. Journal of Chemical Education, 98(3), 730–744. https://doi.org/10.1021/acs.jchemed.0c00470
-
Vojíř, K., & Rusek, M. (2019). Science education textbook research trends: A systematic literature review. International Journal of Science Education, 41(11), 1496–1516. https://doi.org/10.1080/09500693.2019.1613584
-
von Reumont, F., & Budke, A. (2020). Strategies for successful learning with geographical comics: An eye-tracking study with young learners. Education Sciences, 10(10), 293. https://www.mdpi.com/2227-7102/10/10/293
-
Wang, C.-Y., Tsai, M.-J., & Tsai, C.-C. (2016). Multimedia recipe reading: Predicting learning outcomes and diagnosing cooking interest using eye-tracking measures. Computers in Human Behavior, 62, 9–18. https://doi.org/10.1016/j.chb.2016.03.064
-
Wang, J. H., Stebbins, A., & Ferdig, R. E. (2022a). Examining the effects of students’ self-efficacy and prior knowledge on learning and visual behavior in a physics game. Computers & education, 178, Article 104405. https://doi.org/10.1016/j.compedu.2021.104405
-
Wang, M., Wu, J. X., An, N., & Lin, M. L. (2021). The effect of emotional experiences in fieldwork: Embodied evidence from a visual approach. Journal of Geography in Higher Education, 47(2), 188–209. https://doi.org/10.1080/03098265.2021.2005002
-
Wang, T. N., Jian, Y. C., Wu, C. J., & Li, P. (2022b). Science reading and self-regulated learning: Evidence from eye movements of middle-school readers. Journal of Educational Research, 115(1), 11–24. https://doi.org/10.1080/00220671.2021.2012637
-
Wiebe, E. N., Minogue, J., Jones, M. G., Cowley, J., & Krebs, D. (2009). Haptic feedback and students’ learning about levers: Unraveling the effect of simulated touch. Computers & Education, 53(3), 667–676. https://doi.org/10.1016/j.compedu.2009.04.004
-
Wiedbusch, M., Lester, J., & Azevedo, R. (2023). A multi-level growth modeling approach to measuring learner attention with metacognitive pedagogical agents. Metacognition and Learning, 18(2), 465–494. https://doi.org/10.1007/s11409-023-09336-z
-
Wisiecka, K., Krejtz, K., Krejtz, I., Sromek, D., Cellary, A., Lewandowska, B., & Duchowski, A. (2022). Comparison of webcam and remote eye tracking. Symposium on Eye Tracking Research and Applications, 2022, 1–7.
-
Wu, C. J., & Liu, C. Y. (2021). Eye-movement study of high- and low-prior-knowledge students’ scientific argumentations with multiple representations. Physical Review Physics Education Research, 17(1), Article 010125. https://doi.org/10.1103/PhysRevPhysEducRes.17.010125
-
Wu, C. J., Liu, C. Y., Yang, C. H., & Wu, C. Y. (2021). Children’s reading performances in illustrated science texts: Comprehension, eye movements, and interpretation of arrow symbols. International Journal of Science Education, 43(1), 105–127. https://doi.org/10.1080/09500693.2020.1858515
-
Wu, C. H., Tzeng, Y. L., & Huang, Y. M. (2014). Understanding the relationship between physiological signals and digital game-based learning outcome. Journal of Computers in Education, 1(1), 81–97. https://doi.org/10.1007/s40692-014-0006-x
-
Yang, F.-Y. (2017). Examining the reasoning of conflicting science information from the information processing perspective—An eye movement analysis. Journal of Research in Science Teaching, 54(10), 1347–1372. https://doi.org/10.1002/tea.21408
-
Yang, F.-Y., Huang, R.-T., & Tsai, I.-J. (2016). The effect of epistemic beliefs in science and gender difference on university students’ science-text reading: An eye-tracking study. International Journal of Science and Mathematics Education, 14(3), 473–498. https://doi.org/10.1007/s10763-014-9578-1
-
Yang, F. Y., Chang, C. Y., Chien, W. R., Chien, Y. T., & Tseng, Y. H. (2013). Tracking learners’ visual attention during a multimedia presentation in a real classroom. Computers & Education, 62, 208–220. https://doi.org/10.1016/j.compedu.2012.10.009
-
Ye, J. Q., Zheng, Y. B., Zhan, M., Zhou, Y. L., Li, L., & Chen, D. M. (2024). Characteristics of pre-service chemistry teachers’ mechanistic reasoning in organic chemistry tasks: An eye-tracking study. Research in Science Education. https://doi.org/10.1007/s11165-024-10185-2
-
Yun, E. (2020). Comparing the reading behaviours of students with high- and low-level comprehension of scientific terms by eye movement analysis. Research in Science Education. https://doi.org/10.1007/s11165-020-09935-9
-
Zang, S. Y., Lin, P. T., Chen, X. Y., Bai, Y., & Deng, H. H. (2022). Comparing middle school students’ scientific problem-solving behavior in hands-on manipulation performance assessment: Terms by eye-tracking analysis. Scientific Programming, 2022, Article 6972215. https://doi.org/10.1155/2022/6972215
-
Zhao, Y. (2020). Two decades of havoc: A synthesis of criticism against PISA. Journal of Educational Change, 21(2), 245–266. https://doi.org/10.1007/s10833-019-09367-x
Acknowledgements
Origins of this paper were supported by Pascal Klein and Larissa Hahn. The authors are grateful for their cooperation.
Funding
Open access publishing supported by the institutions participating in the CzechELib Transformative Agreement. The project was funded by the Charles University Grant Agency nr. 492122 and Charles University project Cooperatio.
Ethics declarations
Conflict of Interest
The authors declare that they have no conflict of interest.
Additional information
Rights and permissions
Open Access This article is licensed under a Creative Commons Attribution 4.0 International License, which permits use, sharing, adaptation, distribution and reproduction in any medium or format, as long as you give appropriate credit to the original author(s) and the source, provide a link to the Creative Commons licence, and indicate if changes were made. The images or other third party material in this article are included in the article’s Creative Commons licence, unless indicated otherwise in a credit line to the material. If material is not included in the article’s Creative Commons licence and your intended use is not permitted by statutory regulation or exceeds the permitted use, you will need to obtain permission directly from the copyright holder. To view a copy of this licence, visit http://creativecommons.org/licenses/by/4.0/.
Reprints and permissions
About this article
Cite this article
Tóthová, M., Rusek, M. Eye Tracking in Science Education Research: Comprehensive Literature Review. Sci & Educ (2025). https://doi.org/10.1007/s11191-025-00644-1
- Accepted
- Published
- DOI https://doi.org/10.1007/s11191-025-00644-1