Article Content
1 Introduction
Throughout the world, there is a constant and significant demand for energy to satisfy the ever-growing needs of essential sectors such as electricity and heating, industry, and transport. In order to meet these demands, neoclassical natural hydrocarbon resources are continuously utilised, causing harm to our ecosystem and negatively altering our climate over time. To counter this damaging chain of events, access to affordable, clean energy sources for all can be deemed necessary for survival. One of the most promising clean energy carriers towards a net zero environment is hydrogen, due to its unique properties such as its high energy density (141.7 MJ/kg) and zero carbon emissions when used as a fuel [1,2,3,4]. Currently, the primary method of hydrogen synthesis is through the steam methane reforming process. However, for every ton of hydrogen that is produced, 8 to 12 tons of CO2 is also emitted [5, 6]. As a result, there has been much attention in recent years to alternative, sustainable routes of hydrogen production. The application of knowledge discovered through scientific study has had a positive impact in this strive for sustainable alternatives, and has been especially beneficial in the development and advancement of green hydrogen technology [7]. Recently, more attention is being given to emerging trends in this field, although this has been on-going since the 1960’s [8]. Green hydrogen generation supports our societal push towards net-zero since it produces water as a waste product and releases no carbon pollution [9]. At the same time as the current energy crisis however there is also a dire need around the world for clean water, with 1.2 billion people currently without access to safe drinking water and 2.6 billion with inadequate levels of sanitation [10]. This is as a result of a wide range of different water pollutants affecting various areas throughout the world. Agricultural areas are mainly impacted by pollutants such as pesticides and insecticides, whereas metropolitan areas are primarily suffering at the hand of domestic and industrial waste-organics and inorganics diluted in their wastewater [11]. Furthermore, many conventional wastewater treatments plants are operating without suitable contaminant removal facilities meaning treated wastewater that still contains these pollutants is released back into water sources [12].
One of the major causes of water pollution found worldwide is due to the failure of the textile industry to correctly dispose of their wastewater. The textile industry is known as being one of the most labour-intensive industries and a significant producer of effluent wastewater as a result of its high levels of water consumption through its various wet processing operations [13, 14]. When compared to other dye-utilising industries, the textile industry is known to be one of the largest consumers of dyes, with over 10,000 tonnes of synthetic dyes been used every year [15]. As a result, an estimated 100 tonnes of dye effluent is produced annually, generating huge amounts of dye wastewater due to the aforementioned significant water consumption [16]. Azo dyes, such as methylene blue (MB) and methyl orange (MO), contribute to over 60% of textile dyes consumed worldwide and are considered as some of the most hazardous and non-degradable pollutants that are commonly used in industry [17, 18]. When released into water bodies, untreated textile wastewater severely negates the penetration of sunlight, which impacts aquatic vegetation and animals that rely on photosynthesis for survival. Furthermore, it can affect the oxygen transport mechanism between air and water which hampers the water’s self-purification process [19]. The danger to human health is also significant, with azo dyes known to be carcinogenic, mutagenic, allergenic, and a known cause of various diseases [20]. Many methods have been developed in order to combat this issue including biological treatment, membrane technology, adsorption, and advanced oxidation process (AOP) [12]. Adsorption processes have gathered a lot of attention due to their high efficiency in dye and colour removal in wastewater, and effective treatment of chemicals and metal ions [21]. Activated carbon has been shown to be a strong adsorbent across a wide range of dyes. However, its high cost and low regeneration ability limits its practical use. Many cheaper alternative materials have been researched but their application has been restricted due to sludge generation and regeneration issues [13, 22]. Membrane technologies also suffer from the requirement of a high initial investment. Further disadvantages such as the generation of other waste products and possible damage to the membrane itself require improvement before its wide implementation [13]. Biological methods, such as the fungal and bacterial degradation of dyes, are seen as low-cost and environmentally friendly methods, that also benefit from lower sludge production [23]. However, many biological treatments are hampered by long treatment times, limited effectiveness for certain pollutants, and can be sensitive to fluctuations in the environment [16, 24]. Out of all the AOP methods, dye degradation via electrocatalysis is seen as one of the most promising technologies. Electrocatalysis, which requires a straightforward setup of both a cathode and anode plate submerged in an electrolyte and connected to a DC electrical power supply, is typically used in the degradation of pollutants in wastewater. Compounds decompose by forcing the charged ions in the circuit to gain or lose electrons. This method holds many advantages over its competitors, such as its environmentally friendly nature, lower energy costs, flexibility, applicability in high concentrations of pollutants, and ease of use [25, 26]. Crucially, the electrochemical process enables the simultaneous production of hydrogen gas along with the pollutant degradation process [27, 28].
Currently, there is a significant focus on improving the performance and efficiency of water electrolysis technologies through the development of cheaper and more stable electrolyser components such as membranes, separators, plates, and electrocatalyst materials [4]. In recent years, a wide range of electrocatalyst materials has been developed for the hydrogen evolution reaction (HER) but there has been less of a focus on the development of oxygen evolution reaction (OER) materials [29]. By modifying electrocatalysts, it is possible to enhance the physio-chemical characteristics of the OER activity. Therefore, the design and implementation of efficient, low-cost, and sustainable water oxidation catalyst materials is key to achieving successful pollutant degradation and green hydrogen generation. When considering the selection of water oxidation catalysts, RuO2 and IrO2 are known to be two of the most effective materials for this process. However, their high cost and scarcity hamper their potential to be scaled-up and utilised in industry [30,31,32]. Metal chalcogenides, particularly nickel chalcogenides, are receiving significant attention due to their high activity for both the HER and OER in alkaline solutions [33, 34]. Nickel’s high activity, along with its relative low cost and vast availability, makes it an extremely viable alternative to traditional noble metal-based catalysts. Within the nickel chalcogenide group, nickel selenides are the second most studied for water electrolysis after nickel sulphides [35, 36]. From literature, nickel selenide has been reported to exist in four main structures, namely Ni1−xSe (0 < x < 0.15), NiSe2, Ni3Se4 and Ni2Se3 [37]. However, for all phases, enhancing the active site count remains a challenge for producing highly efficient HER and OER catalysis with a facile synthesis [38,39,40,41]. Typically black in colour, nickel selenides exhibit insolubility in water—a crucial characteristic that renders them ideal for electrocatalytic water splitting applications. Nickel selenides also have outstanding intrinsic metal properties, allowing for excellent electrical conductivity and electrocatalytic activity [42]. Interestingly, there is no other solvent that is capable of dissolving nickel selenides, but it tends to dissolve readily in highly oxidising acids such as HNO3 [37]. Owing to the stability in neutral water and neutral water solutions of other electrolytes, NiSe is an appropriate catalyst for electrochemical water splitting in neutral and near-neutral media.
In this work, NiSe nanoparticles are synthesised adopting an optimised solvothermal method in view of minimising the cost of the process. The physicochemical and electro-catalytic properties of the synthesised NiSe electrodes are studied in both freshwater and dye-water mediums, using scanning electron microscopy (SEM), high-resolution transmission electron microscopy (HRTEM), and linear sweep voltammetry (LSV). Dye degradation capability of NiSe will be examined using MO dye as a model pollutant and the optical properties of the dye will be analysed using a spectrophotometer. From the dye degradation process, simultaneous hydrogen recovery will also be studied.
2 Experimental
2.1 Chemical Reagents
Selenium powder (Se, molecular weight: 78.96 descriptions, 99.99%), Sodium tetrahydridoborate or Sodium borohydride (NaBH4, molecular weight: 37.83 descriptions, ≥ 99.8%), N,N-Dimethylformamide (N,N-DMF, molecular weight: 73.09, description, 138 ≥ 99.8%), Nickel(II) chloride hexahydrate (NiCl2 · 6H2O molecular weight: 237.69) and Ruthenium (iv) oxide (RuO2 molecular weight:133.07) The life science and biotechnology business Sigma-Aldrich supplied the compounds, which were used straight without further purification.
2.2 Synthesis of NiSe Nanomaterial
The solvothermal synthesis of NiSe was carried out using the following method. First, 0.32 g of Se powder and 0.19 g of NaBH4 were dispersed into 30 ml of N,N-DMF, and this initial solution is then placed on a magnetic stirrer at 200 rpm for 1 h. Once the desired time has elapsed, 0.48 g of NiCl2 is then added to this solution, before being placed back on the stirrer for a further 1 h (200 rpm). After sufficient stirring, the solution is transferred to an autoclave jar (100 ml capacity) and kept in an electric furnace (Thermo Scientific) at 170 °C for an optimised duration of time. The electric furnace is switched off after completion of the desired time duration and the autoclave jar is left to cool to room temperature. Once cool, the solution is transferred to a glass beaker and washed with ethanol and water alternatively four times. During the washing process, the powder was collected using a centrifuge process. The final powder sample was further annealed at 60 °C under a vacuum for 24 h. On completion of this process, the resultant NiSe nanomaterial is kept under vacuum conditions to prevent any oxidation occurring in the material.
2.3 NiSe Electrode Fabrication
A homogenous NiSe ink was then prepared from the fabricated NiSe nanoparticle powder for analysis. 4.5 mg of NiSe powder was dispersed in 3 ml ethanol and placed in an ultrasonic bath for 30 min. A stainless-steel substrate was then placed on a hotplate at 100 °C. The NiSe solution is then removed from the ultrasonic bath and 100 µL is immediately dispersed onto both sides of the substrate using a micropipette. After heating for a further 5 min, the electrode is suitably ready to carry required electrochemical experiments. Stainless steel was selected as a suitable substrate due to its resistivity to corrosion, intrinsic electrocatalytic OER activity, and relative low-cost [43]. The final catalyst loading of NiSe on stainless steel is approximately 1.67 mg/cm2.
2.4 Material Characterisation
For a comprehensive understanding of the NiSe surface characteristics, we employed both field emission scanning electron microscopy (FE-SEM, Quanta 200 F FEI) and high resolution transmission electron microscopy (HRTEM, FEI Titan Themis 200) equipped with an energy-dispersive X-ray spectroscopy (EDX) detector operated at 200 kV. To study the crystalline structure of NiSe we utilised X-ray diffraction (XRD) analysis (Malvern Panalytical Empyrean Diffractometer) equipped with Cu Ka radiation (l = 1.5418 Å) and compared with the ICDD-JCPDS powder diffraction file database. To gain insights into the chemical composition and bonding states of NiSe, we employed X-ray photoelectron spectroscopy (XPS) (Kratos Axis Supra). Carbon 1 s (284.6 eV) was used to calibrate the binding energies of other element scanned at high resolution.
2.5 Electrochemical Experiments
The electrochemical performance analysis of NiSe was carried out using an electrochemical station (Autolab PGSTAT 302N), utilising the potentiostat function to apply the potential voltage to the system. NOVA software (version 2.1.5) was used to run the measurements for all experiments. The cell consisted of a typical 3 electrode system with a NiSe working electrode, Ni mesh counter electrode, and Hg/HgO reference electrode. A Hg/HgO reference electrode was selected as a suitable accompaniment to the 1 M KOH (pH = 14) aqueous electrolyte that was used for all measurements. Polarisation curves were obtained from linear sweep voltammetry (LSV) studies in a potential range of -0.2 to 1 V vs. Hg/HgO. All measured potentials vs. the Hg/HgO were converted to the reversible hydrogen electrode (RHE) scale via the Nernst equation [44]:
where ERHE is the converted potential vs. RHE. EHg/HgO is the experimentally measured potential against the Hg/HgO reference electrode, and 0.098 is the standard potential of Hg/HgO at 25 °C. For the electrochemical characterisation, the electrode surface area was kept constant at total value of 3 cm2.
2.6 Electrochemical dye Degradation Experiments
Methyl Orange (MO) was the model pollutant used to analyse the EC activity and effectiveness of the NiSe electrode. The MO dye used for the EC degradation experiment was at an initial concentration of 15 mg/l. 1 M KOH was then added to the solution for analysis. The same 3 electrode cell was again utilised with a constant potential of 0.75 V vs Hg/HgO applied to the circuit. At 15 min time intervals, a sample of the MO dye solution was extracted from the EC experiment and the absorptivity was measured using a UV–Vis spectrophotometer (Perkin Elmer) to analyse the concentration of the dye throughout the degradation process. For these measurements, the standard STD Detector Module attachment was used. The samples were placed in precision glass cells made of optical glass (Hellma).
2.7 Hydrogen Measurements
The H2 generation from the electrochemical cells was measured using a gas chromatograph (GC, Agilent Technologies 7890B equipped with TCD-FID detectors). The two-compartment electrochemical cell separated by a membrane (Nafion) was setup to measure H2 evolution when a constant potential of 0.75 V vs. Hg/HgO was applied to the circuit. NiSe/SS and Ni foam were used as the electrodes and aqueous KOH-based freshwater and MO dyewater were utilised as the electrolyte in the anode and cathode compartments for comparative analysis. The electrochemical compartments were sealed with a rubber stopper, which had an inlet and outlet port, to ensure minimal gas leakage. To push the generated H2 into the GC, the inlet port on the cathode compartment was bubbled with N2 (BOC, 99.995%, 0.8 ml/min) throughout the experiment. The outlet of the cathode compartment was connected to the GC sampling port for continuous injection of sample, measured every 4 min. Area under the curve obtained in each injection was used to quantify the amount of H2 generated.
3 Results and Discussion
3.1 Characterisation
The crystallinity of the as-fabricated nickel selenide catalyst, coated on the stainless steel electrode plate, was characterised using XRD. Significant XRD peaks are evident at 29.9°, 33.5°, 33.57°, 42.9°, 50.7°, 55.5°, and 57.5° (Fig. 1a), affirming the presence of the cubic phase of Ni2Se3 (JCPDS-41-1495) [45]. The remaining strong peaks seen at 50.65° and 74.65° can be attributed to the crystalline phases of austenite iron present in the stainless steel substrate [46, 47]. The morphology and structural characteristics of Ni2Se3 were analysed through high resolution transmission electron microscopy (HRTEM). Figures 1b and c show the HRTEM images at 100 and 10 nm resolutions respectively, displaying Ni2Se3 dispersed uniformly over a silicon substrate. From the figures, Ni2Se3 can be seen to have a rough morphology with a highly open and interconnected network. This highlights the possibility of good electrocatalytic performance due to its highly exposed and active catalytic surface area, enhancing the catalyst’s ability to promote electrolyte accessibility and accelerate electron transport [48]. Furthermore, the crystallite size has been estimated between 20–50 nm (Fig. 2b). Figure 1d shows the diffraction rings that can be observed from SAED diagrams, demonstrating the polycrystalline nature of Ni2Se3. Figure 1e shows the elemental mapping of NiSe, highlighting the uniform dispersion of Ni, Se, and O. The crystallite structure and chemical environment of the Ni2Se3 has been reported in our previous work [49].
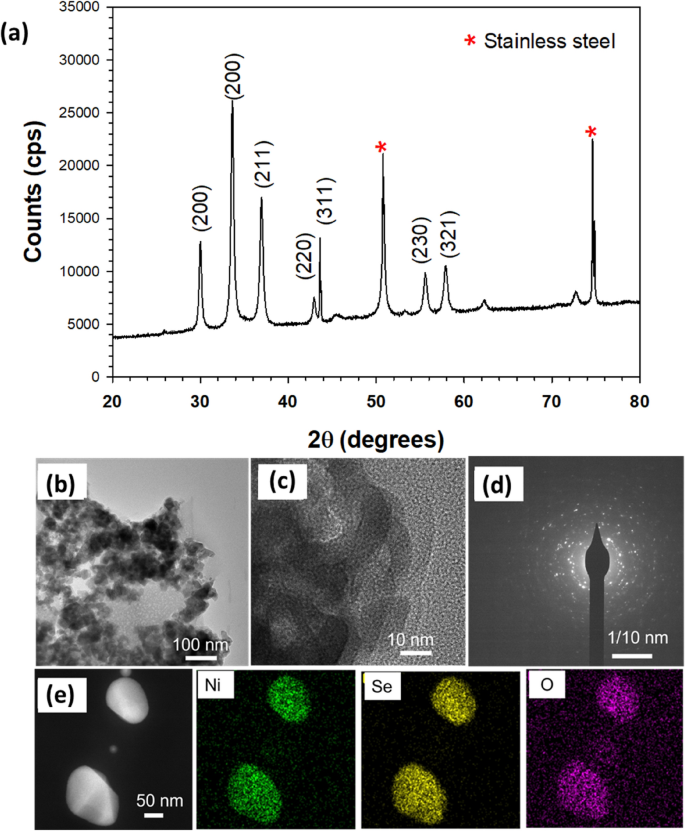
a XRD pattern of Ni2Se3 powder coated on stainless steel substrate (SS). HRTEM images of NiSe at 100 nm b, and 10 nm c, and SAED pattern d; e Elemental mapping of NiSe indicating the uniform dispersion of Ni, Se, and O
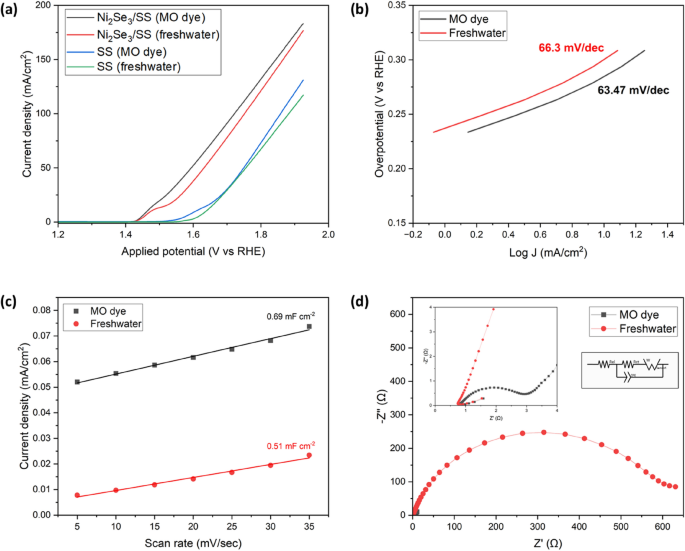
a LSV plots of Ni2Se3 catalyst compared to stainless steel substrate in both freshwater and dyewater electrolyte. b Tafel plot comparing NiSe in freshwater and dyewater; c Scan rate vs current density plot for ECSA analysis; d Nyquist plots of Ni2Se3 in both freshwater and dyewater electrolytes at OCP. Note that the concentration of the electrolyte was 1 M KOH, Ni mesh and Hg/HgO were employed as the cathode and reference electrode, respectively, for all experiments
3.2 Electrochemical Water Splitting Performance
The electrochemical performance of the Ni2Se3 catalyst was analysed through the use of J-V plots obtained from LSV studies, measured under both freshwater and dyewater electrolyte conditions. During the LSV analysis, a potential is applied across the system which engages the oxidation of water molecules at the anode, producing O2, and initiates an electron flow within the circuit. Simultaneously, an ion flow is initiated within the electrolyte, transporting the by-product H+ protons through the membrane to the cathode. Here, the protons undergo reduction and combine with the electrons to produce H2. The water splitting reactions occurring at the anode and cathode within an alkaline environment can be seen through Eqs. 2, 3, 4 [50, 51]:
Figure 3a illustrates the LSV plots of Ni2Se3-coated stainless steel (SS) electrodes and pristine SS electrodes in both freshwater and MO dye electrolyte. A significant increase in current density can be clearly seen when the Ni2Se3 catalyst is utilised. The LSV shows a value of 183 mA/cm2 at 1.92 V vs RHE for Ni2Se3, an increase of 71.5% when compared with the SS electrode (131 mA/cm2) at the same applied potential. Notably, a peak is visible in the Ni2Se3/SS (freshwater) LSV curve at 1.47 V vs RHE which can be attributed to the in-situ formation of NiOOH due to the oxidation of Ni2+ to Ni3+ [52]. Figure 3a also displays an increase in electrocatalytic activity when the MO dye electrolyte is utilised compared to freshwater, with the current density rising from 176.7 mA/cm2 to 183 mA/cm2. This increase in current can be relayed to the oxidation of the MO dye molecules through the generation of hydroxyl radical (·OH) at the anode, as shown through Eqs. 5, 6, 7 [53,54,55]:
where A is the anode and P is the pollutant. Through the oxidation process, the generation of electrons contributes to an increase in the proton reduction rate at the cathode, which in turn leads to an overall increase in the cell reaction rate and H2 production. Interestingly, the additional electrons produced benefit from the oxidation of Ni2+ to Ni3+, as the newly formed Ni3+ active sites present in NiOOH contribute greater electron-accepting properties due to additional 3d electron orbits. NiOOH can therefore be attributed as being a key species in the oxidation of the MO dye molecules, further emphasised by the similar timing of the onset potential in the oxidation of the dye and the onset potential for the formation of NiOOH (Fig. 3a) [56]. Ni2Se3’s electrochemical performance was further assessed through the comparison of its activity to a commercial water oxidation catalyst, RuO2. Figure S1 shows a LSV study of both RuO2 and Ni2Se3 in the MO dye electrolyte. The results shows that Ni2Se3 is highly competitive with its commercial counterpart throughout the analysis, displaying a similar current density and even higher above 1.85 V vs RHE. It should be noted however that RuO2 isn’t the optimal candidate for water oxidation in alkaline electrolysis, as highlighted in the Pourbaix diagram [57].
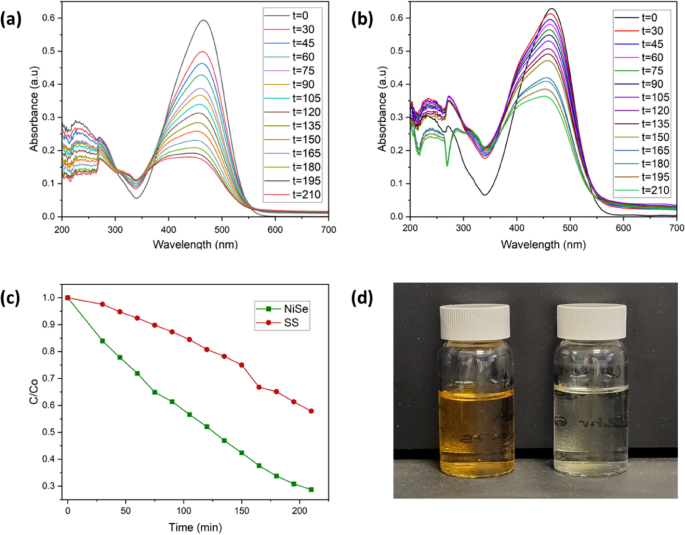
Dye degradation analysis for a Ni2Se3-coated SS anode and b pristine SS anode; c C/C0 plot comparing the degradation rate for both anode materials; d image show the solution before (left) and after (right) Ni2Se3 induced dye degradation
Tafel analysis stands out as a valuable technique that provides simultaneous insights into both activity and kinetics [58, 59]. Specifically, the Tafel slope, observed through the relationship between Log J and overpotential (V vs. RHE), offers a clear view of the catalyst’s susceptibility to self-oxidation and double-layer charging effects [60]. By examining data derived from the Tafel slope, we can gauge the extent to which we need to raise the overpotential to achieve a tenfold increase in the reaction rate. Figure 3b compares the results from Tafel analysis of Ni2Se3 in both freshwater and dyewater electrolytes. The Tafel analysis was potentiostatically analysed through gradually increasing the potential in a chronoamperometry analysis and recording the current achieved after 180 s. This method is preferred as the use of potentiodynamic polarization curves (LSV/CV) is detrimentally misleading, irrespective of what scan rate is being used [60]. The current density was also measured in a region at least 120 mV beyond the equilibrium potential to ensure optimal accuracy of produced results [61]. From Fig. 3b it can be seen that in the dyewater electrolyte there is a decrease in the Tafel slope value compared to the normal freshwater electrolyte, going from a value of 66.3 to 63.47 mV/dec. Therefore, less input potential is required to increase the reaction rate in the MO dye-based electrolyte solution. Overpotential is classed as a key parameter when analysing the catalytic performance of a material, with a high overpotential resulting in a decrease in energy efficiency [62]. Again, it is important to measure the overpotential potentiostatically. Figure S2 displays a chronopotentiometry analysis at 10 mA/cm2 resulting in an overpotential value of 272 mV for Ni2Se3 under dyewater electrolyte conditions. The electrolyte also showed an effect on the overpotential value of the Ni2Se3, increasing to 290 mV in the freshwater electrolyte. Theoretically, the overpotential value for OER can be further reduced via co-catalyst coating (e.g., NiOx, FeS2) and the selection of other highly conducting substrates for the Ni2Se3 coating process.
An important benchmarking parameter for a good electrocatalyst is a high electrochemically active surface area (ECSA), which can directly result in an effective OER or HER performance [63]. To determine the ECSA of the catalysts, their double-layer capacitances are measured utilising cyclic voltammetry (CV) analysis in a potential range where no apparent faradaic process occurred [64]. The ECSA for Ni2Se3 was estimated from the electrochemical double-layer capacitance of the catalytic surface and again was studied in both dyewater and freshwater electrolytes. For each analysis, CVs were run in a 100 mV potential range around the open circuit potential (OCP) at scan rates between 5 and 35 mV/s, at a constant interval of 5 mV/s. The current values against each scan rate were collected, and the current vs scan rate was plotted. The ECSA of the catalysts can be estimated using Eq. 8 [64]:
where CDL is electrochemical double-layer capacitance and Cs is the specific capacitance of the sample or, in the case of a material, the specific capacitance of an atomically flat planar surface measured under the same electrolyte conditions. For this experiment, the Cs value for Ni2Se3 was held constant at 40 μF/cm2, adopted from previous reports [65]. The CDL of the catalysts is estimated through Eq. 9:
ic is the double-layer charging current derived from the CV study (non-Faradic region), “ν” is the scan rate (mV/s). The CDL value can be obtained from a straight line with a slope equal to plotting ic as a function of ν. From Fig. 3c, the CDL values of Ni2Se3 in freshwater dyewater are calculated, obtaining a value of 0.51 mF cm−2 under freshwater electrolyte conditions and a value of 0.69 mF/cm2 in dyewater. These values were then substituted into Eq. 8, to obtain ECSA values of 38.14 and 51.89 cm2 for freshwater and dye water respectively. This larger ECSA value found under dyewater conditions provides one explanation is to the greater electrocatalytic activity exhibited by the dyewater electrolyte when compared to freshwater.
Electrochemical Impedance Spectroscopy (EIS) is as an effective tool in electrochemistry, offering valuable insights into the charge transfer resistance at electrode/electrolyte interfaces [66, 67]. This method allows a detailed understanding of how the electrocatalyst performance in water pollutants degradation is influenced by the different elements contributing to resistance within the electrochemical system, including the catalyst, membrane, and crucially for this work– electrolyte [68, 69]. Hence, EIS was utilised to investigate reasons behind the improved electrochemical performance of Ni2Se3 in the MO dye-based electrolyte compared to freshwater. Figure 3d shows the Nyquist plots of both electrolytes utilising our Ni2Se3 catalyst. The analysis was carried out at the potential perturbation of 10 mV amplitude in the frequency range between 100 kHz and 0.01 Hz, and at the OCP of the system. Analysing the system at the OCP allows for the perturbation signal to be superimposed over a dc signal, ensuring that the current flowing in the cell is zero [68]. This state allows for minimal impact from the catalyst on the cell’s resistance, allowing for a more accurate analysis of the electrolyte. The size of the semicircles in Fig. 3d directly corresponds to charge transfer resistance at the electrode/electrolyte interfaces: a larger semicircle indicates higher resistance, while a smaller one denotes lower resistance. Notably, the MO dye-based electrolysis demonstrated significantly lower charge transfer resistance compared to its freshwater counterpart. This disparity between the electrolytes was attributed to organic compounds within the dye water allowing for greater ionic flow and therefore less resistance. This result from the Nyquist plots is consistent with the results from the LSV and Tafel studies, explaining the improved OER kinetics as a result of less resistance at the electrode/electrolyte interfacial region.
To evaluate the durability of the Ni2Se3/SS electrode in water oxidation reactions, a chronopotentiometry test was carried out at a current density of 10 mA/cm2. Figure S3 demonstrates that the voltage of the cell remained consistently at approximate value of 1.45 V RHE over a period of 12 h, showing considerable stability when immersed in a dyewater based electrolyte. To further test the stability of the Ni2Se3 anode a cyclic stability analysis was performed, allowing for the evaluation of the stability under transient conditions at a range of current density and potential values. Hence, a CV measurement was continuously conducted for a total of 5000 scans over the potential range of 1.18 to 1.66 V vs RHE, at a scan rate of 0.1 V/s. The first and last cycles of the measurement were then plotted together to highlight the required information about the OER stability. The resultant graphs for both freshwater and dyewater-based studies can be seen in Fig. S4. The effect of the cyclic stability analysis on the overall electrocatalytic performance can be studied by comparing the current density between the 1st and 5000th cycles at a specific applied potential. Taking the peak of the CV graph at 0.66 V vs Hg/HgO, it shows a decrease of 12.6% for the freshwater electrolyte and a 11.3% decrease for the dyewater electrolyte. These results underline our Ni2Se3 catalysts high and consistent stability in both electrolyte mediums. Figure S4a also shows the increased Ni2+/Ni3+ redox reaction in the 5000th cycle when compared to the 1st cycle, highlighted by the larger peaks at 0.54 V vs Hg/HgO for oxidation and 0.41 V vs Hg/HgO for reduction. The continuous promotion of NiOOH species at the catalyst enables constant active sites generation for the oxidation of the dye pollutant, further establish our Ni2Se3 capability for long-term effective functionality.
3.3 Electrochemical Dye Degradation
The electrochemical degradation of the dye pollutants can occur via two main routes, namely direct and indirect electrochemical oxidation. In the instance of direct electrochemical oxidation, electron transfer occurs at the anode surface without any participation from other substances. During this reaction, the pollutants present in the dyewater are then oxidised at the anode surface, destroying the dangerous organic contaminants. For indirect electrochemical oxidation, pollutants in the wastewater are oxidised as a result of the formation of active species at the anode surface, facilitating electron transfer between electrode and pollutants. Hence the formation of NiOOH at our Ni2Se3 catalyst surface helps facilitate the increased production of hydroxyl radicals (Eq. 5–7), which acts as a strong oxidising agent to degrade the pollutants [27, 70]. It is important to note also that the oxidation of dye pollutants at the anode directly competes with the OER, meaning the efficiency of the degradation process is not likely to reach 100%. Hence, the evolution of oxygen at the anode impact the rate of pollutant degradation within the system [28].
The dye degradation performance for both a pure SS electrode and Ni2Se3 coated SS electrode was tested using 50 ml of MO dye solution, at an initial concentration of 15 mg/l, with 1 M KOH at a constant applied potential of 1.67 V vs RHE. The results of the dye degradation analysis for Ni2Se3 and SS are shown in Fig. 4a and b, respectively. Both graphs show the results from analysing the dye degradation using the spectrophotometer, where the MO Dye shows a peak at around 450 nm. Both Fig. 4a and b show the dye steadily decreasing but the Ni2Se3 coated electrode is shown to decrease the pollutant at around twice the rate of the pristine SS electrode. This highlights that the Ni2Se3 anode is a strong electrochemical oxidiser of the dye contaminants. The apparent rate constant (Kapp) and degradation efficiency (η) were calculated using Eqs. 10 and 11, where C0 is the initial degradation level of the dye molecules and Ct is the concentration of the dye molecules various irradiation time (t):
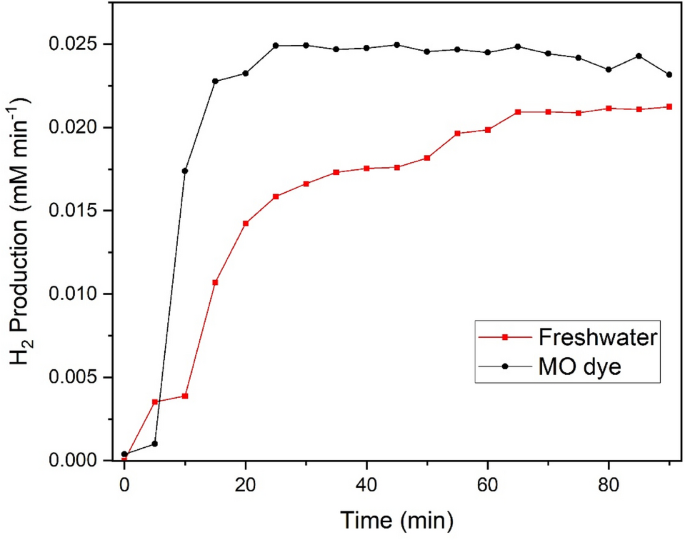
Measured hydrogen production from both freshwater and dyewater
From Eq. 10, the apparent rate constant for SS dye degradation can be calculated to be at a value of 0.002 min−1, whereas for Ni2Se3 degradation analysis the value is calculated to be 0.005 min−1. The degradation efficiency of the Ni2Se3 catalyst based dye degradation can be calculated from Eq. 6 to give a value of 71.9%, whereas the SS analysis produced a degradation efficiency value of 43.9%. Figure 4d shows the clear visual result from the 3 and a ½ hour degradation of MO dye using a Ni2Se3-coated SS anode. The vial on the left shows an initial sample of the dye solution used in the experiment while the vial on the right shows the same solution but post-degradation. The yellow/orange colour of the dye can be shown to have almost completely disappeared, with only a possible very slight tinge of colour left in the post-analysis sample. This highlights the effectiveness of the electrolysis method utilising a Ni2Se3 catalyst in eliminating the dye pollutants from the solution.
Goren et al., [71] demonstrated the electrocatalytic degradation of MB dye using flexible graphite based anode with a higher efficiency, > 98%, and compared the results with a number of other anodes (SnO2, Pb/PbO2, Fe). We can evaluate from the results that many semiconductor-based anodes have a challenge in removing the dye pollutants completely within the provided environment or time duration. Another experimental study by Aketer et al. [72] emphasised that SS-based electrochemical MO dye degradation is unable to achieve complete pollutant removal, but can be improved by the addition of Fe2+ in the solution. A wider range of electrochemical dye degradation studies [73,74,75,76] are recommending that processing parameters such as applied potential, initial dye degradation, pH, and additional oxidation agents are critical to achieving complete dye degradation. Therefore the dye degradation rate in this work can be further improved with extending the electrocatalysis reaction duration, tuning the pH of the solution to an appropriate level, and or modifying the Ni2Se3 anode through doping to focus on improving the catalytic active sites [77, 78].
3.4 Hydrogen Recovery
The hydrogen analysis was carried out using the same experimental set-up as all electrochemical and dye degradation analysis. Figure 4 shows the results of the hydrogen generation measured using the GC, comparing a cell setup up of Ni2Se3 at the anode and Ni mesh at the cathode in both freshwater and dye pollutant water. Again, a constant applied potential of 1.67 V vs RHE was provided to the system. The GC collected a gas sample from the system every 4 min and the hydrogen production was calculated by integrating the area underneath the hydrogen production curve. The results from Fig. 4 show that through using the MO dye as the electrolyte feedstock, the production value of hydrogen actually increased when compared to just normal freshwater. The MO dye electrolyte was shown to produce on average 0.81 L cm−2 of H2 per day, a 28.57% increase from the freshwater electrolyte which produces approximately 0.63 L cm−2 of H2 per day. This would be as a result of dye pollutants oxidising during the reaction, as highlighted previously through Eqs. 4, 5, 6. This in turn improves the catalytic performance of the reaction and results in increasing the overall hydrogen production through the increased production of electrons.