Article Content
Introduction
Advanced technologies rely on sophisticated analytical instruments based on spectrometry, electrochemistry, and separation methods including chromatography and electrophoresis. The analytical instruments establish selective and sensitive analyses in the medical, pharmaceutical, agricultural, food, and environmental sciences. Thus, analytical science plays a crucial role in research across all areas of chemistry and has contributed significantly to scientific progress.
Researchers have also developed numerous portable devices for onsite measurements in the field, which includes medical diagnostics, food quality control, and environmental analysis. Portable absorbance detectors have facilitated colorimetric analysis outside of equipped laboratories and are now commercially available. Researchers have also reported different types of miniaturized and portable absorbance detectors with light-emitting diodes and photo detectors [1,2,3,4,5,6]. On the other hand, paper-based analytical devices (PADs) have served as an effective technology for point-of-care testing and onsite analysis since 2007 [7]. Many review articles have summarized the general concepts and applications [8,9,10] such as use in medical diagnostics and pharmaceutics [11, 12], onsite environmental analysis [13], and the home-based testing of food quality [14]. In addition to our own work, herein we also review other studies of PADs and the miniaturized detectors that have been developed to permit onsite analysis [15].
These portable analytical devices are considered to meet the ASSURED criteria proposed by the World Health Organization (WHO) and are anticipated to play a significant role in achieving the United Nations’ Sustainable Development Goals (SDGs) because some of them are strongly related to chemical analyses. For example, water quality analysis is essential for supplying safe water. Currently, 2 billion people in the world have no access to safe drinking water, and 3.6 billion people use water that is untreated. The WHO reports that safe water, sanitation and hygiene (WASH) could prevent 1.4 million deaths per year [16]. Water pollution remains a major issue in many regions, which include developing countries, and is being addressed as one of the SDGs. For continuous water quality management in areas with insufficient facilities and power supply, it is essential to achieve low-cost and simple chemical analyses onsite.
Over the past decade, we have developed various PADs and portable absorbance detectors to facilitate chemical measurements in the field. In this review, we summarize our work on the development and application of PADs and portable absorbance detectors employing light-emitting diodes (LEDs) as both light sources and detectors. Our research includes the development of PADs based on novel principles and their application to the determination of target analytes in real-world samples. Additionally, we have developed portable absorbance photometers for the analyses of biological samples and environmental monitoring. Several types of PADs with different designs and detection principles have been developed for the measurements of acids, bases, metal ions, and small molecules. Conversely, portable photometers have been constructed using the principle of paired emitter–detector light-emitting diodes (PEDDs) [3,4,5,6] because LEDs have several advantages for optical measurements: small size, low-power operation, and the ability to function as both a light source and a light detector. These characteristics of LEDs have established the miniaturization of several optical devices. We have developed PEDD-based photometers that are suitable for onsite analysis because of their portability. In this review, we describe the PADs and PEDD-based photometers and their applications to real samples rather than spiked ones.
Fabrication of PADs
Many researchers have reported several methods to fabricate PADs. In one of the first reports, PADs were fabricated by photolithography [7], and thereafter researchers developed several fabrication methods such as wax printing, ink-jet printing, cutting, stamping, and hand-drawn methods [17]. Among them, photolithography, wax printing, ink-jet-printing, and cutting methods permit flexible, precise, and reproducible designs. Conversely, wax printing [18], ink-jet printing [19], and cutting [20, 21] methods are facile and cost-effective. Unfortunately, the manufacturers have stopped supplying wax printers, although such a process is the most convenient to fabricate PADs. Therefore, a simple, easy, low-cost, and precise fabrication method is needed for the development of PADs.
Many materials have been employed to fabricate hydrophobic barriers on paper substrates. Our group fabricates PADs using a wax printer provided by Xerox that is not commercially available at the present time. We also use a cutting method via a cutting plotter that is one of the easier methods for fabrication. Future research requires a simple fabrication method that will be low-cost, easily available, and precise, and could serve as an alternative to wax printing.
PADs for titrations
Although classic titration requires a wide range of glassware, large volumes of samples and standard solutions, and troublesome operations, these methods confer several advantages. The most important and useful characteristic of titration methods is the lack of a need for calibration curves. Thus, the results directly lead to the amount or concentration of an analyte without the need to construct a calibration curve. To obtain these advantages when using PADs, we developed titration PADs that permit the measurement of acids and bases [22] as well as calcium (Ca2+) and magnesium (Mg2+) [23].
The PAD for acid–base titrations was designed as shown in Fig. 1 [22]. This PAD consists of a circle connected with ten radially located channels. Each channel equips two circle zones for reaction and detection. When a solution is dropped into the introduction zone (center circle), it spreads into a circular shape due to capillary action, while simultaneously flowing into the ten channels. Titrant solutions with different concentrations are pre-deposited in each reaction zone, and an indicator is introduced into a detection zone. After dropping the sample solution into the sample introduction zone, the results are obtained in less than a minute. The titrant (primary standard substance) is pre-deposited into each reaction zone where it reacts with the introduced sample solution, and excess analyte that is not consumed by the titrant reaches the detection zone, which causes a color change. Therefore, the boundary concentration at which a color change occurs in the detection zone is the end point, and the result can be read visually.
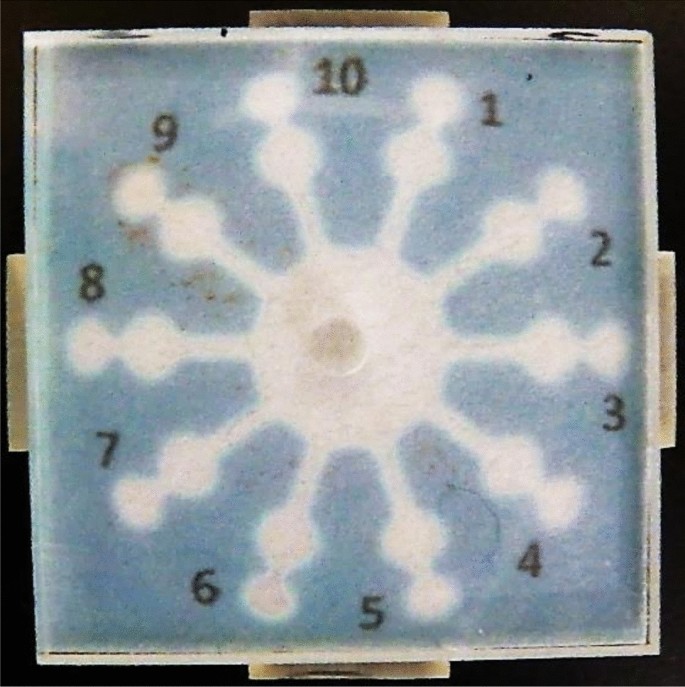
PAD for acid–base titration (adapted from Ref. [22] with permission from The American Chemical Society)
Acid–base titration has been used to quantify known concentrations of strong acids and strong bases such as hydrochloric acid, nitric acid, and sodium hydroxide with an endpoint that involves the use of phenolphthalein as an indicator to correctly identify the analyte concentrations. PADs have been used to accurately measure the concentration of acetic acid, which is a weak acid. However, ammonia showed an unclear endpoint due to the deviation of the equivalent point from the color-change range of phenolphthalein. This problem was solved by changing the indicator from phenolphthalein to bromocresol purple. Therefore, the PADs for acid–base titrations could also be used to measure weak acids and weak bases when a suitable indicator is selected.
To demonstrate the applicability of the titration PADs to onsite analysis, we brought the titration PADs to a volcano where acidic hot spring water flows out, and we measured the acidity of the hot spring water outside. The hot spring water samples reacted immediately when contacting the PADs for measurement. Then, samples were brought to the laboratory and a classic titration method was performed the next day. The results of the PADs showed good agreement with those of the classic acid–base titration performed in the laboratory.
The PADs also achieved chelation titrations of Ca2+ and Mg2+ with ethylenediaminetetraacetic acid (EDTA) as the titrant [23], while using the same basic detection principle as that of classic chelate titration. The PADs were prepared by adding a buffer solution at pH 10 or 13 to all hydrophilic zones and depositing EDTA solutions with different concentrations in the reaction zones with an indicator at a constant concentration in the detection zones. Metal ions in a sample solution react with EDTA in the reaction zones, and subsequently flow into the detection zones. When the amount of the metal ions exceeds the amount of EDTA in a reaction zone, the excess metal ions react with the indicator, which results in a color change from blue (free indicator) to purple (complex of the indicator and the metal ion). In the PADs for chelate titration, the length of the flow channel connecting the reaction zones and the detection zones had to be longer than in the case of acid–base titration because of the time required for EDTA and buffer components to dissolve in water. By lengthening the flow channel, we were able to control the time that the solution flows from reaction zones to detection zones. The concentrations of Ca2+ and Mg2+ were determined by measuring the total amount of Ca2+ and Mg2+ at pH 10, and then subtracting the separately measured Ca2+ concentration at pH 13 from the total amount to calculate the Mg2+ concentration.
In general, an ammonia buffer solution adjusts the pH at 10 for measuring the total amount, and a KOH buffer solution plays the role of a buffer at pH 13 to measure only Ca2+ in classic chelate titrations. In PADs, however, the reagents added to the channels and zones are in a dried state, so volatile ammonia is not suitable as a buffer. Therefore, instead of using ammonia as a buffer, we used N-cyclohexyl-3-aminopropanesulfonic acid (CAPS), which is a solid at room temperature and has a pKa of 10.6.
The PADs were used to determine the total concentrations of Ca2+ and Mg2+ (pH 10) and the concentration of Ca2+ (pH 13) at the minimum measurable concentrations of 1.0 and 4.0 mM, respectively. The measurable minimum concentration of Ca2+ was higher than that of the total concentration due to the adsorption of Ca2+ by the paper substrate at pH 13. In practical applications, the PADs were used to successfully measure mixtures of Ca2+ and Mg2+ and were also applied to the analyses of commercially available mineral water, seawater, and river water. These results demonstrated that the PADs could be applied to the differential quantification of Ca2+ and Mg2+. The results of the PADs were validated via classic titration and showed consistent results.
PADs for heavy metal ions
The measurement of heavy metal ions using PADs was first reported by Nie et al. using electrochemical detection [24] and by Hossain et al. using colorimetric detection [25]. Henry’s group has reported the measurement of metal ions using PADs based on color intensity [26] and color distance [27]. We have also reported PADs for measuring heavy metal ions based on colorimetry, colorimetric distance measurement, and chemiluminescence methods. The development of PADs has permitted onsite measurements of iron(II), nickel(II), copper(II), and chromium(III) and (VI).
Measurement of iron(II)
Popular colorimetric reagents for iron(II) (Fe(II)) include 1, 10-phenanthroline (Phen) and bathophenanthroline (Bphen), which are also excellent reagents for the measurement of Fe(II) using PADs. We developed PADs for measuring Fe(III) from the color intensity of the colorimetric reagent, Phen. The principle is the same as that reported by Henry’s group [26] where hydroxylamine, polyacrylic acid, and a Phen solution were dissolved in an acetate buffer solution and added to the four detection zones arranged around the center circle [28]. When a solution containing Fe(II) and Fe(III) was dropped into the sample introduction zone, an Fe(II)–Phen complex was formed in the detection zone, which turned the color of the solution to red. The intensity of the red color could be used to quantify the concentration of iron ions by using software to process the image. When these PADs were applied to the determination of different forms of iron ions in hot spring water, the results were consistent with those obtained by spectrophotometry. The limit of detection (LOD) of these PADs was estimated to be 12 ppm.
To further improve the sensitivity of iron measurement, we equipped a PAD with a distance readout [29]. This PAD had a sample reservoir that would allow the continuous flow of a sample in the detection channel. A 1-mL micropipette tip served as a sample reservoir that was fixed with a PDMS block on the introduction zone. The detection channel contained Bphen as a colorimetric reagent, and Fe(II) ions reacted with Bphen as they flowed into the detection channel, which resulted in a colored bar the length of which depended on the concentration and volume of the Fe(II) solution. Thus, 1 mL of a sample solution was continuously introduced into the PAD with a distance readout, and the LOD was significantly improved when it was lowered to 20 ppb, which is comparable to the sensitivity of inductively coupled plasma-optical emission spectroscopy. The LOD was 150-fold lower than that of the previously reported PAD with a distance readout using a small sample volume (50 μL). The PADs were also successfully applied to the measurement of iron ions in hot spring-water with a concentration that had a range of tens of ppb.
Measurement of chromium
We have developed a compact chemiluminescence detector for PADs to improve the sensitivity for Cr(III) [30]. The PADs were equipped with six flow channels—each possessing an injection zone, a reaction zone, and a waste zone (Fig. 2). The chemiluminescence detector for the PADs was constructed using optical fibers. The ends of six optical fibers were located in the reaction zones of the six channels on the PADs. The optical fibers were bundled in a manner that placed each at the front of the photovoltaic surface of a small photomultiplier tube module. The reactions are based on catalytic enhancement in the chemiluminescence of luminol when in the presence of Cr(III). Six Cr(III) solutions were dropped into the reaction zones in advance and dried, and subsequently the chemiluminescent reagents were added to the injection zone to generate chemiluminescence in the reaction zones. The chemiluminescence signals quantified Cr(III) with a LOD of 0.020 ppm and a limit of quantification of 0.066 ppm.
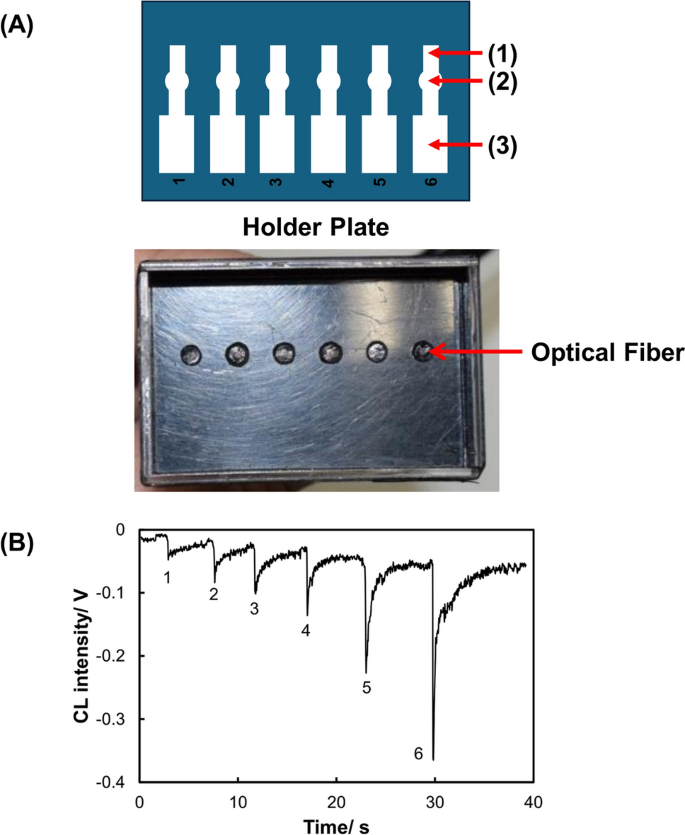
Design of a PAD and holder for chemiluminescence detection of Cr(III). A PAD and holder; (1) reagent introduction zone, (2) sample introduction zone, (3) waste channel, B response curve for Cr(III) (adapted from Ref. [30])
Although we accomplished a sensitive measurement of Cr(III) via chemiluminescence, Cr(IV) should also be a target in environmental science because of its high toxicity. A differential determination between these two compounds is an important issue because the chromium in Cr(III) and Cr(VI) in aqueous solutions normally exists in different states of oxidation. Therefore, we developed PADs with the capability of discriminating between Cr(III) and Cr(VI). A colorimetric reaction is based on the complex formation of Cr(VI) with diphenylcarbazide (DPC) and on the oxidation of Cr(III) to Cr(VI) via Ce(IV) [31]. The design of the PADs is shown in Fig. 3. The sample reservoir is located in the center of the PADs, and three flow channels extend radially from the central circle to the left and right sides, respectively. The left channels detect Cr(VI) while the right channels detect the total amount of Cr(III) and Cr(VI). The left channels contain only DPC in the detection zones whereas the right channels consist of the reaction zones for the oxidation with Ce(IV) and the detection zones for the complex formation with DPC. In the right channels, Cr(III) was converted to Cr(VI) by Ce(IV) in the reaction zones located before the detection zones. Although the conversion efficiency was almost 100%, we noticed that Ce(IV) inhibited the complex formation reaction between DPC and Cr(VI). As a consequence, we achieved a speciation of chromium by correcting the effect of Ce(IV), which allowed measurement of the total chromium concentration.
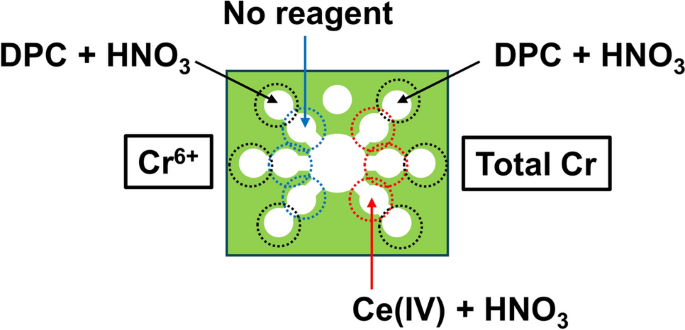
Design of a PAD for the speciation of Cr(III) and Cr(VI) (adapted from Ref. [31] with permission from Springer Nature)
On the other hand, the utility of the colorimetric PADs using DPC was confirmed during a remote analysis of Cr(VI) in Ethiopia. The PADs permitted measurement of the total chromium concentration in soils and crops in remote industrial areas of Ethiopia. The PADs were designed and fabricated in Japan, and then transported to Ethiopia. The results of that study revealed that the soil and crops in industrialized areas of Ethiopia were significantly contaminated as extremely high concentrations of chromium were quantified by the PADs, which demonstrated the potential to achieve remote analysis of environmental pollutants [32].
Coupling of coprecipitation preconcentration for Cu(II), Ni(II), and Cr(VI)
PADs with colorimetry are the most frequently investigated type, because the processing of data is simple and easy. However, the colorimetric PADs generally show sensitivity that is lower than that of standard spectrophotometric methods. To enhance sensitivity, the PADs were successfully improved by coupling with coprecipitation for preconcentrating Cu(II) [33], Ni(II) [34], and Cr(VI) [35]. In the coprecipitation preconcentration of these metal ions, Al(OH)3 was an excellent precipitant. The coprecipitation method concentrated each metal ion, and this resulted in an improvement that was 100–250-fold greater than the existing limit of detection. The resultant PADs showed a level of sensitivity that agreed well with that of inductively coupled plasma-optical emission spectroscopy. The proposed methods made it possible to analyze trace levels of metal ions in environmental water with high sensitivity. Thus, the coupling of coprecipitation enrichment with the PADs is expected to be useful for environmental monitoring without the need for expensive analytical equipment, particularly when used in developing countries.
PADs for inorganic anions
The determination of inorganic anions is also a challenge for environmental analysis. For example, nitrogen and phosphor are important nutrients that also could be contaminants at high concentration levels. Thus, for nitrites and nitrates we developed PADs that have a layered structure [36]. The detection zones contain a Griess reagent that generates a red color product when reacting with nitrite. The red color appears when nitrites are introduced from the sample introduction zone via a micropipette. Images of the detection zones were captured by a scanner and processed to obtain the color intensity. A calibration curve was constructed by plotting the color intensity against the concentration of nitrites.
The PADs for nitrites are also employed for the determination of nitrates via a coupling that reduces nitrate to nitrite. This reduction is achieved by sandwiching layers of zinc powder between the introduction and detection zones. When the reaction zone layers contain zinc, the total concentration of nitrites and nitrates is expected to be measured, and the nitrate concentration is then calculated by subtracting the nitrite concentration from the total concentration of nitrites and nitrates. However, we noticed that an incomplete reduction of nitrate to nitrite decreased the color intensity of nitrite in the presence of zinc. Therefore, when determining both nitrites and nitrates, we proposed the construction of three calibration curves for nitrites in the absence of zinc, nitrates in the presence of zinc, and nitrites in the presence of zinc. Using the layered PADs in the presence and the absence of a reaction zone between the introduction and detection zones, the measurements of nitrites and nitrates could be completed within 1 h.
The measurement of phosphate is also important, because it is an important nutrient for the growth of plants and animals whereas high concentration levels contaminate natural water. The analysis of phosphate is generally achieved via spectrophotometry using the molybdenum blue method. The principle of the molybdenum blue method is also applicable to the PADs, as shown in previous studies [37, 38]. Those studies, however, have reported difficulties in the use of onsite analysis. For example, the reagents must be added to begin the measurement [38] and samples must be precisely introduced via micropipette. To improve these issues, we employed a dipping method for sample introduction that requires no micropipette; a holder is fabricated using a 3D printer to fix the PAD, and a homemade photo studio box is used to capture the image of the PAD onsite.
Among the previously reported PADs for phosphate, a layered PAD would be the most promising version because it prevents the reaction of a molybdate with a reductant [37]. However, the previously reported PAD requires a precise volume of sample introduction with a micropipette. Conversely, the proposed dipping method is user-friendly because there is no need to use a micropipette to introduce a sample. The sample is introduced by immersing the introduction zone into the sample solution at a certain time, and the introduction volume is controlled according to time.
Therefore, we developed a PAD for phosphate determination, which employs a layered structure and a dipping method for sample introduction to achieve portable and user-friendly analysis [39]. In the layered PAD for the measurement of phosphate, the first layer contains a molybdenum reagent consisting of ammonium molybdate, sulfuric acid, and potassium antimonyl tartrate. A second layer consists of ascorbic acid as a reductant. Then, the first and second layers must firmly contact one another to efficiently produce the blue product. To that end, a holder to fix the two layers was fabricated via a 3D printer. In addition, the images of the devices were captured with a smartphone using a homemade photo studio box to maintain constant illumination conditions. Using these simple tools allows the measurement of phosphates outside of laboratories or in poorly equipped laboratories.
While the PAD measured phosphate at the concentration range of 1–10 ppm, further low concentrations, e.g. lower than 1 ppm, must be accurately quantified for monitoring contamination of natural water. For practical analysis, we succeeded in quantifying the measurement of phosphate concentrations by combining solid-phase extraction with anion-exchange resins. The solid-phase extraction improved the limit of detection by a factor of 10, which achieved a sensitivity sufficient to measure phosphate in real samples including river water, soil, and toothpaste.
Many PADs determine the concentration of an analyte by measuring the color intensity generated by a reaction product that is read using an external device such as a digital camera, scanner, personal computer, and smartphone. By contrast, a distance readout visually provides the signal and quantifies an analyte without the use of external devices, as demonstrated in the measurement of Fe(II) in our study [29]. We proposed a method to determine borate using a distance readout in which the length of the colored channel depends on the retention behavior of brilliant green dye, which has a positive charge, according to the principle of ion-pair chromatography. Initially, borate reacts with chromotropic acid to form a negatively charged complex, and then the complex produces an ion-pair in the brilliant green dye. Brilliant green dye was printed at the entrance of the detection channel for a distance readout, and subsequently the complex of borate with chromotropic acid was introduced into the detection channel. The brilliant green dye was dissolved in the solution containing the complex of borate with chromotropic acid and flowed in a retaining manner in the detection channel based on the chromatographic principle. We oxidized the paper substrate to introduce carboxyl groups with negative charges. Therefore, the brilliant green dye with a positive charge strongly interacts with the negatively charged surface of paper while the ion-pair of the complex and the brilliant green dye weakly interact with the negatively charged surface of paper. Consequently, the length of the color of the brilliant green dye depended on the concentration of the borate complex combined with chromotropic acid [40].
The colored distance of brilliant green dye is visually readable, so the borate concentration in the sample solution is determined by measuring the distance by simply using a ruler. The PADs were printed with a 107 mm straight channel extending from the circular sample introduction zone, and a band of brilliant green dye was applied to the connection between them. After the sample was introduced, the retardation factor (Rf) was calculated from the distance to the top of the flowing solution and the distance of the color band. Since Rf correlated with the borate concentration, we could quantify the borate concentration using the calibration curve. We applied the PADs to the measurement of the borate concentration using a commercially available eye dropper. The obtained values were comparable to those measured using the conventional azomethine-H method.
PADs for food analysis
The screening of chemical contaminants, biological hazards, and allergens in food is a critical concern for the food industry, as these substances can cause serious illness and, more importantly, could lead to the death of consumers. From the suppliers’ perspective, this issue incurs significant expense and causes delays in delivery to customers when products are recalled. Currently, many conventional methods such as chromatography and spectroscopy [41,42,43,44] are employed for food quality control and to deliver accurate analytical results. However, these methods require well-equipped laboratories, skilled professionals, expensive and large quantities of reagents, and involve complex sample preparation before analysis, all of which are necessary to achieve reliable results. Therefore, these high-performance methods are not always ideal for onsite food surveillance.
PADs show promising potential to revolutionize food safety and quality control by meeting the ASSURED criteria suggested by the WHO [45]: affordable, sensitive, specific, user-friendly, rapid, robust, equipment-free, and deliverable [46]. Consequently, the development of PADs for applications in the food industry has been proposed over the past few decades. The developed PADs cover a wide range of chemical contaminants, biological hazards, and allergenic compounds such as pesticides [47, 48], inorganic ions [49, 50], organic compounds [51, 52], pathogens [53, 54], heavy metals [55, 56], and allergens [57, 58]. Several approaches have been explored to bring PAD features in line with ASSURED criteria. However, most PADs continue to require micropipettes for precise and accurate sample introduction, which poses a challenge for user-friendly design and home-use applications. Consequently, many researchers have attempted to develop PADs that function without the need for micropipettes.
In 2022, Seetasang and Kaneta introduced dip-and-read PADs equipped with chromatographic separation for indole analysis in shrimp [59]. The design of PADs consists of a sample introduction zone, a flow channel, and a detection zone. After depositing Ehrlich’s reagent in the detection zone to react with the indole compound, the zone was laminated using a heat press to prevent solvent evaporation during sample introduction via the dipping method. Since the reaction occurred in a 100% organic solvent, it was essential to perform it in a closed-bottom environment. The PADs demonstrated versatility, as the results were independent of both sample volume and dipping angle. To verify this, the authors fixed the indole concentration and varied the analyte’s volumes. The PADs were dipped into the vials having different volumes without adjusting the dipping angles. Results from 25 PADs (five replications at each volume) showed no significant differences in color intensity, with a %RSD of less than 5%. The versatility of the PADs was further validated by six untrained volunteers with little-to-no experience in chemistry experiments. They were provided only with instructions on measuring indole concentrations at different levels. Five volunteers correctly estimated the indole concentration as prepared. One volunteer, however, reported an incorrect concentration of 5 ppm due to the similarity of the colors at 2.5 ppm in the provided color chart, which indicated the need for further improvement to avoid misestimation. These results confirmed that the developed PADs are user-friendly and suitable for home-use applications by untrained individuals. Finally, the dip-and-read PADs were used for indole analysis in shrimp to monitor shrimp degradation. Figure 4 illustrates the steps of the analysis: (A) sample preparation, (B) extraction, (C) filtration, (D) PAD preparation, and (E) analysis. The results obtained using the developed methodology were compared with those from the standard high-performance liquid chromatography (HPLC) method, and no significant differences were found between the two methods, which indicates that the developed methodology is applicable for real shrimp sample analysis.
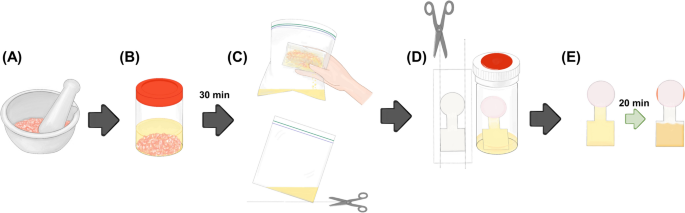
Experimental procedures for the analysis of indole in shrimp: A shrimp sample was prepared by grinding; B the ground shrimp was extracted by EtOAc; C shrimp meat and EtOAc solution were filtered; (D) the PAD was cut to create holes (green arrows) before immersing the PAD into the vial to allow a colorimetric reaction; and, (E) the PAD was removed from the vial before performing data analysis. The orange arrows indicate the accumulation of astaxanthin at the solvent exit (adapted from Ref. [59] with permission from The American Chemical Society)
Danchana et al. investigated the presence of glutamate in food samples using an enzymatic reaction to produce a deep blue-colored product [60]. The proposed PADs included a sample introduction zone connected to a channel that directed the sample solution to three detection zones (Fig. 5A). These PADs also eliminated the need for pipettes by being perpendicularly immersed into the sample solution and bent at right angles using a 3D-printed holder that enabled simultaneous flow into the three detection zones (Fig. 5B). However, there was an issue with inhomogeneous color distribution when introducing the solution. To address this, an anionic poly(acrylic acid) was mixed with the reagents and applied to the detection zones. This improved the color homogeneity because the anionic polymer retains cationic methylene blue and forms stable ion pairs. Finally, the developed methodology was applied to analyze glutamate in soup powder, cookies, sauce, and juice. The results obtained from the developed method were compared with those using a commercial Glutamate Assay Kit-WST for microtiter plate assay. The calculated absolute t value (1.95) was lower than the critical t value (2.57) for all samples at 95% confidence, which suggests that the PADs are applicable to glutamate analysis in various matrices of food samples.
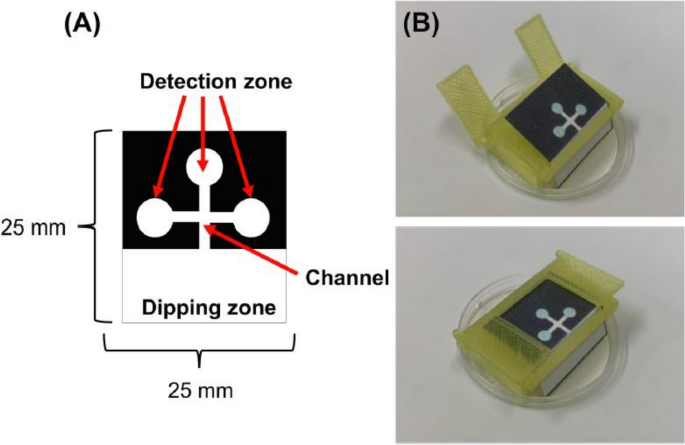
Designs of the PAD and the 3D-holder fabricated using a 3D printer: A the designed PAD for glutamate determination; and, B the 3D-holder with the PAD—A sample is added to the tray placed at the bottom of the 3D-holder (adapted from Ref. [60] with permission from Elsevier)
Summary of PADs
The developed PADs are summarized in Table 1, which provides details on analytes, reagents, detection methods, measurable ranges, and limits of detection (LODs). We have previously reported various types of PADs designed to enhance sensitivity, portability, and user-friendliness. These PADs have enabled the analysis of acids, bases, various metal ions, and nutrients in environmental samples, as well as certain organic molecules in food samples. These studies highlight the potential utility of PADs for on-site analysis of environmental and food samples without the need for large, expensive instruments that require high levels of power consumption.