Article Content
1 Introduction
In most societies some choices on individual conduct are made by the citizens themselves and some other choices are made by the state and on behalf of the individual. Prominent examples are legal restrictions such as the obligation to wear seatbelts in cars or helmets on motorcycles, mandatory health insurance or forced retirement savings. But how much should the state interfere with individuals’ choices in their presumably best interest? Vice versa, how much self-harming behaviors should the state tolerate before choices are restricted?
In this paper, we study citizens’ attitudes to the trade-off between individual choice and the protection from welfare-reducing and self-harming behavior. We call this the preference for governmental paternalism. We develop an innovative survey instrument to measure these preferences, the Paternalism Preference Index. In a large-scale representative survey experiment, we document the heterogeneity of paternalism preferences and demonstrate the validity and relevance of our index by examining its relationship with individuals’ valuations of personal freedoms.
Whether or not individual preferences for paternalism matter is of basic epistemological interest. Similar to personality indices common in psychology, preferences on paternalism might be an imprint or character trait of the individual. This is also of high policy relevance: Such a trait could determine individual attitudes to public governance and governmental behavior. Policymakers must weigh freedom rights against other basic rights such as life and security of person when interfering with individuals’ private interests. Many modern democracies attach similar importance to a number of rights. The United Nations firmly establishes this in the Universal Declaration of Human Rights, which mentions liberty together with the right to live and security of person in Article 3. The ideal-typical version of these fundamental norms and values is also found in the US Declaration of Independence: ‘We hold these truths to be self-evident, that all men are created equal, that they are endowed by their Creator with certain unalienable Rights, that among these are Life, Liberty and the pursuit of Happiness.’ The quote suggests a connection between life, liberty and happiness in general.
We design an indicator that captures individual preferences toward governmental paternalism along different dimensions of life. Individuals’ attitudes to such strict interventions might be based on a number of motivations, and might differ based on the specific area and direction in which the government intervenes. However, all interventions have one fundamental trade-off in common. Some individuals may wish to be free to make decisions about their lives, even if those decisions involve situations in which they might end up choosing self-harming actions and making mistakes. Others may wish to be protected by the state from such dangers through appropriate (behavioral) regulations. Related to the definition by Dworkin (1972), we refer to strict paternalistic interventions as policies that (i) restrict an individual’s freedom of choice (ii) without (explicit) consent of the respective individual (iii) primarily in order to make the respective individual better off.Footnote1
Using large-scale survey evidence from Germany, we show that the heterogeneity of preferences toward paternalistic governmental interventions is large and ranges from high approval to high disapproval. Then, we use the events of the Covid-19 pandemic: In an attempt to contain the spread of the virus, Germany imposed strong constraints on personal freedoms. Our survey elicits how individuals perceived the constraints on personal freedoms in spring 2020, and how these affected their articulated well-being. To establish the relationship of the paternalism preference and the valuation of personal freedom rights, we test whether the individual paternalism index score is correlated to the reported effects of freedom-reducing infection control measures. Importantly, in the context of our study, it is not crucial for the identification that the motivation for the restrictions has been (exclusively) paternalistic in nature. The hypothesis we test is that paternalism-skeptic individuals value personal freedoms more than paternalism-friendly individuals. A restriction to personal freedoms should lead to larger reduction of life satisfaction for paternalism-skeptic individuals, independent of the motivation of the restrictions. Moreover, paternalism-skeptic individuals should attribute a larger part of their life satisfaction losses to changes in personal freedom. This may be due to a larger valuation of personal freedoms for instrumental and for intrinsic reasons.
Our analysis is related to sets of several areas of scientific interest. First, the growing literature on paternalism. Two papers explore paternalism preferences empirically but from a different research angle. Pedersen et al. (2014) study responses to a set of attitudinal questions that partially overlap with our set of questions. Their research focuses on whether individuals suffer from self-control problems and are sophisticated enough to know about it. Individuals may like governmental choice restrictions and prohibitions to compensate and correct for their own inability to control themselves. Treger (2023) explores the preference for coercive and non-coercive paternalistic interventions in different need domains. She hypothesizes that individuals have a preference for coercive paternalistic policies in the basic needs domain, and a preference for non-coercive paternalistic policies in the higher needs domain. In contrast to us, both studies put a stronger emphasis on libertarian paternalism, which suggests the governmental use of nudges.Footnote2 More importantly, we take a consequentialist perspective and show that the paternalism preference is closely connected to an individual’s valuation of personal freedoms.
A natural next step is the question what determines the preference for paternalism.Footnote3 The literature discusses various reasons for governmentally imposed choice restrictions, consequences of such restrictions, and reasons for why individuals might like or dislike such restrictions. Mill (1859/2014) highlighted that the trade-off between individual choice and governmental prescriptions can be seen as an issue of private information. He suggested that a government that assumes decision power on individuals’ genuinely private matters is likely to make wrong decisions. The trade-off between individuals’ superior information as regards its idiosyncratic tastes and the government’s economies of scale and scope as regards systematic information aspects is the starting point in Konrad (2024). He constructs an information-asymmetries-based micro foundation of attitudes toward paternalism and highlights possible feedback loops between political decision making, individual consumption tastes and endogenously formed capabilities to make good decisions. The preference for paternalism is determined by the instrumental value of personal freedom here. Complementary is the literature on the intrinsic/non-instrumental valuation of freedoms. Buchanan (2005) postulates that some individuals might like to delegate private decisions, if this comes with a shift of the burden of responsibility for the consequences of these decisions. Related is also Bartling et al. (2014). They suggest that there is an intrinsic value of decision rights and explore a method for the measurement of such decision rights preferences. Also addressing the preference for decisions on private matters, Benz and Frey (2008) and Benz et al. (2004) take a more straightforward behaviorist approach: individuals might have procedural preferences. They may attribute intrinsic value to own decision rights and might value the way in which choice outcomes are determined. Sen (1988) addressed freedom of choice as a genuine desire. He argues that, in an appropriately broadened decision framework, a procedure can be interpreted as a consumption item such that procedural preferences become part of standard economic decision theory. These views and explanations for individuals’ attitudes on the allocation of decision rights are not mutually exclusive and might add or compound. They suggest that there might be heterogeneity of preferences for paternalistic interventions within a given population. Our research addresses this heterogeneity issue. Indeed, individuals differ in their views on specific decision delegation issues, and in how they assess the trade-off between protection by the government and the freedom of making own choices. These differences are not uniform across issues, but we find a common underlying factor that aggregates and describes individuals’ preferences on this trade-off. Moreover, results of our robustness analysis in different socio-economic subgroups provide some tentative evidence on the instrumental and intrinsic component of the paternalism preference.
Second, there is a major literature that relates freedom of choice to subjective well-being. By using mainly panel data, exploiting variation between countries and variation within countries over time, several studies diagnose a positive well-being impact of freedom. Foundational contributions are Inglehart and Klingemann (2000), and Veenhoven (2000). Frey and Stutzer (2000, 2002) use individual survey data from Switzerland, and focus on the role of democracy variables using variation between cantons. More recent studies are Graafland and Compen (2015), Jackson (2017), Nakazato et al. (2017), and Spruk and Kešeljević (2016). Closest to our paper is Hadsell and Jones (2020) that points to individual approval or disapproval of governmental policy as a possible determinant of life satisfaction.Footnote4 For an account of the large empirical literature on the relationship between economic freedom and economic performance, see the survey by Hall and Lawson (2014). Our results show that individuals attribute a large share of life satisfaction losses to restrictions in personal freedoms during the first wave of the pandemic in 2020. However, quantitative effects should be taken with a grain of salt because we rely on remembered life satisfaction and self-assessed effects, and restrictions to personal freedoms have been salient.
Third, our analysis contributes to the large literature that identifies and measures personality traits. A meta-study by DeNeve and Cooper (1998), for instance, lists 137 personality traits that have been distinguished and analyzed. Some of the analyses study the correlation between such traits and well-being (see, e.g., Steel et al. 2008). Beside the paternalism index, we elicit two well-studied personality traits. The first one is psychological ‘reactance’ (see the foundational work by Brehm 1966 and a review by Miron and Brehm 2006). The reactance trait measures the motivational arousal of the threat of the elimination of one’s freedom and disapproval of being lectured and patronized by others. The second trait is the ‘locus of control’ (Rotter 1990). It can be described as the extent to which a person believes that the course of her life depends largely on her own actions rather than on the actions of others or on chance and luck. We test whether paternalism preferences can be seen as independent of these existing personality concepts, and whether paternalism preferences have more explanatory power for the valuation of personal freedoms than these two related personality traits.
The remainder of this paper is structured as follows. Section 2 describes our survey experiment. Section 3 presents descriptive results on the Paternalism Preference Index and analyses its relationship to the valuation of personal freedoms. Section 4 provides a discussion of the survey design and section 5 concludes.
2 The survey experiment
2.1 The survey design
2.1.1 Overview
The overarching research goal is to measure an individual’s preference on the question of how far governmental regulation should intervene in pre-dominantly private matters with the aim of improving an individual’s welfare, and to what extend it should respect an individual’s decision autonomy even for potentially bad choices instead. To this end, we develop a questionnaire of 11-items, the Paternalism Preference Index. In order to assess the validity of the indicator, we rely on subjective well-being during the Covid-19 pandemic. We use the restrictions of personal freedoms to test the hypothesis that individuals who are skeptical of paternalistic interventions value personal freedoms more in terms of life satisfaction than individuals who approve such interventions.
2.1.2 Implementation
The first wave of the survey tests our main hypothesis and focuses on the imposition of restrictions. It was conducted end of June/beginning of July 2020. The sample size was 4,411. A second exploratory wave focuses on the phasing-out of restrictions and was conducted in July 2022. It mirrors the 2020 timing for 2022. The sample size was 1,100. The composition of survey participants was representative of the German population with respect to gender, age (18–69), income, and state of residence. The survey company respondi administered the panel, the distribution of the surveys, and the participant payments. The project received ethics approval by the Ethics Committee of the Department of Economics of LMU Munich (‘Attribution of Happiness Losses,’ date of approval 06/09/2020).
Survey procedure
2.1.3 Procedure
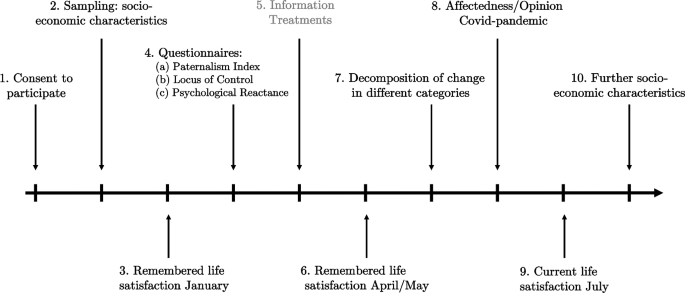
Figure 1 provides an overview of the survey structure. On the first page, participants received the information that the survey was independent research by Max Planck scientists. After giving consent to participate and elicitation of basic socio-economic characteristics, subjects state their remembered life satisfaction in early 2020 on a 1 to 10 Likert scale.Footnote5Footnote6 Participants then answered the Paternalism Preference Index as well as the two established personality traits Psychological Reactance and Locus of Control. Subsequently, subjects were randomly allocated to different information treatments in the first wave of the survey,Footnote7 and were then asked for their remembered life satisfaction in April/May 2020 on the same scale as before. In the following, we asked subjects to attribute their change in remembered life satisfaction between April/May and January to changes in six different domains of life. After eliciting additional questions on the personal affectedness by the Covid-19 pandemic, it concluded with an individual’s current life satisfaction at the time of the survey and further socio-economic controls.
2.1.4 Paternalism Preference Index
The key explanatory variable is subjects’ views on paternalistic governmental interventions. We measure their preference with a questionnaire that contains 11 items on such policies. Subjects indicate their opinion on each item on a 5-point Likert scale, ranging from complete approval (1) to complete disapproval (5). The full list of items is:
- 1.Everybody should have the right to do things that can harm himself/herself.
- 2.Behaviors that endanger people themselves should be banned. (reversed score)
- 3.Nobody knows better than myself what is good for me.
- 4.The most important task of the state is to protect me comprehensively from dangers of any kind. (reversed score)
- 5.I would like to see the state relieve us citizens of more tasks and responsibilities. (reversed score)
- 6.The state should ban unhealthy food. (reversed score)
- 7.The state should consistently protect us from drug abuse. (reversed score)
- 8.When and how much I save for retirement I would like to decide entirely on my own.
- 9.Everyone should decide for himself/herself whether he/she will wear a bicycle helmet.
- 10.The state is overdoing it with the large number of building regulations.
- 11.Old vehicles with low energy efficiency should have their operating license revoked in the medium term. (reversed score)
The list includes items aiming at the general preference for paternalistically motivated interventions, and items aiming at specific policies in the health, safety, and pension savings domain. Some items focus exclusively on the individual herself. Other items also include the regulation of externalities to some extent, or have more of a normative character and refer to the society as a whole. They have in common that policies restrict the freedom of choice without explicit consent of the respective individual. However, we do not require the strict assumption that the interventions have been exclusively motivated to make the respective individual better off, but rather that it is at least one of the motivations for such policies. Technically, we rely on factor analysis to condense the variance in the response pattern that is due to the paternalism preference into an individual index score. Appendix A.1 provides the technical details on the construction of the index. We also test the robustness of our indicator by using only a subset of items.Footnote8
2.1.5 Outcome variables
The first outcome variable is the difference in remembered life satisfaction between January and April/May of the respective year. Conceptually, this difference measures participants’ retrospective assessment of how the events of the pandemic have affected their life satisfaction. For simplicity, we will refer to the difference as their change in life satisfaction. In the first wave of the survey (2020), Germany was still largely unaffected by the pandemic in January (Covid-19 stringency index of 6 points by end of January as measured on a scale from 0 (no restrictions) to 100 (strictest response), Mathieu et al. 2020), but in April/May, the stock of infections was considerable, the number of new infections was substantial, and restrictions to civil liberties peaked (Covid-19 stringency index between 60 and 77 points). Hence, the period captures drastic restrictions to personal freedoms. We discuss our life satisfaction measures in detail further in section 4.Footnote9
Formally, the change in life satisfaction is defined as the difference of remembered life satisfaction in April/May and remembered life satisfaction in January:
Life Satisfaction − Life Satisfaction
The second outcome measure is the self-reported impact of changes to personal freedoms on the change in remembered life satisfaction. It is a proxy of individuals’ valuation of personal freedoms. To this end, we asked subjects to evaluate the effect of changes to six different domains of life on their life satisfaction. The exact formulation of the question was: “At the beginning of this study, we asked you about your life satisfaction at the beginning of the year. Your life satisfaction between the beginning of the year and the months of April and May may have changed due to various factors. We would like to know which factors were particularly important for the change in your life satisfaction. Below you can see 6 different factors.[…]” Factors included the ‘Economic Situation,’ ‘Personal Freedom,’ the ‘Domestic Situation,’ the ‘Health Situation,’ ‘Societal Change,’ and ‘Other Factors.’ For each of these factors (in the following ‘domain of life’), they give a point value as an integer number from the interval (in the following ‘points attributed’). A value of means that changes to the domain have strongly contributed to a decrease of life satisfaction, a positive value of means that changes to the domain have strongly improved life satisfaction, and a value of 0 means that this domain of life was neutral for the change in life satisfaction. Distributing twice as many points to a domain than to another domain means assigning twice the impact on life satisfaction to the respective category. We denote the score that person i gives to each domain by .Footnote10
Formally, the second outcome variable is the effect of the changes in personal freedoms to the change in life satisfaction, i.e., . The analysis relies on the assumption that the more points a subject attributes to personal freedoms, the larger the effect of changes to personal freedoms to the change in life satisfaction. Results are robust to the different analyses, in paticular to a direct estimation of the contribution of each domain of life in terms of life satisfaction. Appendix A.2 provides a detailed overview of the change in life satisfaction as well as the distribution of points to different domains, and Appendix A.3 shows the robustness of results with a structured estimation approach for the contribution of each domain of life.
2.1.6 Control variables
Our survey includes a number of controls. As summarized in the introduction, we measure two well-established personality traits that might overlap with individuals’ preferences for governmental paternalism. For one, we measure psychological reactance (Brehm 1966). We use a set of 14 items adapted from Hong and Page (1989). We also include a questionnaire for the locus of control (Kovaleva et al. 2012). To generate these indices, we condense the respective set of items by factor analysis into a single, one-dimensional index value (for the procedure and results, see Appendix A.1). Inclusion of these indices may allow to test whether the preference for paternalistic interventions is an independent concept or absorbed by these personality traits.
We also elicit a set of basic socio-economic control variables (sex, age, marital status, state of residence, household income, and household size). Moreover, the pandemic changed life along many dimensions and might have caused changes of life satisfaction for many reasons. Therefore, further control variables include the employment and education status, and several questions on the individual affectedness by the Covid-19 pandemic in general.
3 Results
Our analysis follows two steps. First, we discuss descriptive results on the preference for paternalistic governmental interventions and the socio-economic correlates of this preference. In the second step, we provide evidence on the validity of the indicator and show that the paternalism preference has predictive power for an individual’s valuation of personal freedoms. The restrictions to personal freedoms during the Covid-19 pandemic provide us with a unique opportunity to test the relevance of paternalism preferences. Importantly, our goal is not to explain or disentangle the different effects that caused life satisfaction changes as a consequence of the pandemic. We use the sizeable interventions in spring 2020 as an exogenous event to test whether paternalism preferences, measured along dimensions unrelated to the pandemic, have explanatory power for how strongly the freedom restricting protection measures changed life satisfaction. The analysis abstracts from whether the individual thinks that the freedom-restricting policy measures are legitimate, appropriate or commensurate given the pandemic threat.
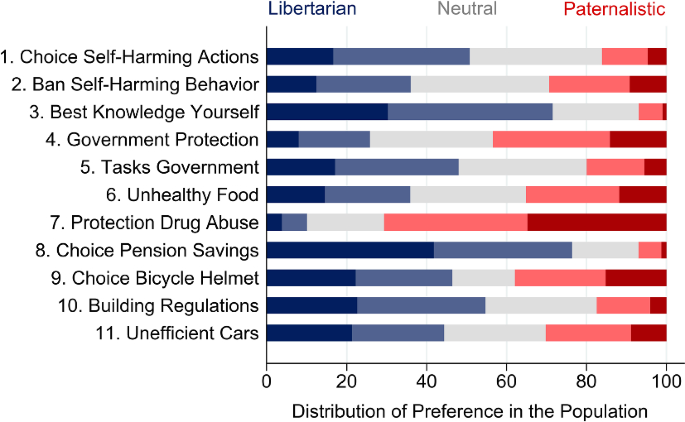
Distribution of answers to single items of the Paternalism Preference Index. The figure shows the distribution of answers to single items of the Paternalism Preference Index in the survey population. Answers to the left indicate libertarian preference (blue), answers to the right paternalistic preference (red). Dark blue bars refers to strong libertarian preference (fully agree (reversed: fully disagree)), light blue bars to weak libertarian preference (rather agree (reversed: rather disagree), grey bars to neutral preference (rather agree nor disagree), light red bars to weak paternalistic preference (rather disagree (reversed: rather agree)), dark read bars to strong paternalistic preference (fully disagree (reversed: fully agree))
3.1 Descriptive results on the paternalism preference index
Figure 2 shows the distribution of answers to single items of the Paternalism Preference Index, pooled over the first wave in July 2020 () and the second wave in July 2022 (). Descriptive results for a seperate analysis of the Paternalism Preference Index in wave 1 and wave 2 of the survey are qualitatively similar to the pooled analysis. For each item, answers to the left indicate paternalism-skeptic individuals, and answers to the right paternalism-friendly individuals. Some items exhibit a balanced distribution, such as the ban of self-harming behavior in general (item 2), or the ban of unhealthy food (item 6) and the choice of wearing a bicycle helmet (item 9) in specific. Other items are more skewed toward one direction: 71 percent of participants are in favor of paternalistic governmental interventions to protect individuals from drug abuse (item 7). In contrast, more than 75 percent of participants have a preference to determine themselves how much and when to save for their retirement (item 8).
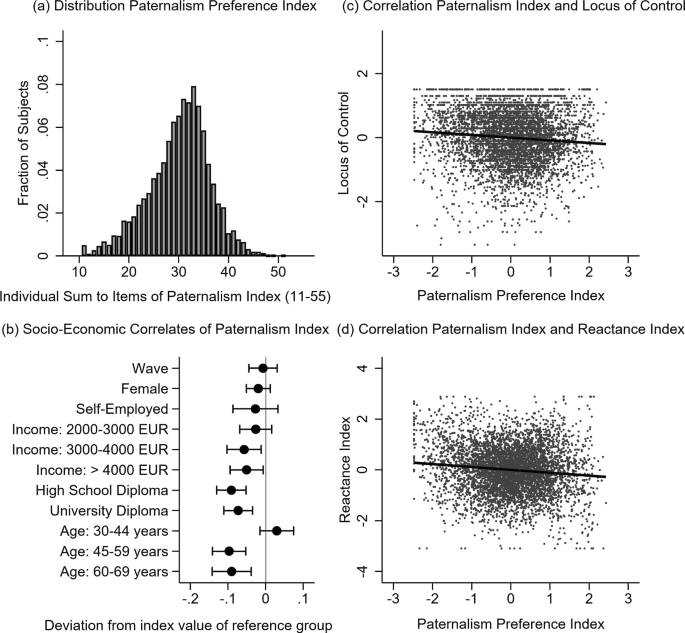
Socio-economic correlates of the preference for paternalistic governmental interventions. Fig. 3a displays the distribution of the individual sum to the items of Paternalism Preference Index. The lower the sum, the more skeptical is an individual toward paternalism. Figure 3b shows the socio-economic correlates of the preference for paternalistic interventions. Dots denote coefficient estimates of an OLS regression with the standardized preference for paternalism (mean: 0, sd.: 1) as dependent variable. Error bars indicate mean ± 95%-confidence intervals. Figure 3c displays the correlation of the paternalism preference with the locus of control, Fig. 3d displays the correlation with psychological reactance
We then aggregate the response pattern to the 11 items to derive the paternalism preference. Figure 3a displays the distribution of the preferences for paternalistic governmental interventions, calculated as the individual sum to the set of 11 items. Subjects who disagree with paternalistic governmental interventions have a low sum; subjects who are favorable toward these interventions have a large sum. Statistics indicate a considerable heterogeneity of participants with regard to the preference (, , , ). Many individuals express a moderate view on paternalistic governmental interventions: 63.6 percent of participants fall within the intermediate range of points (as a benchmark: a participant who always chooses ‘Neither agree nor disagree’ has an aggregate sum of 33 points). Other participants have stricter preferences. A share of 29.5 percent of participants is generally skeptical toward paternalistic interventions and falls in the lower range of points. These participants seem to insist on their freedom of choice even at the risk of detrimental consequences for themselves. Yet another (smaller) group generally welcomes paternalistic governmental interventions: 6.9 percent of participants fall in the upper range of points. For them, being protected from self-harming behavior seem to outweigh the freedom of choice. In the further analysis, we transform the individual response pattern into an index score using factor analysis. The individual sum and the indiviudal index score are highly correlated (). Moreover, the preference for paternalistic interventions is stable over both waves and the difference in the aggregate sum to the 11 items is small (30.2 vs. 29.8 points, Wilcoxon-Mann–Whitney test: ).
Figure 3b displays the socio-economic correlates of the preference for governmental paternalism. We do not find a significant difference between men and women. Moreover, self-employed do not differ in their paternalism preference from the general population. In contrast, higher income levels (household income of 3000–4000 EUR or above 4000 EUR versus household income below 2000 EUR) and higher levels of education (high school diploma or university degree versus middle school degree/no degree) are correlated with a lower preference for paternalism. Finally, the correlation with age is non-monotonic. Individuals of the age group 30–44 years have a slightly higher preference for paternalism than individuals of the reference age group 18–29 years, but individuals in the age groups 45–59 years and 60–69 years are more skeptical toward strict paternalistic interventions. As we consider a cross section, it is undecided whether these are age effects or cohort effects.
An important question is whether the preference for paternalism is an independent concept or whether it is absorbed by other personality traits. We focus on locus of control and psychological reactance, as their conceptualization suggest a possible correlation with our index. Figure 3c displays the correlation of the preference for paternalism with locus of control. Figure 3d sheds light on the correlation with psychological reactance. Both correlations are negative but close to zero ( and ). This indicates only a limited overlap between the paternalism preferences with these traits.
Result 1
We find considerable heterogeneity in the individual preference for paternalistic governmental interventions, and some correlation with respect to socio-economic factors. The correlation with the personality traits psychological reactance and the locus of control is weak.
3.2 Paternalism preferences and the value of personal freedoms
3.2.1 Relationship between paternalism preference and target outcomes
Between January 2020 and April/May 2020, the average change in remembered life satisfaction amounted to 1.10 points (scale from 1 to 10). A major part of this decline was attributed to restrictions of personal freedoms. This domain received 1.23 points on average (scale from -5 to +5), which accounts for 55 percent of total negative points attributed to the different domains of life. For detailed results on the change in life satisfaction and the attribution of points to different domains of life, we refer to Appendix A.2.