Article Content
Abstract
The US-China trade war – and broader changes in China’s economy, politics, and relations with the West – have created sharp increases in cost and risk for firms dependent on China. Under what conditions are firms willing and able to decouple from China? We argue that decoupling is only possible where viable alternative markets for sourcing and production are abundant. Geopolitically-aligned markets are particularly appealing amidst rising global tensions. We test this theory looking at product-level imports and show that declines in US imports from China were much larger for products previously sourced from many markets. Requests for suspensions of trade war tariffs are much more common for products that lack alternative markets. Both of these effects are entirely driven by product availability in allied and friendly alternative markets, highlighting firms’ geopolitical concerns in an era of global economic reordering. We conclude that the scope for decoupling is highly variable across industries and depends strongly on political factors: broad decoupling faces many obstacles and will require building alliances and international economic order.
The Shifting Paradigm of Global Trade in Technology
Do political relations affect international trade? Evidence from China’s twelve trading partners

US-China Trade War: Is Winter Coming for Global Trade?
Explore related subjects
Discover the latest articles and news from researchers in related subjects, suggested using machine learning.
- International Business
- International Economic Law, Trade Law
- International Economics
- International Relations
- International Trade
- Trade and Retail
1 Introduction
From 1980 to 2016, the American and Chinese economies gradually, but to an extraordinary degree, became intertwined. Chinese producers came to depend on selling their products to Americans and American companies; American companies came to depend on inputs, production tasks, and final products sourced from China. This coupling was not without controversy – on human rights, trade practices, and American deindustrialization – but continuously deepened over 35 years. However, a multi-front trade war, and multiplying economic and strategic tensions, may have jumpstarted an unraveling of the superpowers’ economic ties.Footnote1 This decoupling could be the most important economic and geopolitical development of the coming decade, but its scope and political ramifications are not yet clear. Has decoupling truly begun, and what factors will shape the persistence or curtailment of economic ties between the US and China?
To answer these questions, we develop a theory of decoupling focused on firms’ decision to move on from previously favorable, but now undesirable, markets. Firms that have established relationships with foreign suppliers may be motivated to consider permanent exit in the face of increasing costs of production, trade costs, policy concerns, or geopolitical risk.Footnote2 However, there is likely to be significant variation in firms’ ability to act on a preference to decouple because not all firms have viable alternative markets for sourcing or production. In part, this is due to economic factors: the global division of labor in the 21st century is extreme and industrial manufacturing is highly concentrated in particular countries.Footnote3 Political factors are also crucial, however: moving from one non-ally to another may be undesirable if similar trade frictions, political risk, and geopolitical tensions are replicated. Without acceptable alternative suppliers available in safe markets, firms are stuck. A variety of alternate suppliers in friendly or allied markets, on the other hand, allows firms to confidently move on. As such, we expect that decoupling is likelier when more alternative suppliers are available in politically aligned markets.
The US-China trade war serves as both an inspiration and a proving ground for our general argument about when states can sever economic ties. The two economies are tightly interconnected, but US firms sourcing from China were hit with a sudden shock in 2018 that sharply raised their costs: tariffs ranging from 7.5% to 25% on nearly all trade. Further tariffs, challenges with foreign investment in China, and the threat of escalating economic and security conflict have added to the cost and risk of sourcing from China. We show that American importers differed sharply in the availability of alternative markets for supply. Some products sourced from China prior to the trade war were imported from none or only a few alternative markets worldwide; other products were sourced from nearly all of the US’s top trade partners, many of them friends and allies that represent desirable import options in a context of rising geopolitical tensions. We can observe how American companies reacted to these pressures and opportunities for decoupling.
We first examine a trade-based outcome: the adjustment of product-level US imports from China during the initial years of the trade war (2018-20). Using multiple layers of differencing and high-dimensional fixed effects to partial out confounding factors and trends, we show that products imported from China that were also available from many other markets saw sharp import declines after the trade war began. Imports from China that were available in only a few other markets declined far less. This decline in imports is driven by the availability of allied and friendly alternative markets. US trade from China does not decline with larger numbers of non-allied or unfriendly alternative markets, suggesting that firms are cautious about moving from China to another strategic competitor. The existence of allied alternate suppliers speeds up decoupling, while their absence makes decoupling much more challenging.
We show that these core findings are replicated over the first three years of the Biden administration (2021-23) as the pressure for decoupling increased. The Biden administration mostly froze in place the Trump trade war tariffs, while early pandemic supply shocks and fights over scarce medical equipment and pharmaceuticals highlighted the dangers of over-reliance on a single, non-allied market. Rapidly intensifying US-China strategic tensions across many domains, particularly military-adjacent technologies and Taiwan, further highlight import vulnerability and the fragility of supply chains. Russia’s 2022 invasion of Ukraine reinforced a perception of unraveling global economic and security order. Yet even despite these mounting pressures, decoupling remained restricted to products where it is most feasible, i.e., products with a large number of friendly and allied alternative suppliers. The US remains critically reliant on Chinese imports for many products and unable to move on to new suppliers.
To complement our main empirical investigation, we also examine a political process: requests for “exclusion” from China trade war tariffs by US firms. After levying trade war tariffs on nearly all US imports from China, the US Trade Representative created a process where firms could request that a product they import or produce in China be exempted from the new tariffs. We find that products that were sourceable from a wider variety of markets prior to the trade war received significantly fewer requests for exclusion. As with changes in imports, notable differences emerge depending on whether alternative markets were friendly and allied, or not. Where allied alternatives were lacking, firms were forced to stick with China and fight the trade war tariffs.
We make three contributions to the literature. First, we develop a political theory of when decoupling will occur, emphasizing motive – a sudden increase in adverse policy and political risk – and means – the availability of alternate suppliers in geopolitically aligned markets. Our findings on product-level variation in alternative suppliers complement work on firm-level variation in exit costs.Footnote4 Second, we show that the availability of alternative suppliers muted opposition to trade war tariffs,Footnote5 contributing to literature showing that many firms remained politically inactive as the trade war unfolded.Footnote6 Third, we contribute to a fundamental debate on multinational corporations (MNCs) and other globally engaged firms. One strand of the literature emphasizes these firms’ vulnerability to host markets after unrecoverable investments are made across borders;Footnote7 another emphasizes their strength relative to hosts markets because of their ability to cross borders.Footnote8 Our findings show that which story has more purchase depends on the economic and political variety available in firms’ supply networks.Footnote9
Most fundamentally, our findings contribute to unfolding debates over the feasibility of broad economic decoupling of the West from China, as well as more targeted forms of decoupling with non-China trade partners for specific products that are sensitive for reasons of economic or national security. Alongside imperatives rooted in national interest, growing policy and political risks are pushing firms to find alternatives for both China and sensitive non-China trade. However, moving on from markets with increasing risks is only possible for firms with economically viable alternative suppliers in politically secure markets. This points to the importance for both firms and governments of investing in foreign relationships and international cooperation to cultivate safe alternative suppliers and markets for production.Footnote10 Decoupling in the context of healthy bilateral economic relationships and revived international trade order will be hard, but has a chance of success; decoupling in an environment where friendly bilateral relationships fall apart and trade order disintegrates will be extraordinarily challenging.
2 Theory
2.1 Coupling of the US and Chinese economies
Richard Nixon’s 1972 visit to China ended 25 years of estrangement, marking a new era in US-China relations. Deng Xiaoping’s subsequent ‘reform and opening-up’ transformed China’s foreign economic relations, encouraging foreign trade and investment. China’s annual trade exploded from $20 billion in the late 1970s to $475 billion in 2000. Bilateral trade in goods with the US grew from $1 billion in 1978 to $116 billion in 2000. By the late 1990s, China was the second largest recipient of foreign direct investment (FDI). US FDI in China grew more gradually, but had reached $11 billion by 2000. Coupling had begun.
In 2000, the US facilitated Chinese entry into the World Trade Organization, which sharply intensified coupling (Hillman, 2023; Hung, 2021; Handley & Limão, 2017). By 2009, China was the biggest source of US imports and the third largest customer for US exports. US manufacturers, wholesalers, retailers, and consumers came to rely on China as the key site for sourcing and production of manufacturing parts, assembly services, and finished goods. As mutual dependence escalated, disagreements arose over trade imbalances, investment restrictions, intellectual property, and the exchange rate (Peng et al., 2017; Lee, 2017; Ahn & Lee, 2011).
By 2016, total trade in goods between the US and China was $578 billion with a massive US trade deficit of $347 billion.Footnote11 Unresolved trade frictions continued to grate, while Chinese imports were linked to lost US jobs (Autor et al., 2016; Feenstra & Sasahara, 2018). Basing his candidacy in part on these developments, Donald Trump vowed to confront China. His administration introduced a broad array of tariffs, including Section 301 tariffs of between 7.5% and 25% on virtually all US imports from China in 2018. The tariffs sparked Chinese retaliation, leading to the largest trade war in history.
A ‘Phase One’ deal signed in January 2020 stabilized the trade war. But the Biden administration mainly continued Trump’s policies, accelerating a reordering of US-China economic relations. Continuing confrontation was manifest in subsidies for semiconductor production and investments in critical materials supply chains as well as new rules to block partnerships with Chinese tech companies and restrict FDI. Industrial competition over military-related technologies reached a fever pitch, while US-China tensions over Taiwan reached a new and ominous intensity. Talk of a “Cold War 2.0” and the “decoupling” of the US and Chinese economies accelerated (Zhao, 2019; Jisi & Ran, 2019; Maher, 2018; Wang & Zeng, 2020).
2.2 Incipient decoupling: Finding safe suppliers beyond China
Decoupling: Definition, Description, and Causes
“Decoupling” can be defined as a durable process of significant and systematic weakening of two countries’ previously dense economic interdependence. True decoupling is not superficial and is not temporary, but rather a comprehensive weakening of economic relations lasting beyond the short-term. Decoupling has several related terms. “Derisking” involves cultivating trade and investment relations with a diverse set of countries to avoid over-reliance on strategic competitors. A “China Plus One” strategy counsels maintaining links to China while diversifying sourcing to at least one other destination. Reshoring, friendshoring, and allyshoring – the movement of foreign production and sourcing back home or to friendly or allied trade partners – share the same motive: reduce trade and investment links with China as barriers to trade and political risk grow.
Decoupling of the US and Chinese economies has been much discussed, but the evidence on whether this began after 2016 is mixed. Trade growth between the two economies slowed starting around 2007-08, and total US imports (in real terms) from China peaked in 2018 [see Fig. 1].Footnote12 As a share of all US imports, imports from China topped out at 21.6% in 2017 and fell to 13.3% by 2023; China’s share of US exports fell from a high of 8.7% in 2020 to 7.2% in 2023. While FDI between the two economies was never massive, US FDI growth in China has stalled since 2017; Chinese FDI in the US has similarly slowed.Footnote13 Chinese portfolio investments in the US fell sharply, too.
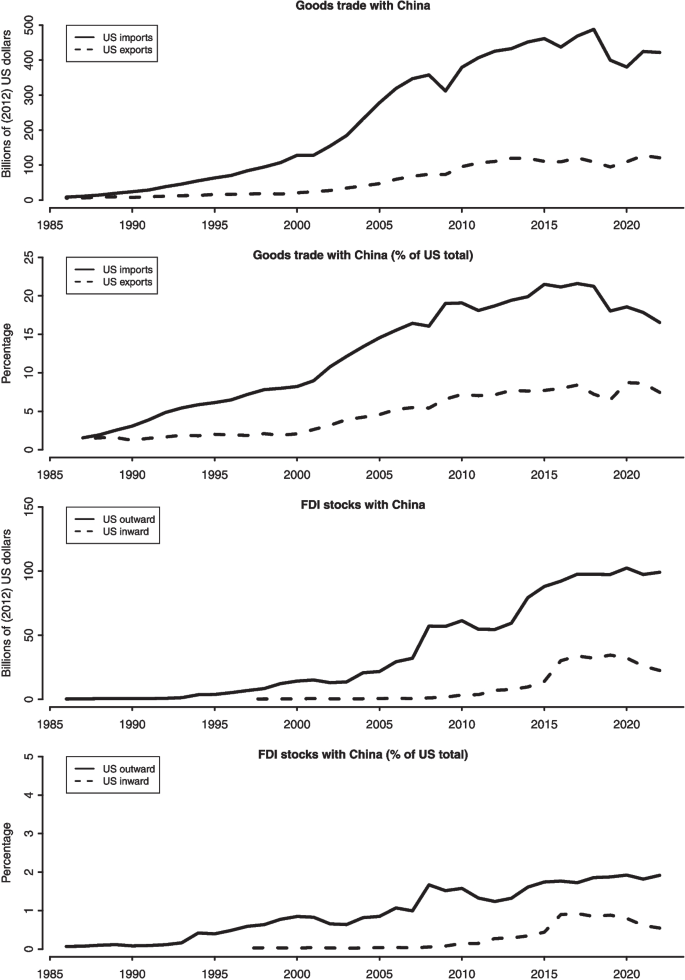
Trade and FDI with China. Source: US Census Bureau, US Trade in Goods by Country and US Bureau of Economic Analysis, US Direct Investment Abroad and Foreign Direct Investment
These data are suggestive of incipient decoupling, but several points must be highlighted. First, declines in trade and FDI were not that dramatic. Trade in nominal terms hit all time highs in 2022 when the US and China still traded more than any other non-contiguous countries in the world. Second, declines in imports were very uneven across products and industries, and offset by increasing imports in other areas. Third, some Chinese exports have been rerouted through third party nations and some of the US’s key trade partners have increased their imports and supply chain linkages with China (Freund et al., 2024). Some apparent decoupling may be transshipment. Overall, there were initial signs of decoupling of the two economies from 2016 to 2024. But the process was slow and highly uneven – these facts motivate our investigation of the scope for decoupling across products.
To the extent that decoupling began, what are its origins? Labor-intensive production is moving away from China due to wage growth. Some American firms have grown tired of the challenges of investing in China – partnership requirements, forced tech transfer, IP theft, state interference – which have increased as the regime has grown more authoritarian and hostile to foreigners. Pandemic supply issues and lockdowns highlighted the value of diverse sourcing options. However, intensifying strategic rivalry between the US and China is the most unambiguous force behind decoupling in this era. The Section 301 tariffs starting in 2018 were the key catalyzing moment for talks of decoupling, and challenges in US-China relations multiplied thereafter. US firms leaving China were reacting to increasing commercial barriers, the threat of further degradation of the economic relationship, and even the risk of war (Zhao, 2019; Wang & Zeng, 2020; Kastner, 2007).
Challenges of Decoupling
Firms considering decoupling face three major challenges.Footnote14 First are the costs of switching suppliers or moving production (Zeng et al., 2023; Zeng, 2021). Second is whether a viable alternative supplier or host market even exists, given the enormous reliance of America and the rest of the world on goods made in China. Third is finding an alternative supply arrangement that does not replicate the negative political risk factors at the core of US-China decoupling in the first place. We discuss the first of these briefly before moving on to the next two, which are our theoretical contributions.
One set of challenges associated with decoupling are the one-off costs associated with finding new suppliers. Ending existing contracts with arm’s length suppliers may require payment of termination fees, create gaps in production schedules, and lead to unwanted technological transfer. A decoupling firm must pay research costs to find new suppliers or markets, and must learn new customs and how to navigate government relations (Zaheer, 1995; Lee, 2024, 2023). A significant minority (about 25%) of American imports from China are related-party trade, which most likely means US-based companies owning manufacturing facilities in China, where they produce and then export to the US. For these firms, leaving China is particularly costly since it requires selling or closing down expensive production facilities (Zeng et al., 2023; Zeng, 2021).
Before considering the costs of moving, however, lies a more fundamental question: does a viable supplier or host market beyond China even exist? China is the hub of global manufacturing. This is a consequence of structural advantages, including a large, well-educated, and (until recently) low-wage workforce; a tradition of manufacturing, entrepreneurial, and engineering prowess; and an effective state focused on infrastructure and investment. China has benefited from external economies of scale and agglomeration effects concentrating global manufacturing within the colossus. The US-China manufacturing supply chain built up to an enormous scale in preceding decades, and was reaffirmed across dozens of industries over hundreds of manufacturing cycles.
For some products, decoupling is impossible in the short-run, because there is no plausible non-China supplier. In 2018, there were eleven product categories worth at least $100 million for which China supplied 95 percent of US imports.Footnote15 In other cases, products sourced from non-China suppliers may be only imperfect substitutes. Manufacturing specialization is pronounced in the present era. Suppliers specialize in niche products, while remaining unable to produce other superficially similar goods (Krugman, 1991; He, 2003; Smith & Florida, 1994). Even companies that locate alternate suppliers are still facing a “back-up option” worse than the pre-trade war status quo. Otherwise, they would not have chosen to source from China in the first place.
The challenge of locating viable alternative markets is substantially heightened by concerns over political risk. Firms are always sensitive to political risk (Johns & Wellhausen, 2016; Wellhausen, 2014; Jensen et al., 2012; Jensen, 2008) but are likely to be especially concerned since the origins of decoupling are mainly political. Exiting China to relocate to another US adversary may provide only marginal benefits to firms’ geopolitical risk profile, and certainly less certainty than relocating to reliable allies. International economic and political order are generally fraying, further heightening firms’ interest in markets where political risk, whether from meddling host governments unsympathetic to US companies or from conflict between the US and that market, are low. Allyshoring is one strategy to accomplish this because the risk of military conflict between an allied trade partner and the US is low. The threat of economic conflict or host market political risk is likely lower, too. Firms may also friendshore for similar reasons.
Variation in Ability to Decouple across Products
Our final key point is that there is a huge variation across products in the availability of alternative non-China suppliers, particularly in allied or friendly states. This variation, illustrated in Fig. 2, has not yet been described in the literature. To do so, we count the number of non-China countries that exported a 10-digit HS level product to the US in a non-zero amount from 2012 to 2016.Footnote16 In the top figure, we focus on the US’s top-10 non-China trade partners, so this statistic tops out at 10. These trade partners (plus China) account for around 70% of US imports, and are the prime trade partners from which US importers might source a product. In the middle figure, we look at the US’s top-25 non-China trade partners. These countries (plus China) account for 87% of US imports, and includes increasingly important trade partners like Vietnam, Malaysia, Indonesia, and Brazil. In the bottom figure, we examine all non-China markets.
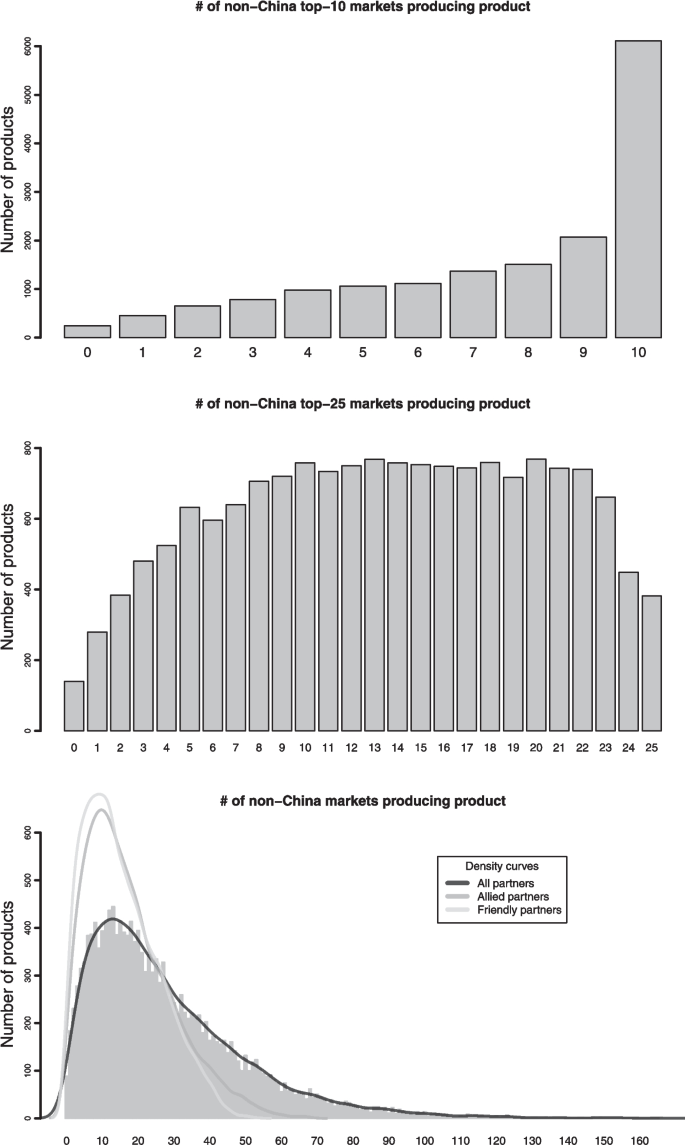
Variation in access to non-China suppliers. Note: Products are imported goods measured at the HS 10-digit level which the US imported from China from 2012 to 2016. Source: Variables constructed from US Trade Online and HS District-Level Data (Imports)
Looking at the top-10 figure, it is uncommon for a product to be imported from China and not a single other trade partner. However, it is fairly common (about 25% of products) for five or fewer other top-10 trade partners to export a product to the US.Footnote17 In contrast, for 37% of products, all other top-10 trade partners exported that product to the US in some volume from 2012 to 2016. Looking at the top-25 non-China trade partners in the middle, and at all countries in the bottom, we again observe a wide variation in the number of countries exporting products in some volume to the United States. Many imported products are only available from a handful of countries.Footnote18 Meanwhile, others are sourced from dozens. Overall, there is a significant variation across products in the scope for importing from non-China countries.
The bottom figure also provides important information on the availability of alternative sources for imports in allied and friendly states. First note that the black line represents an estimated density for the distribution of all alternative import options (and so matches the histogram). We then include a second medium-gray line for the distribution of the number of available sourcing options that are allied states.Footnote19 As shown in the figure, the scope for sourcing inputs from allied states is noticeably reduced relative to all states, though a considerable variation remains. We also examine geopolitically friendly trade partners in the Figure. To operationalize this notion, we use a measure of UN General Assembly voting distance averaged over the years 2010 to 2018 (Bailey et al., 2017).Footnote20 As with the alliance-based measure, we again see a distribution of friendly import options that is sharply to the left of the all country measures, but still quite variable.
2.3 Observable implications: Trade flows and friendly/allied alternative markets
Imports and Alternative Markets
Since decoupling is primarily about breaking off from established trade relationships, the most important place to look for decoupling is within changes in US imports from China after the trade war began. A reduced volume of imports from China for some product provides a key piece of evidence of decoupling. We argue that product-level decoupling from China is especially likely when the US has a history of sourcing that product from a significant number of non-China suppliers prior to the trade war. Proven ability to import products under the same fine-grained tariff classification from greater numbers of non-Chinese suppliers is good evidence of viable alternatives to China for sourcing that product. For products that have fewer third country suppliers prior to the trade war, it is likely that imports from China will decrease less.Footnote21
- Hypothesis 1. After the trade war is initiated, US imports from China will decline more for products with a greater number of countries available as existing suppliers.
The Particular Benefits of Allied and Aligned Alternative Markets
Moves to decouple from China are rooted primarily in growing political tensions between the US and China. Some of these tensions have created policy change during our study period, most vividly witnessed in the Section 301 tariffs and in the increasingly poor treatment of foreign corporations by the Chinese state. These are political risks that are realized. But growing political tensions also increased unrealized political risks: the threats of greater barriers to trade and investment, further breakdown in international order, and a serious conflict that would bring US-China trade to a halt.
These political origins of decoupling suggest that firms will be especially sensitive about political risk in new import markets and new host markets for their foreign investment. Politically aligned states (“friendly”) states are less likely to have economic or diplomatic disputes or breakdowns in cooperation with the United States; allied states are also likely to be more cooperative and trade should remain free if hot conflict emerges. Unfriendly and unallied states do not offer these benefits, at least not as reliably. We therefore expect that greater numbers of allied or friendly states that are viable sourcing options will lead to sharply declining imports from China and a reduced need to request exclusions from tariffs. On the other hand, greater numbers of non-allied or non-friendly states should have a weaker impact on US imports from China and exclusion requests.
- Hypothesis 2. Post-trade war US imports from China will particularly decline for products with a greater number of allied or friendly countries available as existing suppliers, but will decline less with greater numbers of non-allied or unfriendly alternative markets.
3 Changes in Chinese imports and alternative suppliers
In this section, we examine whether products widely available from non-Chinese markets saw larger reductions in imports from China after the trade war than products for which non-China suppliers were scarce. After confirming this pattern, we follow up with an analysis showing that these effects are driven entirely by re-sourcing to allied or geopolitically aligned alternative markets. US importers of Chinese goods have exited China more rapidly where friendly alternate suppliers exist, but have not been tempted by opportunities to couple with economically viable, but unfriendly, trade partners. We also show that these effects have not only persisted, but grown, over the years 2021-23 speaking to the accelerating demand for safe non-China suppliers.
3.1 Trade data and import changes design
We first need to measure US imports. To do so, we gather import data at the 10-digit HS code for each US trade partner from the Census Bureau’s “USA Trade Online” database.Footnote22 10-digit HS codes are a very fine level of product disaggregation and the level at which tariffs are usually administered. We use the subscript i to denote 10-digit HS code products.
Our main explanatory variable is called and it builds on the variables in Fig. 2. This variable initially is equal to the number of markets, among the US’s top 10 non-China import suppliers, from which the US imported a non-zero volume of a given HS product i between 2012 and 2016. We divide this by 10 to place it on a scale from 0 to 1. Subsequently, we employ a second version of the variable which is defined analogously but examines the US’s top-25 non-China suppliers (and so falls on a scale from 0 to 25). We then employ a third version of which is the total number of non-China markets (of 228) from which a product was imported by the US before the trade war. These latter two versions of the variable are added to 1 and logged. The variables represent established available supply relationships before the trade war commenced.
With data on imports from China after the trade war, we could simply examine whether US imports from China are lower for products with larger numbers of available alternative suppliers. However, an obvious objection to this is that industries are not equal in their initial sizes in ways that are likely to be correlated with the number of . It is valuable then to difference out initial or pre-trade war differences in US imports that are a function of from China, to focus solely on declines in US imports driven by variation in that are specific to the time period after the trade war and the breakdown in US-China relations. This reasoning is analogous to a difference-in-differences design, though we do not here focus on a precisely defined causal estimand or interpretation given that our “treatment” variable is continuous and not time-varying. Instead, we view this differencing as a crucial step to eliminate an obvious threat to a simple descriptive question: did US imports from China decline more after the trade war for products that are widely available in other markets?
A second layer of differencing will help to address an additional concern. Suppose that products with high numbers of are on a different import trajectory over time, perhaps because these products are accounting for a steadily increasing share of US imports or because they were affected differently by pandemic-era demand shocks. These trajectories might confound isolating the effect of alternative markets on declining imports from China that are specific to the US-China relationship and not just a general feature of US import trends. Differencing out trends in imports from the rest of the world (i.e., all markets but China) would help to address this concern by removing those changing trajectories.
To effect our first layer of differencing, our analysis uses two time periods: a pre-trade war baseline era and a post-trade war era. We begin our pre-trade war timeline in 2012 because a major revision of tariff codes occurred in that year, making matching up 10-digit trade data before and after 2012 inexact. Five years of trade data is also ample to measure a stable baseline of trade patterns. We exclude the year 2017 from our analysis because the trade war had not begun, but was prospective with the election of Donald Trump in late 2016. Our second time period therefore runs from 2018 to 2020, the year that the US-China ‘Phase One’ deal was signed. We use the subscript to denote the pre- and post-trade war periods, respectively. We supplement this analysis by examining the persistence of import declines into the first years of the Biden administration (2021-23) which largely froze in place the trade war tariffs and saw intensifying economic and security tensions.
To accommodate our first and second layers of differencing, our main outcome variable is the average annual US imports from either China or the rest of the world across the different time periods. We call this variable: . As an example, is the sum of US imports of product i from China over the years 2012-16 divided by 5. is the sum of US imports from all other non-China markets of the same product i over the years 2018-20 (or 2021-23) divided by 3. Because this variable is skewed and contains zeros, we log it after adding 1 to it. Because some tariff codes are unused, we drop all observations that have zero US imports from the world in the first time period.
Our first main right hand side variable is . This variable equals zero in the pre-trade war period (2012-16) and equals one in the post-trade war periods (2018-20, and then 2021-23). Our second variable is which is equal to one if the market is China or zero if the markets in question are the rest of the world. Our third main explanatory variable is called as described above.
To provide additional control, we include in all specifications HS 10-digit/market fixed effects which we call , that is, a separate intercept for each product in each market, China or the rest of the world. Note that these fixed effects absorb the lower-order terms for the variable, , and their interaction. They also control for all other product-level features that are unchanging over time – competitiveness, differentiation, import elasticities, and the total pre-trade war US imports of a product, for example – and all unchanging product-level features that are specific to each market – product-level US-China comparative advantage, for example. These fixed effects also control for any effect of variation in trade war tariffs across products. We include in some models Time period/market/HS 2-digit-time fixed effects which we call . These fixed effects control for industry-level features, including industry-level features that are China-specific, that change over time.Footnote23
Our complete specification is:
Note that our estimand of interest is . If the sign of this coefficient is negative, then products with more alternative markets will have reduced their imports from China more after the trade war began. In particular, using the top-10 measure, products with 10 alternative markets will see imports from China increased or reduced (depending on whether the sign of is positive or negative) by roughly percent more compared to products with 0 alternative markets. Using the (logged) top-25 measure and all other markets measure, products with double the number of alternative markets will see imports from China increased or reduced (depending on whether the sign of is positive or negative) by roughly percent.
3.2 Results on changes in imports
The results of this investigation are presented in Table 1. Note that results on the initial post-trade war period during the Trump administration (2018-20) are contained on the left-hand side of the table, while results using the Biden era (2021-23) are contained on the right hand side.
We start with defined for the top-10 non-China markets, which is examined in the top part of the table. Looking at the results without the time-period/market/industry fixed effects, we first observe that our primary parameter of interest, the interaction term , is negative, significant, and large. Imports from China that are available in a larger number of alternative markets saw significantly greater import declines after the trade war began than imports with fewer alternative markets. The net effect of the trade war on imports for products available from every one of the 10 other major markets translates to roughly a 29–34% greater average decline in imports than products with 0 other major suppliers during the initial period. This is strongly consistent with our argument in Hypothesis 1 that US importers will substitute away from Chinese imports more when alternate suppliers are available.Footnote24
This core finding holds again when the time-period/market/industry fixed effects are included in the model (as seen in column 2 of the top part of the table). An even greater impact of the fraying US-China relations is seen in the 2021-23 period (in columns 3 and 4 of the top part of the table). Declines in imports of products with many alternative markets increase to or more. These are large effects, which illustrate the durability – in fact, the acceleration – of decoupling to the present day. But note that they are limited to products with many available alternative markets. Products with fewer alternatives see much smaller changes in imports from China.
We see substantively similar results using our extra measures of defined with the top-25 non-China markets, in the middle part of Table 1, and with all non-China markets, in the bottom part of Table 1. A doubling in the number of top-25 is predicted to reduce imports from China by about 15–17% relative to the pre-trade war era in the years 2018-20 and by 21–27% for 2021-23. Likewise, a doubling in the number of all is expected to reduce imports by about 11–13% earlier on and 16–21% after.
We provide three robustness checks of our findings. First, in Appendix A (available on the Review of International Organization’s webpage), we employ a measure of total trade volume from non-China markets rather than the number of available markets as our main explanatory variable. This alternative formulation captures differences in market size among alternative import sources. In these models, we see a robust negative effect of the volume of trade from non-China markets on imports from China after the trade war’s onset. Second, we use a measure of alternative markets based on whether countries previously exported to any market in the world, not just the US. We show that our main findings are very similar using these alternative measures in Appendix A. Third, in Appendix B, we show that our main results on declines in imports are somewhat smaller but generally robust to the inclusion of exactly parallel triple-interaction terms using Section 301 tariffs as extra explanatory variables. These are taxing tests due to the proliferation of interaction terms, so the similar findings are reassuring.
In total, all of our models and estimates support the idea that American companies with greater numbers of potential suppliers or alternative markets were better able to turn away from China once the trade war began.
3.3 Allyshoring, friendshoring, and changes in Chinese imports
So far our analysis has focused on the availability of any alternative market from which to source goods as a replacement for China. But of course, the context of the US-China trade war and broader decoupling is one of sharply heightened bilateral tensions, as well as interference by the Chinese and US governments in the operations of one another’s firms. In this setting, firms might be loathe to exit China only to begin sourcing from another unfriendly or non-allied nation that poses similar political and geopolitical risks. This suggests a firm-centric version of allyshoring or friendshoring focused on the business risks of sourcing from non-aligned states which complements the state-focused discussion of these topics in grand strategy.
To test this idea, we recreate our design from above but focus on only allied (and then non-allied) states, and then only friendly (and non-friendly) states.Footnote25 We expect that our core findings will hold strongly among allied or friendly states, but will be weaker among non-allied or unfriendly states.Footnote26 In the models, we replace trade measures that previously examined all non-China markets with subsets of these markets, allied or non-allied states, then friendly or non-friendly states. These changes are applied to the Alternative markets explanatory variable and to the Imports outcome variable when examining imports from non-China markets. Because most of the US’s top-10 and top-25 non-China trade partners are friends or allies, we focus on subsets of all non-China markets and not subsets of the top-10 or top-25 markets. Our research designs are therefore identical in every way to the designs in the bottom-third of Table 1 but for the updated trade variables.
We present the results on changes in US imports from China in Table 2. The top half of the table examines results on allied and non-allied markets, respectively. We first see that Allied alternative markets has a very large and significant negative effect on reductions in post-trade war US imports from China, somewhere around a 11–14% greater reduction when the number of such markets doubles in the early post-trade war period and 15–20% in the later period. However, Non-allied alternative markets has no statistically significant effect on imports from China. Apparently, many firms importing from China do not view non-allied states as good substitutes for importing from China. Note that our two layers of differencing partial out pre-existing trade with these allied or non-allied states, so our finding is not driven by obvious confounding country-level factors that correlate with being a US non-ally.
We see very similar results when we look at friendly and non-friendly states in the bottom half of Table 2.Footnote27 Imports to the US decline dramatically after the trade war when many friendly alternative markets are available for sourcing. Meanwhile, imports to the US do not decline as the number of non-friendly alternative markets increases. Moving from China to another unfriendly state would not be prudent in present circumstances. All of these results strongly support Hypothesis 2.Footnote28
These findings supply an opportunity to discuss transshipment of Chinese exports and reinvestment by Chinese firms seeking to access the US from outside of China. On one hand, it is certainly true that some of the import declines we document represent transshipment or new Chinese FDI in other US trade partners.Footnote29 This point reinforces our broader theme on the enormous challenges associated with effective decoupling. On the other hand, we don’t think that all or even most of the decoupling we find represents transshipment or new Chinese FDI. This is not only because we focus on pre-existing exporters to the United States, as noted above, but also because Chinese firms would likely find relocating production to US friends and allies to be both slow and politically risky. US firms relocating to US allies face a clear improvement in risk; Chinese firms relocating to a US ally are trading one set of risks for another.
Overall, we conclude that reductions of imports from China were strongly facilitated by the availability of allied and aligned alternative import options, but not by the availability of non-allied or unfriendly import options. These strikingly clear differences reflect the political origins of the trade war, and the role of political considerations in firms’ decisionmaking.
4 Exclusion requests
The unfolding of the US-China trade war provides an additional setting in which to test our claim that the availability of allied import options encourages decoupling from China: requests directed at US regulators that particular Chinese imports be “excluded” from trade war tariffs. We show that products with more available alternative markets, particularly allied or friendly markets, received fewer exclusion requests. This suggests that where viable alternative markets for sourcing did not exist, importers had to stick with Chinese suppliers and fight the tariffs imposed by the Trump administration. Where viable alternative markets did exist, importers accepted the tariffs, and likely cut ties with China and moved on to alternative options.
Recall that the Trump administration introduced a vast array of new trade barriers against China under the authority of Section 301 of the Trade Act of 1974. These tariffs ranged from 7.5% to 25% and were imposed on approximately $370 billion worth of US imports from China. The tariffs generated unprecedented pushback from US producers, who opposed the trade war by joining coalitions and submitting comments to the USTR.Footnote30 In response, and to minimize the most egregious distortions, the USTR devised a tariff exclusion process whereby interested parties, usually firms but also trade associations and others, could petition for specific goods to be exempted from the tariffs. Following each round of tariffs, notices were posted on the Federal Register, inviting interested parties to make a case for exclusion. Firms and industries that requested exclusion did so publicly, and provided details on the tariff codes for which they sought exclusion.
The exclusion request process provides critical evidence on the revealed preferences of American producers. Firms that filed exclusion requests stated that they opposed the tariffs and were in need of tariff abatement. They had previously benefited from imports from China and planned to maintain business with China while fighting the new taxes on Chinese imports imposed by the Trump administration. In contrast, for producers with a viable alternative market from which to source the import, the need for requesting tariff exclusion was probably much less strong. Rather than spending time and money to file an exclusion request with a highly uncertain chance of success (Eldes et al., 2025), firms with viable outside import options could afford to move on from China.
This argument suggests that the existence of alternative markets reduces the need of exclusion requests, in the same way that the existence of alternative markets reduces imports from China:
- Hypothesis 3. Products with a greater number of countries available as existing suppliers will receive fewer exclusion requests.
As above, the availability of allied or friendly markets will particularly reduce exclusion requests:
- Hypothesis 4. Products with a greater number of allied or friendly countries available as existing suppliers will particularly receive fewer exclusion requests. Exclusion requests will decline less with greater numbers of non-allied or unfriendly alternative markets.
We examine this exclusion request process at the product level, where we expect products that are easier to source from non-China markets will receive fewer exclusion requests than products that are harder to source outside of China.
Before turning to this analysis, it is important to address the role that the availability of foreign markets played in the exclusion request and exclusion granting processes. Firms requesting exclusion were asked to provide information on whether alternative suppliers for their products were available in the US or in third markets. It is possible then that a negative correlation between alternative markets and requesting exclusion might be driven by firms that were deterred from requesting exclusion by this request, fearing their request would be rejected. This may partially account for any findings in line with Hypotheses 3 and 4, but we do not think it will entirely account such findings for three reasons. First, the USTR did not explicitly state that firms with available third markets would be denied exclusion.Footnote31 12.4% and 7.0% of exclusion requesters, respectively, stated that they had available third markets or were not sure. Second, even in the presence of available third party suppliers, firms could have claimed that they had no available third party suppliers since this determination involves private and subjective information on the viability of substitute products and suppliers. Third, the USTR granted exclusions at comparable rates to firms that acknowledged viable third party suppliers (13.14%) to firms that denied having such suppliers (13.45%). The gap in exclusion granting between these groups remains modest in multivariate regression models. For these reasons, we suspect that any relationship between availability of alternative suppliers and avoiding exclusion requesting is not simply a result of deterrence.
4.1 Design and results on exclusion requests
To examine product-level requests for exclusion, we use a logged countFootnote32 of the number of exclusion requests for each product ().Footnote33 We use the superscript because the exclusion requests took place in the second time period (2018-20). We continue to measure the number of alternative markets in the pre-trade war era () to understand the impact of preexisting alternative markets. Unlike the trade data, no pre-treatment period is observable, so our models are cross-sectional. We use the following specification:
We include as controls and which were half of the outcome vector in the preceding analysis. is a dummy variable for whether a particular product was covered by a trade war tariff. Naturally, we expect that covered products will be the focus of exclusion requests and coverage of trade war tariffs may incidentally correlate with the number of available alternative markets. refers to 2-digit HS code fixed effects, which control for other industrial features such as industry-level supply and demand factors, industrial structure, and political organization. As a robustness check, we also include models with 4-digit HS code fixed effects.Footnote34
The results for these models are provided in Table 3. First, we see that the measures of alternative markets are all negatively and significantly correlated with requests for exclusions. The sizes of the effects are large, especially given that only about 21% of products in the sample received an exclusion request and the average number of requests per product was 2.61. For example, increasing the number of alternative markets (in the top row, using the top-10 measure) from 0 to 10 is predicted to reduce the number of exclusion requests by more than 40%. In the middle row, doubling the number of alternative markets is predicted to reduce exclusion requests by 18–20%. The estimates are also negative and significant in the bottom row. All of our main findings are not significantly altered by the inclusion of 4-digit rather than 2-digit HS code fixed effects. In support of Hypothesis 3, we conclude that imports from China that were available in a greater number of non-China markets received significantly fewer exclusion requests.Footnote35
4.2 Allyshoring, friendshoring, and exclusion requests
We report our allyshoring and friendshoring findings on exclusion requests in Table 4. In the case of allyshoring, we see a consistently negative effect of alternative markets on requests for exclusion from trade war tariffs when only allied markets are included in the count of potential alternative. Alternative markets has no significant effect in any of the models when it is a count of non-allied trade partners. The results on friendshoring are similar. There is a negative and significant effect of alternative markets among friendly states but no negative effect among non-allied states.
Overall, we see a strong tendency for exclusion requests to be reduced when many allied or friendly import options are available, but not when many non-allied or unfriendly options are available. Firms facing the latter situation were more likely to fight the trade war tariffs; firms with many allied/friendly options decided to move on from China. These findings illustrate the importance of political factors in shaping decoupling from China. Put simply, the pressures for decoupling have mainly political origins, so the choices of firms to leave for new markets are strongly influenced by political factors, too. We also note that the enormous heterogeneity in the results between allied and non-allied markets are again suggestive that decoupling, where it has occurred, will be relatively permanent. Temporary relocation to an unfriendly state might be a plausible short-term business strategy, but in the heightened political tensions of the 2020 s, long-term considerations favor relocating sourcing and production to friends, allies, and the home market.
5 Conclusion
We developed and tested a theory of decoupling which emphasizes that alternative product markets are a key enabling factor for decoupling from a now disfavored supplier market. This seemingly economic decision is fundamentally impacted by a political factor – whether alternative importing options are available in states allied to or friendly with the home market. Our results strongly support the notion that US firms and industries that previously sourced imports from China are concerned about political risk in their search for new markets. Firms with many allied import options are in a strong position to abjure Chinese imports and so have less need to fight US tariffs on China. Firms without allied import options are stuck with Chinese imports, and must fight the tariffs. And while our motivation and findings are centered on the US-China trade war, our theoretical apparatus and its potential applications are much more general, particularly in light of growing trade disorder across the globe. What do our findings mean for the future evolution of trade and trade politics?
Most obviously, our findings help us to speculate about the future course of decoupling. The United States, and some of its allies, have identified decoupling from China in economically and militarily strategic sectors as a key long-run goal. This demand has pushed reshoring/friendshoring and industrial policy to the forefront, while deepening skepticism about free trade ideology and global trade order (Kastner, 2007; Morrow et al., 1998; Mansfield, 1995). While we provide evidence of incipient decoupling and allyshoring/friendshoring, our findings suggest that decoupling will be slow and costly for many industries. Decoupling requires not only a shock to costs but also a better option for sourcing. In the absence of a better option, American businesses and consumers will only pay higher trade costs as tariffs and other trade barriers designed to induce decoupling are imposed (Amiti et al., 2019; Fajgelbaum & Khandelwal, 2022), while US imports from China will be little changed. And while some of the costs of trade war tariffs will be borne by China too, the incidence on Chinese producers of trade war tariffs will be especially low where outside options are lacking. Strategic concerns around the over-reliance on Chinese-made products will remain. Decoupling in the absence of alternative options will be a long-term project with many difficulties.
Our findings also help us to interpret the future politics of the China trade war and other trade disputes. On one hand, the challenges of decoupling suggest that dissatisfaction with trade wars from importing, exporting, and offshoring firms will continue (Zeng, 2021; Lee & Osgood, 2021, 2022). Easily available alternative substitutes to Chinese-made products are very hard to come by for some firms. This reality will ensure continuing demand for exclusion processes and heighten the value of political assets – capacity to lobby, political connections with Congress and the White House, politically strategic locations in terms of geography and industry – that contribute to exclusion success (Lopatin et al., 2024; Liu et al., 2022; Lee & Osgood, 2022; Born et al., 2024). Our findings, alongside the literature on politicized exclusion decisions, also highlight a tension in the exclusion process – between firms that would benefit the most economically from exclusion and exclusion decisions that are based on other, more political criteria. However, we note also that these tensions may dissipate, and the demand for exclusion begin to ebb, as more and more firms track down or cultivate alternative suppliers. So, resistance to decoupling from China may have already peaked and partial decoupling may be gradually institutionalized. China-dependent firms may have to invest in costly adjustments away from China though such adjustment will not be cheap or easy.
Our findings also speak to a much broader set of policy areas where businesses may wish to move on from undesirable markets because of new material or non-material costs. For example, firms may also wish to move on from sanctioned countries, countries with poor labor or environmental practices, and countries with conflict and other political risk (Fuchs & Klann, 2013; Early, 2009; Mosley & Uno, 2007). One view of MNCs (and other firms operating globally) has always been that they are defined by their mobility and choices, and can swiftly use that mobility to punish markets that do not accommodate their desires (Mosley & Uno, 2007; Davies & Vadlamannati, 2013; Charny, 1991). On the other hand, the literature on MNCs and political risk – especially the obsolescing bargain (Vernon, 1971) – emphasizes that MNCs (and other globally trading firms) are relatively stuck once costly investments in foreign plants and foreign trade relationships are made (Jensen et al., 2012; Jensen, 2008; Wellhausen, 2014). Our approach synthesizes these two accounts by clarifying the scope conditions under which firms are either secure, due to their mobility and outside options, or vulnerable, due to their immobility and paucity of exit options.
Data availability
The datasets generated and analyzed for this study are available from the corresponding author on reasonable request.
Notes
-
Hua and Zeng (2022); Wei (2019); Bown (2019); Davis and Meunier (2011); Kastner (2007).
-
Antras and Helpman (2004); Defever and Toubal (2013); Carnegie (2014); Gowa and Mansfield (2004).
-
Henderson (1997); Krugman (1991); Smith and Florida (1994); Head et al. (1999); He (2003).
-
Zeng and Li (2021); Zeng et al. (2020, 2023).
-
On the trade war, see Lee and Osgood (2021, 2022); Kim and Margalit (2021); Steinberg and Tan (2023).
-
Liu et al. (2022).
-
Wellhausen (2014); Johns and Wellhausen (2016); Jensen et al. (2012); Jensen (2008); Vernon (1971).
-
Mosley and Uno (2007); Charny (1991); Davies and Vadlamannati (2013); Pond and Zafeiridou (2020); Thrall (2025); Lee (2024); Ballor and Yildirim (2020); Betz et al. (2021).
-
Zeng and Li (2021); Zeng et al. (2020, 2023); Kim and Rosendorff (2021); Kim and Spilker (2019); Kim et al. (2019); Osgood (2018); Yildirim et al. (2018); Baccini and Dür (2018).
-
Li et al. (2022); Kim and Milner (2021); Anderer et al. (2020); Osgood et al. (2017); Hanegraaff et al. (2015); Newhouse (2009); Gawande et al. (2006).
-
The US was a net-exporter of services to China in that year, with a surplus of $37.6 billion and total services exports of about $54 billion (Baccini et al., 2019).
-
Data in Fig. 1 on annual goods trade with China (and the world) are from the US Census Bureau and available at https://www.census.gov/foreign-trade/balance/c5700.html and https://www.census.gov/foreign-trade/balance/c0004.html, respectively.
-
Data in Fig. 1 on US direct investment abroad comes from the Bureau of Economic Analysis “U.S. Direct Investment Abroad, U.S. Direct Investment Position Abroad on a Historical-Cost Basis” available at https://www.bea.gov/itable/direct-investment-multinational-enterprises. Data on FDI in the US comes from the BEA’s “Foreign Direct Investment in the U.S., Foreign Direct Investment Position in the United States on a Historical-Cost Basis,” available at the same web address.
-
We primarily are thinking of US and US-based firms, however, Chinese firms exporting to the US may also be motivated to move production or transship exports. Many of our arguments below – on the challenges of exiting the Chinese market and the suitability of alternative markets – apply to both types of firms. However, US and Chinese firms will of course differ in their perceptions of the sources and effects of political risk. We touch on this point below and also consider our empirical findings in light of concerns over transshipment and Chinese FDI.
-
https://qz.com/1654798/these-are-the-products-the-us-is-most-reliant-on-china-for.
-
The data for these variables comes from USA Trade Online, “Harmonized System (HS) District-level Data” selecting Imports. Customs values are in nominal US $ for 10-digit HS commodities from 2012 to 2016. Our approach based on pre-existing exports to the United States benefits from the US’s fine-grained product-level trade data (at the 10-digit HS level). It is also plausible that pre-existing exporters to the US have overcome the challenges of serving US firms, consumers, or regulators and so are viable as potential substitutes for Chinese-made products. However, firms might also be able to source from countries that didn’t previously export to the US but have previously exported a product to the rest of the world. Thus, we explore in Appendix A an alternative measure based on the number of markets that export to any country, not just the US. (This measure is only available at the 6-digit HS code level.) Using a cutoff value of at least $10 m. in exports over the years 2012-16, this measure also varies widely across products.
-
Among 2-digit HS code industries with at least 100 products, footwear (64); clocks and watches (91); non-knitted apparel (62); organic chemicals (29); and staple fibers (55) have the highest shares of products with both a) fewer than 5 top-10 trade partners and b) the US importing more than 50% of its imports of the product from China.
-
The same five industries just noted, though in a different order, have the highest share of products that are a) sourced from fewer than 10 markets and b) the US importing more than 50% of its imports of the product from China. The next five with at least 100 products are: fish and crustaceans (03); inorganic chemicals (28); miscellaneous manufactures (96); dyes and pigments (32); and knitted fabrics (60).
-
We use data from the Alliance Treaty Obligations and Provisions (ATOP) project (Leeds et al., 2002). We count as ‘allies’ all countries with whom the US has an offensive, defensive, or neutrality pact commitment that is active as of 2018. (See Appendix A for a list.) We do not count non-aggression pact commitments for this project, since the US is a party to many non-aggression pacts with clearly unfriendly regimes, including Russia.
-
This measure is clearly bimodal with modes at around 1.7 and 3.2 and a trough at around 2.2. We define ‘friends’ as any state with a distance measure below 2.25. And while the UN General Assembly voting-based measure is only a proxy for friendship, it captures one dimension of alignment among states. (See Appendix A for a list of states coded as friendly.)
-
Our focus on pre-existing US suppliers informs our interpretation of the findings in light of concerns over transshipment and Chinese foreign investment to evade tariffs. If imports from China fall in the wake of the trade war and rise in countries that were already exporting to the US, it is plausible that these are not simply transshipment but reflect actual production from those countries since transshipped products need not be routed through pre-existing suppliers. Likewise, failure to decouple where pre-existing non-China suppliers are absent is also not consistent with a transshipment story. The rapid appearance of decoupling from 2018 to 2020 (where alternative markets are available) is also suggestive that Chinese FDI and production relocation was not the dominant explanation, since FDI is relatively slow moving.
-
We use the imports data from “Harmonized System (HS) District-level Data US” available at the data source selection page. Our search parameters are: Measures: Customs Value (Gen) ($US) (default); Commodity: All HS10 commodities; Country: One of China or other import markets; Country subcode: All country subcodes (default); District: All districts (default); Rate provision: All rate provisions (default); Time: 2010-2023; Time: Annual. Note that we focus on merchandise imports: Agricultural, minerals, and manufactured products. We are not able to conduct a similar study of services imports since services are only measured at highly aggregated categories. However, we see no reason why our argument would not extend in theory to service imports.
-
Note that these fixed effects absorb the lower order terms for and its interaction with . We include those in the equation below but they are in fact only included in models where the are dropped. We cluster standard errors at the HS 6-digit level in all models. This level of aggregation reflects the usual standard for “products” in the international trading system. Clustering at this level may account for differences in variability across product categories.
-
Our design-influenced focus on the sign of the triple interaction coefficient is consistent with a decline in imports from China of high alternative markets goods (which aligns with a story about decoupling). But it could also reflect a surge in imports from China of low alternative markets goods (which does not fit our argument). Thus, we examined predicted changes in trade from the triple interaction models referenced in Table 1 model 1 across the 10th, 50th, and 90th percentile of the alternative markets variable. For the top-10 variable, the changes in trade with China are all negative. This is also true for the top-25 and all partners variable. Thus, we are confident that our design is not obscuring significant increases in imports from China for particular goods.
-
As a reminder, allied states are US offense, defense, and neutrality pact allies as of 2018 (Leeds et al., 2002). Friendly states are states that are sufficiently close in distance to the US’s UNGA ideal point (Bailey et al., 2017).
-
Readers may be concerned that any differential finding to this effect may be driven by the small economic size or trade profile of US non-allied/non-friends. We do not find this to be the case: non-allied markets account for 28.5% of US imports from non-China countries over the years that we examine, while non-friendly markets (as we define it below) account for 43.5% of US non-China imports. Thus, the scope for importing from non-allied and especially non-aligned markets remains significant. Moreover, we note that our research design, which partial out pre-existing total and trends of trade with non-allied or unfriendly states precludes that lower volumes of trade could be driving our findings.
-
The difference in estimated effects comparing the allied alternative markets and friendly alternative markets are generally modest and aren’t systematically in one direction or the other. We attribute this to two things. First, both allied and friendly markets offer desirable features to firms considering relocating production and, second, many of the US’s most important allied trading partners are also classified as friends, and vice versa.
-
We show in Appendix A that these conclusions are robust to excluding, and so not solely driven by, trade patterns with two major East Asian trade partners that are stalwart US allies: Japan and South Korea.
-
For example, some Chinese companies have been reported to send consumer electronics or steel products to Vietnam for minimal processing and re-export to the US. Investments in Mexico by Chinese furniture manufacturers have contributed to rapidly growing US furniture imports and Chinese auto manufacturers’ growing presence in Mexico has sparked significant concern (and trade policy threats) in the US.
-
The dominant reason stated for this opposition was disruptions to sourcing of inputs and final goods from China. In fact, 87.9% of producers mentioned disruption to existing supply chains as the main motivation for political mobilization (Lee & Osgood, 2021).
-
The USTR’s FAQs page (Initial $34 Billion Trade Action Exclusion Process FAQs, p.5), for example, said that cases would be evaluated “on a case-by-case basis” and that the USTR “may consider… whether the particular product and/or a comparable product is available from sources in the United States and/or in third countries” among several other factors. Similar language on “case-by-case” evaluation appeared in the original calls for exclusion requests. A GAO (2021) report on the exclusion request process followed up: “According to USTR officials, no one factor was essential to grant or deny a request. For example, USTR might grant a request that demonstrated the tariffs would cause severe economic harm even when the requested product was available outside of China.”
-
We also examine a dummy variable for whether the product received at least one exclusion request in Appendix A.
-
For all tranches of the Section 301 tariffs, the USTR created an exclusion process whereby interested parties could petition for an exemption from the tariff increases. Firms could request that a particular product, classified within a 10-digit HS subheading, be excluded. Note that while the Section 301 tariffs were announced at the 8-digit levels, all exclusion requests were required to be made on HS 10-digit level products. So the 10-digit HS code is the appropriate unit of analysis for our investigation of exclusion requests. All submissions were made public under different dockets. The four relevant dockets are USTR-2018-0025, USTR-2018-0032, USTR-2019-0005, and USTR-2019-0017.
-
Note that 10-digit fixed effects or time-varying industry fixed effects are not feasible in the exclusion requests data, unlike the imports data, since the data structure is a panel with a 10-digit HS code unit-of-analysis. 4-digit HS code fixed effects represent over 1,200 different industries and so are a quite fine level of disaggregation for partialing out unmeasured industry-specific trends. We again cluster standard errors at the HS 6-digit level.
-
In Appendix B, we show that our main findings are robust to the inclusion of a measure of the size of trade war tariffs.
References
-
Ahn, D., & Lee, J. (2011). Countervailing duty against China: Opening a Pandora’s box in the WTO system? Journal of International Economic Law, 14(2), 329–368.
-
Amiti, Mary, Redding, Stephen J., & Weinstein, David E. (2019). The impact of the 2018 tariffs on prices and welfare. Journal of Economic Perspectives, 33(4), 187–210.
-
Anderer, C., Dür, A., & Lechner, L. (2020). Trade policy in a “GVC World’’: Multinational corporations and trade liberalization. Business and Politics, 22(4), 639–666.
-
Antras, P., & Helpman, E. (2004). Global sourcing. Journal of Political Economy, 112(3), 552–580.
-
Autor, D. H., Dorn, D., & Hanson, G. H. (2016). The China shock: Learning from labor-market adjustment to large changes in trade. Annual Review of Economics, 8, 205–240.
-
Baccini, L., & Dür, A. (2018). Global value chains and product differentiation: Changing the politics of trade. Global Policy, 9, 49–57.
-
Baccini, L., Osgood, I., & Weymouth, S. (2019). The service economy: US trade coalitions in an era of deindustrialization. The Review of International Organizations, 14(2), 261–296.
-
Bailey, M. A., Strezhnev, A., & Voeten, E. (2017). Estimating dynamic state preferences from United Nations voting data. Journal of Conflict Resolution, 61(2), 430–456.
-
Ballor, G. A., & Yildirim, A. B. (2020). Multinational corporations and the politics of international trade in multidisciplinary perspective. Business and Politics, 22(4), 573–586.
-
Betz, T., Pond, A., & Yin, W. (2021). Investment agreements and the fragmentation of firms across countries. The Review of International Organizations, 16, 755–791.
-
Born, V., Brown, L. W., & Hasija, D. (2024). Who obtains political exemptions? An attention-based analysis of steel tariff exclusion requests. Journal of International Business Policy, 7(2), 166–180.
-
Bown, C. P. (2019). The 2018 US-China trade conflict after forty years of special protection. China Economic Journal, 12(2), 109–136.
-
Carnegie, A. (2014). States held hostage: Political hold-up problems and the effects of international institutions. American Political Science Review, 108(1), 54–70.
-
Charny, D. (1991). Competition among jurisdictions in formulating corporate law rules: An American perspective on the race to the bottom in the European communities. Harvard International Law Journal, 32, 423.
-
Davies, R. B., & Vadlamannati, K. C. (2013). A race to the bottom in labor standards? An empirical investigation. Journal of Development Economics, 103, 1–14.
-
Davis, C. L., & Meunier, S. (2011). Business as usual? Economic responses to political tensions. American Journal of Political Science, 55(3), 628–646.
-
Defever, F., & Toubal, F. (2013). Productivity, relationship-specific inputs and the sourcing modes of multinationals. Journal of Economic Behavior & Organization, 94, 345–357.
-
Early, B. R. (2009). Sleeping with your friends’ enemies: An explanation of sanctions-busting trade. International Studies Quarterly, 53(1), 49–71.
-
Eldes, A., Lee, J., & Osgood, I. (2025). Trade lobbying works (for big firms): Evidence from the China trade war. Business and Politics, 1–35.
-
Fajgelbaum, P. D., & Khandelwal, A. K. (2022). The economic impacts of the US-China trade war. Annual Review of Economics, 14, 205–228.
-
Feenstra, R. C., & Sasahara, A. (2018). The ‘China shock’, exports and US employment: A global input-output analysis. Review of International Economics, 26(5), 1053–1083.
-
Freund, C., Mattoo, A., Mulabdic, A., & Ruta, M. (2024). Is US trade policy reshaping global supply chains? Journal of International Economics, 152, 104011.
-
Fuchs, A., & Klann, N.-H. (2013). Paying a visit: The Dalai Lama effect on international trade. Journal of International Economics, 91(1), 164–177.
-
GAO. (2021). U.S.-China Trade: USTR should fully document internal procedures for making tariff exclusion and extension decisions. Report to Congressional Requesters GAO-21-506 U.S. Government Accountability Office. Retrieved October 19, 2021 from https://www.gao.gov/assets/gao-21-506.pdf
-
Gawande, K., Krishna, P., & Robbins, M. J. (2006). Foreign lobbies and US trade policy. The Review of Economics and Statistics, 88(3), 563–571.
-
Gowa, J., & Mansfield, E. D. (2004). Alliances, imperfect markets, and major-power trade. International Organization, 58(4), 775–805.
-
Handley, K., & Limão, N. (2017). Policy uncertainty, trade, and welfare: Theory and evidence for China and the United States. American Economic Review, 107(9), 2731–2783.
-
Hanegraaff, M., Braun, C., De Bièvre, D., & Beyers, J. (2015). The domestic and global origins of transnational advocacy: Explaining lobbying presence during WTO ministerial conferences. Comparative Political Studies, 48(12), 1591–1621.
-
He, C. (2003). Location of foreign manufacturers in China: Agglomeration economies and country of origin effects. Papers in Regional Science, 82(3), 351–372.
-
Head, C. K., Ries, J. C., & Swenson, D. L. (1999). Attracting foreign manufacturing: Investment promotion and agglomeration. Regional Science and Urban Economics, 29(2), 197–218.
-
Henderson, V. (1997). Externalities and industrial development. Journal of Urban Economics, 42(3), 449–470.
-
Hillman, J. (2023). China’s Entry into the WTO: A Mistake by the United States? In H. Hao & D. Raess (Eds.), China and the WTO: 20 Years On (pp. 400–426). Cambridge University Press.
-
Hua, S., & Zeng, K. (2022). The US-China trade war: Economic statecraft, multinational corporations, and public opinion. Business and Politics, 24(4), 319–331.
-
Hung, H.-f. (2021). The periphery in the making of globalization: The China lobby and the reversal of Clinton’s China trade policy, 1993–1994. Review of International Political Economy, 28(4), 1004–1027.
-
Jensen, N., Biglaiser, G., Li, Q., & Malesky, E. (2012). Politics and Foreign Direct Investment. University of Michigan Press.
-
Jensen, N. M. (2008). Political risk, democratic institutions, and foreign direct investment. The Journal of Politics, 70(4), 1040–1052.
-
Jisi, W., & Ran, H. (2019). From cooperative partnership to strategic competition: A review of China-US relations 2009–2019. China International Strategy Review, 1, 1–10.
-
Johns, L., & Wellhausen, R. L. (2016). Under one roof: Supply chains and the protection of foreign investment. American Political Science Review, 110(1), 31–51.
-
Kastner, S. L. (2007). When do conflicting political relations affect international trade? Journal of Conflict Resolution, 51(4), 664–688.
-
Kim, I. S., & Milner, H. V. (2021). Multinational corporations and their influence through lobbying on foreign policy. Washington, DC: The Brookings Institution chapter, 12, 497–536.
-
Kim, I. S., Milner, H. V., Bernauer, T., Osgood, I., Spilker, G., & Tingley, D. (2019). Firms and global value chains: Identifying firms’ multidimensional trade preferences. International Studies Quarterly, 63(1), 153–167.
-
Kim, S. Y., & Rosendorff, B. P. (2021). Firms, states, and global production. Economics & Politics, 33(3), 405–414.
-
Kim, S. Y., & Spilker, G. (2019). Global value chains and the political economy of WTO disputes. The Review of International Organizations, 14, 239–260.
-
Kim, S. E., & Margalit, Y. (2021). Tariffs as electoral weapons: The political geography of the US-China trade war. International Organization, 75(1), 1–38.
-
Krugman, P. (1991). Increasing returns and economic geography. Journal of Political Economy, 99(3), 483–499.
-
Lee, J. (2017). China’s nonmarket economy treatment and US trade remedy actions. Journal of World Trade, 51(3), 495–516.
-
Lee, J. (2023). Foreign direct investment in political influence. International Studies Quarterly, 67(1), sqad005.
-
Lee, J. (2024). How foreign multinationals benefit from acquiring domestic firms with political experience. The Review of International Organizations, 1–26. https://doi.org/10.1007/s11558-024-09547-2
-
Lee, J., & Osgood, I. (2021). Firms fight back: Production networks and corporate opposition to the China trade war. Geopolitics, Supply Chains, and International Relations in East Asia, 153.
-
Lee, J., & Osgood, I. (2022). Protection forestall: Offshore firms against tariffs in their own industry. Business and Politics, 24(4), 377–398.
-
Leeds, B., Ritter, J., Mitchell, S., & Long, A. (2002). Alliance treaty obligations and provisions, 1815–1944. International Interactions, 28(3), 237–260.
-
Li, J., Shapiro, D., Peng, M. W., & Ufimtseva, A. (2022). Corporate diplomacy in the age of US-China rivalry. Academy of Management Perspectives, 36(4), 1007–1032.
-
Liu, R., Zhang, J. J., & Vortherms, S. A. (2022). In the middle: American multinationals in China and trade war politics. Business and Politics, 24(4), 348–376.
-
Lopatin, N., Mendoza, B., & Westenberg, J. M. (2024). Section 301 and politics: Analysis of tariff exclusions. Economics & Politics, 36(1), 483–516.
-
Maher, R. (2018). Bipolarity and the future of US-China relations. Political Science Quarterly, 133(3), 497–525.
-
Mansfield, E. D. (1995). Power, Trade, and War. Princeton University Press.
-
Morrow, J. D., Siverson, R. M., & Tabares, T. E. (1998). The political determinants of international trade: The major powers, 1907–1990. American Political Science Review, 92(3), 649–661.
-
Mosley, L., & Uno, S. (2007). Racing to the bottom or climbing to the top? Economic globalization and collective labor rights. Comparative Political Studies, 40(8), 923–948.
-
Newhouse, J. (2009). Diplomacy, Inc.: The influence of lobbies on US foreign policy. Foreign Affairs, 88, 73–92.
-
Osgood, I. (2018). Globalizing the supply chain: Firm and industrial support for US trade agreements. International Organization, 72(2), 455–484.
-
Osgood, I., Tingley, D., Bernauer, T., Kim, I. S., Milner, H. V., & Spilker, G. (2017). The charmed life of superstar exporters: Survey evidence on firms and trade policy. The Journal of Politics, 79(1), 133–152.
-
Peng, M. W., Ahlstrom, D., Carraher, S. M., & Shi, W. S. (2017). History and the debate over intellectual property. Management and Organization Review, 13(1), 15–38.
-
Pond, A., & Zafeiridou, C. (2020). The political importance of financial performance. American Journal of Political Science, 64(1), 152–168.
-
Smith, D. F., Jr., & Florida, R. (1994). Agglomeration and industrial location: An econometric analysis of Japanese-affiliated manufacturing establishments in automotive-related industries. Journal of Urban Economics, 36(1), 23–41.
-
Steinberg, D. A., & Tan, Y. (2023). Public responses to foreign protectionism: Evidence from the US-China trade war. The Review of International Organizations, 18(1), 145–167.
-
Thrall, C. (2025). Spillover effects in international law: Evidence from tax planning. International Studies Quarterly, 69(1), sqaf006.
-
Vernon, R. (1971). Sovereignty at Bay: The Multinational Spread of U.S. Enterprises. Basic Books, New York.
-
Wang, Z., & Zeng, J. (2020). From economic cooperation to strategic competition: Understanding the US-China trade disputes through the transformed relations. Journal of Chinese Political Science, 25, 49–69.
-
Wei, L. (2019). Towards economic decoupling? Mapping Chinese discourse on the China-US trade war. The Chinese Journal of International Politics, 12(4), 519–556.
-
Wellhausen, R.L. (2014). The Shield of Nationality: When Governments Break Contracts with Foreign Firms. Cambridge University Press.
-
Yildirim, A. B., Chatagnier, J. T., Poletti, A., & De Bièvre, D. (2018). The internationalization of production and the politics of compliance in WTO disputes. The Review of International Organizations, 13, 49–75.
-
Zaheer, S. (1995). Overcoming the liability of foreignness. Academy of Management Journal, 38(2), 341–363.
-
Zeng, K. (2021). “Exit’’ vs. “voice’’: Global sourcing, multinational production, and the China trade lobby. Business and Politics, 23(2), 282–308.
-
Zeng, K., Sebold, K., & Yue, L. (2020). Global value chains and corporate lobbying for trade liberalization. The Review of International Organizations, 15(2), 409–443.
-
Zeng, K., & Li, X. (2021). Fragmenting Globalization: The Politics of Preferential Trade Liberalization in China and the United States. University of Michigan Press.
-
Zeng, K., Xu, Y., & Xie, Z. (2023). Local sourcing embeddedness, manufacturing relocation, and firm attitudes toward the US-China trade war: A survey analysis of China-based MNC subsidiaries. Business and Politics, 25(2), 91–116.
-
Zhao, M. (2019). Is a new cold war inevitable? Chinese perspectives on US-China strategic competition. The Chinese Journal of International Politics, 12(3), 371–394.
Funding
The authors received no financial support or funding from any organization for the work presented in this manuscript.
Ethics declarations
Conflicts of Interest
The authors have no conflicts of interest to declare.
Additional information
Responsible editor: Axel Dreher
Rights and permissions
Open Access This article is licensed under a Creative Commons Attribution 4.0 International License, which permits use, sharing, adaptation, distribution and reproduction in any medium or format, as long as you give appropriate credit to the original author(s) and the source, provide a link to the Creative Commons licence, and indicate if changes were made. The images or other third party material in this article are included in the article’s Creative Commons licence, unless indicated otherwise in a credit line to the material. If material is not included in the article’s Creative Commons licence and your intended use is not permitted by statutory regulation or exceeds the permitted use, you will need to obtain permission directly from the copyright holder. To view a copy of this licence, visit http://creativecommons.org/licenses/by/4.0/.
Reprints and permissions
About this article
Cite this article
Eldes, A., Lee, J. & Osgood, I. Allied import options available? Finding friendly trade partners amidst decoupling from China. Rev Int Organ (2025). https://doi.org/10.1007/s11558-025-09596-1
- Accepted
- Published
- DOI https://doi.org/10.1007/s11558-025-09596-1