Article Content
1 Introduction
Photonic crystals possess special optical capabilities due to their periodic arrangement of components on the scale of light wavelength (Painter et al. 1999; Joannopoulos et al. 2008). These structures affect the motion of photons, similar to how the periodic potential controls the electrons’ transport. Consequently, photonic crystals are able to manipulate light propagation in a variety of ways, including the creation of photonic bandgap (PBG), which prevent specific light wavelengths from passing through the substance resulting in total reflection (Gong and Hu 2013a). Large PBG of PCs is considered as a crucial aspect for many applications including optical fibers, advanced optical sensors and photonic circuits (Susa 2002; Gong and Hu 2013b). Optimal PC design and fabrication are more challenging due to the variety of periodic layouts, as well as the material and sizes of the photonic crystal layers.
Square and circular two dimensional photonic crystals refer to the geometric arrangements of the unit cells or lattice structures in these photonic materials. These structures influence how light propagates through the crystal, affecting properties like photonic band gaps and light localization. The distinction between square and circular geometries lies in the symmetry and periodicity of the lattice. Both circular and square photonic crystals are widely used in optical devices like waveguides, filters, omnidirectional reflectors, lasers, photonic crystal fibers and resonant cavities, where the directional control of light is critical (Roundy and Joannopoulos 2003; Bouk et al. 2004; Chang et al. 2011; Zhang et al. 2016; Parandin et al. 2021, 2022). Defect modes arise when metallic circular rods are embedded into square arrays and when one or more rods’ radii are changed in two-dimensional PCs (El-Naggar 2012; Aly et al. 2014), while the defect modes of PCs made of circular rods in square arrays of epsilon-near-zero metamaterials are investigated in Lee and Kee (2020). In (Sayed et al. 2023), 1D defective PC that is composed of two layers designed from porous silicon infiltrated by poly-vinyl alcohol polymer doped with crystal violet and carbol fuchsine dyes with different porosity, is considered for the detection of gamma-ray radiation, where a single layer of doped-polymer is included to stimulate the localization of a distinct resonant wavelength. In (Almawgani et al. 2023a), a theoretical NaCl sensor based on the excitation of Tamm plasmon resonance through a 1D PC structure is investigated, where the proposed design is [prism/gold/water cavity/silicon/calcium fluoride/glass substrate]. In (Almawgani et al. 2023b), the reflectance spectrum of the metamaterial 1D-PCs based on the effective medium theory and the transfer matrix is presented, where the structure includes InAs/Ag-hyperbolic and Ag-gyroidal metamaterials. The absorption spectral properties this PC near IR wavelengths is examined in Medhat et al. (2024), showing spectral absorption bands ranging from 0.7 µm to 3 µm for both TM and TE polarizations. In (Almawgani et al. 2024), Infrared 1D PC reflector is based on the gyroidal geometry with a configuration of [Air/(silver/ titanium dioxide and silicon)10/substrate] is presented, showing cutoff at λ = 1μm, where the filling fraction provides the tunability of the cutoff frequency and the reflectivity of the structure. Also, in Mehaney et al. (2024), 1D gyroidal (Bi2Sr2CaCu2O8 and SrTiO3) superconductor PC is presented for THz applications, where transfer matrix approach and the two-fluid model are used in the computational analysis showing a cutoff frequency at 5.35 THz.
Despite the significant technological advancements and high precision in the fabrication of 2D photonic crystals, there are still imperfections due to the complexity of the processes of fabrication. Parameters like lattice constant, refractive index, and photonic crystal dimensions may vary due to fabrication imperfections. These imperfections might arise at different phases of the manufacturing process and significantly impact the photonic crystal’s functionality. The performance and characteristics of the PC might be negatively impacted by a variety of defects (Prather et al. 2009; Segura et al. 2017; Biswas et al. 2022). The geometrical defects result from the irregular spacing between holes or rods that alters the lattice periodicity, or from the surface roughness on the PC structures. These geometrical imperfections could lead to changes in dispersion properties that impact light propagation, a decrease in the photonic bandgap (PBG), or scattering losses that reduce the light confinement. Regarding the material imperfections arising from nonuniform refractive index across the crystal, attributed to impurities or fabrication inconsistencies, as well as deformation or cracking, can result in shifting of the photonic bandgap or an increase in absorption losses. Also, mode mismatch or coupling inefficiencies are caused by misalignment during layer deposition or by errors in alignment between photonic crystal structures and external waveguides or devices. Furthermore, limitations in the fabrication process may arise from inaccurate etching during lithography or chemical processes, could lower the quality factor or cause propagation losses. Additionally, post-fabrication deformation resulted from the mechanical stress or thermal expansion may impair filtering efficiency and wavelength selectivity, leading to a long-term degradation in PC performance.
Stochastic analysis uses probabilistic distributions to model and predict these variations and assess their impact on the photonic crystal’s behavior especially when dealing with the imperfections, randomness, and variability in material properties. Monte Carlo Techniques are commonly used in stochastic analysis to simulate the random analysis of the photonic crystals’ characteristics (Graham and Talay 2013; Vidal-Codina et al. 2019). By running numerous simulations with varied input design parameters, researchers can statistically analyze the outcomes to understand how randomness affects the PCs characteristics. Unlike deterministic models, stochastic approaches account for the uncertainties inherent in the fabrication process, material characteristics, and environmental conditions, providing a more comprehensive understanding of the photonic crystal’s performance. A multiscale continuous Galerkin approach is applied in Vidal-Codina et al. 2019 to provide a truly stochastic and highly accurate simulation of the propagation of time-harmonic waves via PCs. In (Zhang and Liu 2016), the properties of photonic band gaps in 2D plasma dielectric PCs have been examined using the modified plane wave expansion approach. In (Liu and Oliver 2003), the impacts of randomization on the optical features of disordered 2D PCs for TM polarized radiation have been studied using Monte Carlo approach.
In our previous work (Wafa et al. 2020; El-Batawy and Wafa 2021b), the stochastic performance characteristics of numerous photonic devices have been modeled using Monte Carlo simulations. In (Wafa et al. 2020), we have addressed the defect-free 1D PCs and 1D PCs with a defect air layer. In (Wafa et al. 2021), we have considered 2D PCs consisting of dielectric materials namely Si rods(air holes) embedded in air(Silicon) background. We examined the effects of tolerance variations of the radii of the rods and the permittivity of the material of the 2D PCs on their performance. Our study in Wafa et al. (2021), was limited to dielectric materials and rods with circular cross-sectional area only.
In this work, we are extending our investigation on stochastic modeling of 2D PCs to consider rods made of metallic material. Therefore, we address two structures of 2D-Metallic PCs; the first structure has air holes in the metallic background, whereas the second one consists of metallic rods in air background. In addition, we discuss two shapes of the rod’s cross-section area namely; circular and squared rods. Moreover, the impacts of the rotation of the squared-rod in square lattice are also investigated. We discuss the effect of uncertainty of many design parameters on the PBG of the proposed structure. Specifically, the uncertainties in the radii of the circular rods, side length of the squared rods and the angle of rotation for the squared rods have been demonstrated and discussed.
The presented paper is organized as follows. In Sect. 2, the suggested stochastic modeling is presented and explored along with a full description of the proposed 2D PCs. In Sect. 3, the numerical outcomes of the stochastic modeling of the tolerances for 2D Metallic PCs are presented and discussed. Finally, the conclusions are summed up in Sect. 4.
2 2D-PC and stochastic modeling
In this work, we consider electromagnetic waves propagation in two types of metallic PCs. The first type consists of circular air rods that are arranged in metallic background and the second type composed of circular metallic rods in an air background as illustrated in Fig. 1a, c, respectively. We also examine rods with square cross-sectional area for the two types of PCs. Figure 1b, d shows square air/metallic rods that are arranged in metallic/air background. We have assumed that the rods are arranged in square lattices, and they are placed along the z-direction. The length of the rods is much greater than L or r, where L is the side length of the rod with square cross section and r is the radius of the circular shaped rod. The rods are set in square lattice background with an ‘a’ lattice constant. The first Brillouin zone of the square lattice is shown in Fig. 1e. We have considered that the dielectric constant of the metal is frequency dependent and is equal to , according to the Drude model, where ωp is the plasma frequency (El-Naggar 2012). In this work, we focus our attention on the transverse-electric (TE) field, which is defined as, where r and ω are the position vector in x–y plane and the frequency, respectively. Due to the periodicity in x–y plane, the electric field along the z-axis Ez can be expanded in a Fourier series. This expansion can be expressed as an eigenvalue problem as follows,
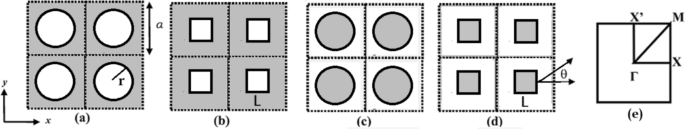
a, b 2D PCs air rods (circular and square cross-sectional areas) embedded in a metallic background. c, d 2D PCs metallic rods (circular and square cross-sectional areas) embedded in air background, and e First Brillouin zone
where G = (Gx, Gy) is a two-dimensional reciprocal vector. We have solved Eq. (1) numerically by substituting for the square lattice where the upper limit of the integers n1 and n2 is set to 10. This assures sufficient convergence by using the total number of 441 plane waves (El-Naggar 2012). It is important to note that when the square rods are rotated by an angle of θ, θ is measured with respect to the x-axis as shown in Fig. 1d, we replace G by using the using the following rotation matrix (El-Naggar 2012):
Furthermore, because rotating the square rods in the square lattice diminishes the symmetries of the PCs, we include the points Γ, X, M, and X’ in the Brillouin zone depicted in Fig. 1e in the computations. We use a normalized plasma frequency of ωpa/2π c = 1 in the numerical simulations. Our focus has been on the normalized bandgap-width (Δω/ωg), where ωg is the frequency in the middle of the photonic band gap that appears between the first and second bands and Δω is the frequency width of this gap.
In the stochastic model that is being presented, the deterministic simulation code is used by the Monte Carlo technique as a black-box to relate inputs that represent the metallic PCs’ design characteristics and associated outputs that represent the operational performance. With this method, the response vector is obtained by evaluating the deterministic model for a large number of samples (M). According to the law of large numbers, the mean and standard deviation of these samples, represented by and , respectively, are as follows:
Notably, a larger sample size results in a smaller standard deviation σ and an improved probability distribution function (PDF) accuracy for the output response.
3 Stochastic modeling results
We have investigated two structures of 2D metallic photonic crystals in the presented simulations. The first structure is denoted as Air-Holes PCs as it consists of air holes in a metallic background, while the second structure is denoted as Metallic-Rods PCs as it consists of metallic rods inserted in an air background. For both types, we have studied rods with circular and square cross-sectional areas. We give each structure a name as listed in Table 1 to easily distinguish and refer to different considered structures. The filling factor FF for circular rods is πr2/a2 and it is L2/a2 for rods with square cross-sectional area. In our previous work (El-Naggar 2012), we addressed maximizing the normalized photonic bandgap (Δω∕ωg) for 2D metallic PCs. In this work, we start by using the parameters previously obtained in El-Naggar (2012), listed in Table 1, where the normalized photonic bandgap (Δω∕ωg) for each structure is maximized. Then, we apply our stochastic study and discuss how Δω∕ωg is affected.
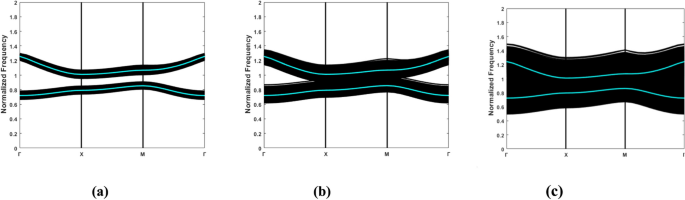
In Fig. 2, we plot the photonic band structure for the four PCs structures using the parameters listed in Table 1. Figure 2a shows the photonic band gap of Circular Air Holes PCs structure where it ranges from 0.79 to 0.9913 in units of 2πc/a, resulting in Δω∕ωg = 22.35%. While in Fig. 2b the PBG of Circular Metallic-Rods PCs ranges from 0.8531 to 1.01 in units of 2πc/a, resulting in Δω∕ωg = 16.73%. For Square Air-Holes PCs of side length ‘L’, we plot the photonic band structure at filling factor ‘FF’ = 0.379 which gives Δω∕ωg = 21.47% as shown in Fig. 2c. For Square Metallic-Rods in air background PCs, the maximum normalized photonic bandgap Δω∕ωg is 18.13% for FF = 0.5 and θ = 45° as shown in Fig. 2d.
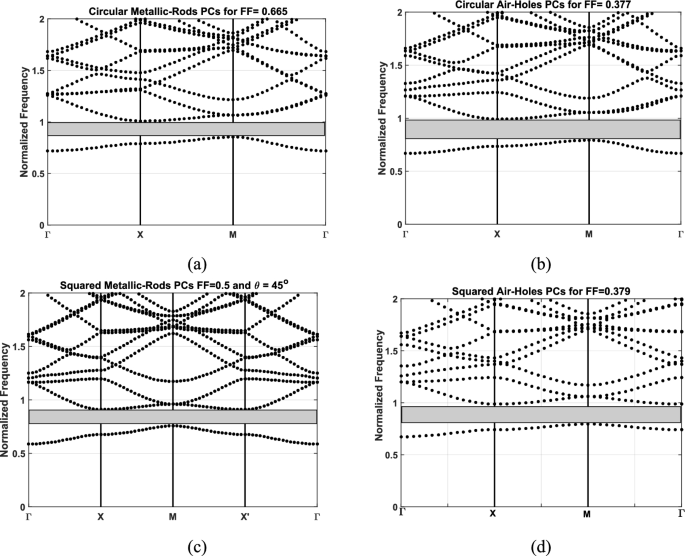
Photonic band structure for a Circular Air-Holes PCs with FF = 0.377, b Circular Metallic-Rods PCs with FF = 0.665, c Square Air-Holes PCs with FF = 0.379, and d Square Metallic-Rods PCs with FF = 0.5 and θ = 45°
In the following sections we are going to refer to the photonic bands of these 2D-PCs presented in Fig. 2, as the “deterministic case” where there are no tolerances in the design parameters of the proposed photonic crystals. The uncertainties in the design parameters of the metallic PCs are introduced and their impact on the normalized photonic band gap Δω∕ωg for each structure is analyzed in the following sections. We start by addressing the uncertainty in r for the circular rods PCs in Sects. 3.1 and 3.2. Then, we discuss the uncertainty in both L and θ in PCs structures composed of rods with square cross-sectional area in Sect. 3.3.
3.1 Circular air-holes PCs
In this section, we consider uncertainties in r the radius of the Circular Air-Holes PCs structure shown in Fig. 1a. The deterministic photonic band structure for this structure is shown in Fig. 2a. In order to account for uncertainties in r, we have applied the Monte Carlo method with a sample set of 10,000 and we plot the photonic bandgap for tolerances in r of 2%, 4%, and 10%, as shown in Fig. 3.
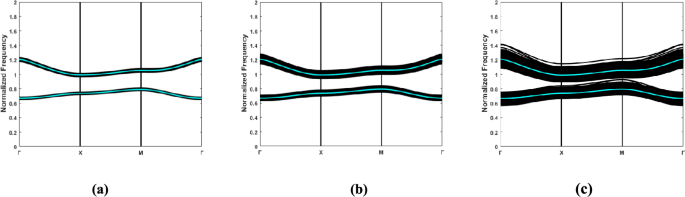
The normalized frequency bands for uncertainties in r of a 2%, b 4% and c 10%. The mean values of the frequencies of first and second bands are in plotted cyan color
The photonic bandgap upper and lower bounds and its width have a significant degree of tolerance, as shown clearly in this figure. Moreover, as the tolerance in r rises, so does the uncertainty of the photonic bandgap width. Confident photonic bandgap is the demonstrated difference between the first and second frequency bands under all given PC stochastic parameter uncertainties (Wafa et al. 2020, 2021; El-Batawy and Wafa 2021a, 2021b). In Table 2, the confident PBG is simulated for different r tolerances, and it is demonstrated that a large drop in the confident photonic bandgap width occurs when these tolerances are increased. Furthermore, the confident bandgap may totally vanish as the uncertainties in r go further, as we notice in case of 10% tolerance, where the PC may lose its primary functionality. In Fig. 4a, we plot the mean values of the frequencies of the first and the second bands where the first PBG lies. The figure shows that these uncertainties have negligible impact on the means. However, Fig. 4b shows how the standard deviations computed for the frequencies of these bands increase as the tolerance in r increases which gives explanation for the disappearance of the confident gap at high uncertainty in r despite that the mean frequencies is unaffected.
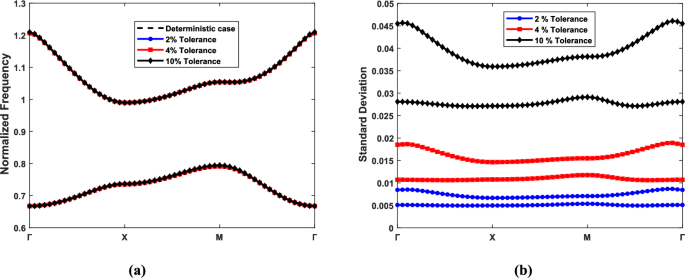
a Mean bands frequencies vs the reduced wave vector and b Standard Deviations in frequencies of the bands of PBG, for uncertainties of 2%, 4%, and 10% in r
The normalized band gap’s probability distribution function (PDF) is shown in Fig. 5a for various tolerances of r, while the normalized first and second bands’ PDF is shown in Fig. 5b for the same tolerances. These graphs show that as the uncertainties in r increase from 2 to 10%, the PDF of the normalized bandgap extends over a broader range, but the mean of the normalized frequency gap changes very little. The large range broadening of the PDF is a result of the high level of uncertainty surrounding the bandgap width and its lower and upper margins, in addition to the increase of the standard deviation. Table 3 displays the standard deviations σ for the PBGs for different r and a uncertainties. It is clear from this table that as the uncertainties rise from 2 to 10%, σ rises by a factor greater than six. Furthermore, as the uncertainties of r of the given circular Air-Holes Metallic PCs increase, so does the ratio (σ/Mean), whereas the normalized band gap mean is nearly constant.
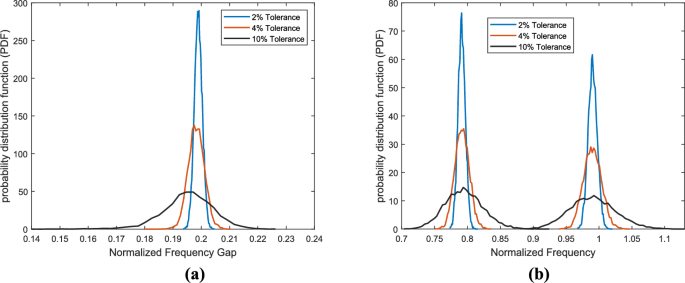
PDF of a Bandgap width b Normalized frequency bands of Bandgap, for different tolerances of r
3.2 Circular metallic-rods PCs
In this section, we consider uncertainties in r the radius of the Circular Metallic-Rods PCs structure shown in Fig. 1c. The deterministic photonic band structure for this structure is shown in Fig. 2b. In Fig. 6, we plot the normalized frequency and normalized frequency mean for different r tolerances of 2%, 4%, and 10%. We observe that for this structure, at a tolerance in r as low as 2%, the confident gap has disappeared due to high standard deviations. We note that the effect of uncertainties in r on the means of the frequencies of the first and second bands is negligible which matches the results presented in Sect. 3.1 for Circular Air-Holes PCs structure.
The normalized frequency bands for uncertainties in r of a 2%, b 4% and c 10%. The mean values of the frequencies of first and second bands are in plotted cyan color
In Table 4, PBG standard deviations for various r’s tolerances are listed. Comparing these results with Table 3 reveals that impact of the tolerances in r on the standard deviations in Circular Metallic-Rods PCs structure is almost 3 times higher than the corresponding values for Circular Air-Holes PCs structure. The impacts of these tolerances for this structure on the PDF of the bandgap have been examined as shown in Fig. 7a, b, where the bandgap PDF and PDFs of normalized frequency bands of PBG are plotted, respectively.
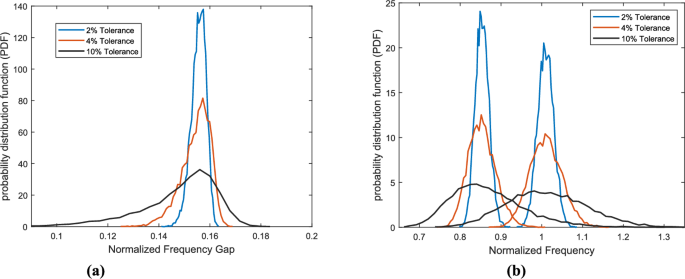
PDF of a Bandgap width b Normalized frequency bands of Bandgap, for different tolerances of r
Comparing to the presented results of stochastic analysis Metallic 2D PC to our previous work on stochastic analysis of Si 2D PC in Wafa et al. (2021), PBG of 2D PCs structures composed of Si-Rods in air background is less sensitive to uncertainty in radius of the rods in comparison with that of 2D PCs structures composed of Air-Holes in Silicon background. On the other hand, due to the metal frequency dependent permittivity, that impact of the uncertainties in r Circular Metallic-Rods PCs structure is higher than the corresponding values for Circular Air-Holes PCs structure.
3.3 Square air-holes PCs / square metallic-rods PCs
In this section, we discuss the uncertainty in both the side length L and the angle of rotation θ in PCs structures composed of rods with square cross-sectional area. First, we start by addressing the uncertainty in the side length L of the Square Air-Holes PCs structure shown in Fig. 1b. We plot the PDFs of the bandgap and the PDFs of the frequency bands of the bandgap in Fig. 8a, b, respectively. In Fig. 8, calculations are performed for uncertainties of 2%, 4% and 10% in L. Comparing these PDFs with those of the Circular Air Holes PCs in Fig. 5, the PDFs for Square Air-Holes PCs are slightly lower and have more broadening. PBGs standard deviations for various uncertainties of this side length of the rod ranging from 2 to 10% are shown in Table 5. Comparing the impacts of the tolerances in the dimension of the Air-Hole rods for both the circular and square Air-Holes PCs (in Table 3 and Table 5, respectively), the standard deviation of the photonic bandgap in case of Square Air-Holes PCs is slightly larger for the same dimension tolerance.
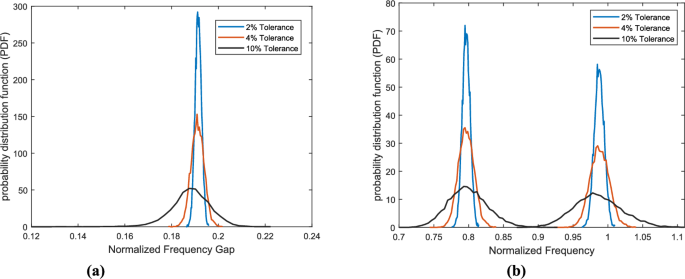
a Bandgap PDF b PDF of normalized frequency bands, for various uncertainties of side length of the Square Air-Holes Rods
Next, we address the uncertainty in the side length L of the Square Metallic-Rods PCs structure shown in Fig. 1d. We calculated the confident gap width for 2%, 4%, and 10% uncertainty in the side length of the square metallic rods ‘L’, where numerical values are listed in Table 6. As shown in this table, increasing these tolerances results in a significant decrease in the confident photonic bandgap width. We observe that at uncertainty in L greater than or equal to 4%, the confident bandgap completely disappears. We note that the normalized confident PBG Δω ∕ωg decreases from 18.13% ‘deterministic case’ to 5.21% for a tolerance of 2% in L while no confident gap is guaranteed for any further increase in this tolerance because the standard deviation is very high in this case. Table 7 displays the standard deviations σ for the PBGs for different L uncertainties. It is clear from this table that as the uncertainties rise from 2 to 10%, the standard deviation increases by more than five times. Furthermore, as the uncertainties in L increase, so does the ratio (σ/Mean) between the standard deviation. Comparing Tables 4 and 7, the effects of the uncertainties of the dimensions of the metallic rod 2D PCs will be more effective in square shaped rod structure more than in case of circular shaped metallic rod structure, as the ratio (σ/Mean) increase more than double for all tolerances values.
Finally, we study the impacts of the tolerances in the angle of rotation θ for both Square Air-Holes PCs and Square Metallic-Rods PCs structures. The angle of rotation is measured from the x– axis as shown in Fig. 1. We consider tolerances of 1°, 2°, and 5° in the angle θ which may result from any fabrication issues. Numerical results of the standard deviation ‘σ’ the photonic bandgap due to the tolerances and the associated ratio of σ to the mean of PBG are listed in Table 8. As shown in this table, the impact of the tolerances in the angle of rotation is minimal in both structures and can be negligible if compared with the effects of the uncertainties of other PC’s dimensions. In addition, the impact of the tolerances of the angle of rotation on the PBG is much smaller for the case of Square Air-Holes PCs compared to the case of Square Metallic-Rods PCs.
4 Conclusions
This research develops a complete stochastic analysis for metallic 2D-PC based on the Monte Carlo technique and plane wave expansion. We have investigated the effects of stochastic parameter tolerances on the optical operating characteristics of 2D-PCs. This study is highly useful in PC development since it considers the possible fabrication tolerances and how they can impact PC functioning. The impact of stochastic design parameter tolerances on the photonic bandgap of two-dimensional metallic photonic crystals (2D-PCs) for both square- and circular-shaped rod configurations has been extensively investigated. Both (Metallic Rods/Air background) PCs and (Air-Holes/Metallic background) PCs have been examined in this study. The numerical calculations show that the photonic gap of the (Air-Holes/Metallic background) PCs structure is less impacted by the rod dimension uncertainties than that of the (Metallic Rods/Air background) PCs structure. Furthermore, the presented analysis revealed that the effects of the tolerances in the angle of rotation of the square rods up to 5° are minimal and almost negligible for both structures.