Article Content
Abstract
This paper applies growth accounting methodology to analyse the evolution of labour productivity and total factor productivity (TFP) in Spain and a set of selected countries from the perspective of the growth potential that digitalisation offers. The role of information and communication technologies (ICTs) is viewed from two complementary perspectives. The first considers the role played by ICT assets, as well as R&D and other intangible assets not included in national accounts. The second examines the sectoral composition of production distinguishing between digital producing industries (DP), the most digital intensive using industries (MDIU) and the least digital intensive using industries (LDIU). We find that the notable delay in productivity in Spain compared to other countries is mainly due to: (1) low levels of investment in both ICT and intangible assets, which translates into lower productivity in almost all sectors; and (2) its productive specialisation biased towards the most traditional sectors classified as LDIU. The paper concludes by looking at the future of Spanish productivity in examining the potential role that AI could play in strengthening productivity growth.
Explore related subjects
Discover the latest articles and news from researchers in related subjects, suggested using machine learning.
- Analysis
- Economic Growth
- Knowledge and Innovation
- Technological Infrastructures
- Technological Innovation
- Economic Development, Innovation and Growth
1 Introduction
Most economies, especially the more developed ones, are experiencing a sustained slowdown in productivity. In many cases, the slowdown began around the year 2005. Surprisingly, the slowdown continues today, despite the development of artificial intelligence (AI), the Internet of Things (IoT), cloud computing and other equally disruptive technologies. The combination of a widespread and sustained productivity slowdown and high-potential technologies and innovations is known as the productivity paradox. Today’s paradox shares many features with the productivity paradox of the 1980 s, when Nobel prize winner Robert Solow famously stated:”you can see the computer age everywhere but in the productivity statistics”(Solow 1987).
From the early 1990 s to 2005, labour productivity, measured both by employment and by hours worked, grew rapidly in the more developed economies. This strong performance reflected that the productivity statistics finally seemed to confirm the growth potential offered by information and communication technologies (ICT). However, the impact of ICTs was short-lived and cannot be observed in data after the post-2007 financial crisis.
This paper analyses the evolution of labour productivity and total factor productivity (TFP) in Spain and a set of selected countries from the perspective of the growth potential that digitalisation offers. It applies the growth accounting methodology as developed by Jorgenson and co-authors (Jorgenson et al. 1987; Jorgenson et al. 2005; Jorgenson and Schreyer 2013).
The role of ICTs is viewed from two complementary perspectives. The first considers the role of ICT as assets, with the same recognised properties as any other capital asset, such as buildings,Footnote1 transportation equipment or non-ICT equipment. In turn, ICT assets include three different types of assets, two tangible—hardware and communications—and a third—software—intangible. The second perspective acknowledges the importance of the sectoral composition of production in analysing the determinants of growth and productivity. In this sense, the relevance of digitalisation depends on the path of penetration of ICT in the productive process and therefore distinguishes between digital producing industries (DP), the most digital intensive using industries (MDIU) and the least digital intensive using industries (LDIU) or traditional sectors following Van Ark et al. (2019).
The analysis is carried out from a comparative international perspective, in which countries have been selected by applying the double criteria of the availability of statistical information and its relevance as references for Spain. The selection includes six European Union (EU) countries. The four largest countries are: Germany, France, Italy and Spain. Additionally, there are two Nordic countries that stand out for their high degree of ICT penetration: Sweden and Finland. Finally, the list includes two international reference economies: the UK and the USA. The Netherlands and Portugal are also included where available data allows. The period covered starts in 1995 and extends to the last available year, which depends on the variable considered.
The main source of statistical information is the EUKLEMS database.Footnote2 Other data sources used include the following: national accounts data from Eurostat (2023) and OECD (2024c), and TFP data provided by The Conference Board (2024) is used in the initial productivity analysis in Sect. 2; data from EUKLEMS (Bontadini et al. 2023) and Spanish data from BBVA Foundation-Ivie (2024) and Cotec Foundation-Ivie (2023) is used in Sect. 3, which focuses on investment in intangibles; Sect. 4, based on the digital intensity classification (Van Ark et al. 2019), also analyses data from the Twin Transition Dataset (JRC 2023), and, in addition to the aforementioned sources, data from Spain’s national accounts (INE 2024a; b) is used in the TFP estimation in this section; and finally, Sect. 6 focuses on the analysis of OECD data on the use of AI by businesses (2024d).
The work is structured in 5 sections. Section 2 presents the productivity paradox and its relative importance in different countries, highlighting the specific case of Spain. Of all the potential explanations, the work focuses on intangible assets, to which the literature gives a leading role. They are covered in Sect. 3. Section 4 addresses the importance of the production structure in shaping the pathways for ICT penetration and the intensity of digital penetration, grouping the 25 sectors for which information is available in the three categories indicated above. Section 5 combines the two previous perspectives, that of assets (Sect. 3) and the sectoral composition (Sect. 4), to analyses their importance in the productivity trajectory using the growth accounting methodology. Section 6 looks at the current productivity paradox and the future of Spanish productivity in examining the potential role that AI could play in strengthening productivity growth. Section 7 concludes with a summary of the topics covered.
We find that the notable delay in Spain’s productivity with respect to other countries is mainly due to two combined factors: (1) low levels of investment in both ICT and intangible assets, which translates into lower productivity in almost all sectors; and (2) its productive specialisation biased towards most traditional sectors (LDIU), with a relatively low presence of digital producing (DP) and the most digital intensive using industries (MDIU), which are the ones presenting the highest levels of productivity, specially the DP.
2 The slowdown in productivity: potential explanations
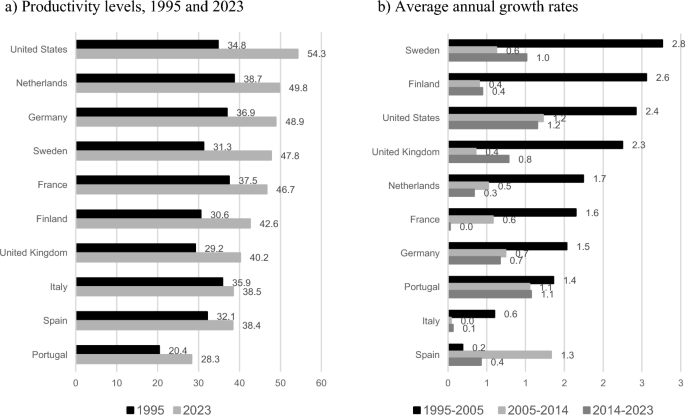
The productivity slowdown is a general problem in developed economies and affects both labour productivity and total factor productivity.Footnote3 Figure 1 illustrates two key phenomena for the analysis. Panel a provides the productivity levels per hour worked for 1995 and 2023, calculated using GDP and hours worked data from the annual national accounts of various countries, which we will refer to, for simplicity, as labour productivity, measured in PPS 2015, while panel b offers the annual rates of growth, distinguishing between three subperiods. The first period from 1995 to 2005 was one of strong growth and was followed by two periods of slowdown. The first was from 2005 to 2014, the year in which Spain began to recover from six years of deep crisis. The second from 2014 to 2023 is marked by the recovery that followed the 2007 crisis, which was interrupted by the COVID-19 pandemic.
Source: Eurostat (2023), OECD (2024c) and own elaboration
Productivity per hour worked. International comparison, 1995–2023 (Euros 2015 PPS per hour worked and % growth). Note 2022 for the UK and the USA. Countries are ranked in descending order.
Panel a shows, first of all, that there are significant differences in productivity levels between the countries. The USA is the leader, and Portugal, Spain and Italy have the lowest levels at the beginning and, more importantly, end of the period analysed. Panel b clearly shows the magnitude of the slowdown in labour productivity over the last two decades of the period 1995–2023. In all countries, with the sole exception of Spain, labour productivity growth was higher—and in some cases, as in Sweden and Finland, significantly higher—over the period 1995–2005. In the following two subperiods, productivity slowed down, very abruptly in some countries and more gradually in others, such as in the USA and Portugal.
Spain is the only country that deviates from this pattern, exhibiting an opposite trend. During the years of highest growth in labour productivity (1995–2005), Spain experienced weak growth, close to zero. On the contrary, in the following years of severe economic crisis, Spain’s productivity increased significantly, making it the only country with a major increase. In the last subperiod (2014–2023), productivity grew slightly, presenting growth rates similar to those of other countries, except for the most dynamic ones, i.e. the USA, Sweden and Portugal. Thus, Spain’s productivity behaviour was counter-cyclical in the first two subperiods, while it became pro-cyclical in the third.
Anti-cyclicality implies that Spain destroyed jobs during the Great Recession at a faster rate than its gross value added (GVA) contracted, thus increasing labour productivity. In the previous expansion from 1995 to 2005, during the housing boom, productivity was counter-cyclical because employment was created at a faster rate than GVA grew, and labour productivity decreased. Data from the last subperiod point to a pro-cyclical response similar to that of the other countries, but with very modest positive changes in productivity in the growth years and a one-off decline in growth in 2020, indicating that it is still too early to confirm a clear change in pattern.
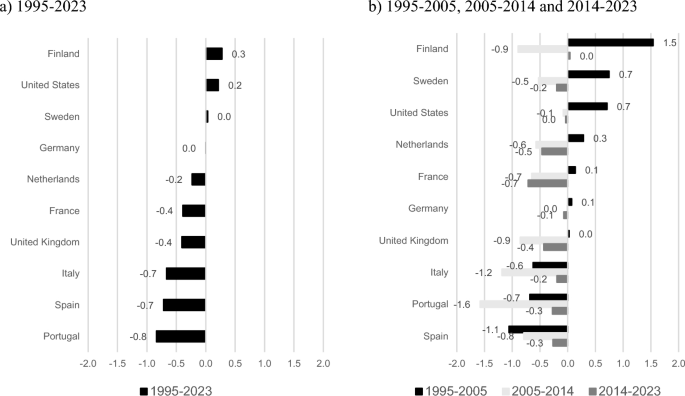
A more accurate measure of the evolution of productivity over time, despite certain problems, is TFP. It measures the part of GVA growth that is not explained by growth in the factors of production, labour and capital. According to Solow (1957), TFP is considered a measure of exogenous technical progress.Footnote4 Panel a in Fig. 2 shows the TFP annual rates of growth for the full period 1995–2023, while panel b displays the breakdown into the three subperiods. According to panel a, only Finland, the USA and Sweden showed positive growth in TFP over the full period. Once more, the three countries with the poorest results are Italy, Spain and Portugal. Panel b indicates that these three countries were also the only ones that experienced negative growth in the three subperiods, confirming that they are the ones facing the largest productivity challenges.
Source: The Conference Board (2024)
TFP growth rates. International comparison, 1995–2023 (percentage). Note Countries are ranked in descending order. In panel b, countries are ranked according to the period 1995–2005.
Possible explanations for the productivity paradox have gone in many directions. The initial concern was the possible existence of measurement problems reflecting a concern that the methodologies to measure output, and thus also productivity, are outdated and not ready for the digital revolution (Byrne et al. 2016; Syverson 2017).
The second argument rests on the time lags in the diffusion of technical progress, noting that, as in previous waves of strong technological change, it takes time for the benefits of innovation to be extended to the whole economy (Acemoglu et al. 2023; Andrews et al. 2016). Crafts (2010) recalls that it took a considerable amount of time before the steam engine had any impact on productivity.
Additional explanations are as follows: the first focuses on the role of trade and globalisation and argues that the observed slowdown in productivity reflects that all the benefits derived from the development of global value chains have already been achieved (Constantinescu et al. 2019). The second relies on microeconomic data (Bartelsman and Doms 2000; Syverson 2011) and focuses on business dynamics (Andrews et al. 2016). Probably the most promising sign for future growth is that the most productive firms are growing faster than the rest. The frontier is still moving out. The most challenging finding is that diffusion of best practices is not pulling the rest of industry along. The natural force of competition among firms should work to prevent the dispersion of productivity from widening continuously, but something appears to be blocking that progress (Baily and Montalbano 2016). Potential reasons for the widening of the productivity distribution among include the existence of obstacles to implement simple productivity policies that would improve efficiency without complex bureaucracy or heavy investment. These obstacles are mainly due to the lack of managerial and worker capabilities.
This explanation is directly linked with one of the most widely accepted arguments for explaining the productivity slowdown from a macroeconomic perspective: that the full potential of ICTs can only be realised if additional investments in intangible assets are made simultaneously (David 1990; Brynjolfsson 1993; Brynjolfsson and Hitt 2000; Pilat 2004; Brynjolfsson et al. 2021). The seminal contribution in this field is due to Corrado et al. (2005, 2009) and continues to have an important recognition for two reasons. First, they provided a conceptual framework that allowed the foundations of capital theory to be reconciled with a revision of the standards for the national accounts. Secondly, they identified four intermediate consumption items that should be treated in the same way as investment goods, extending the boundary of intangible assets already included in national accounts (software and databases, and research and development [R&D] and others linked to intellectual property), with four additional assets: branding, design, training of workers provided by the company and improvements in the operation of organisations. The interest of their contributions has been reinforced by the estimates contained in the database EUKLEMS & INTANProd (Bontadini et al. 2023). This database has been elaborated following the methodology developed by these authors and is currently available for 30 countries and the period 1995–2020. We will further discuss the importance of intangible assets in the following sections.
3 Intangible assets and productivity
Business economics dedicates an extensive literature to the study of intangibles from varied perspectives. However, the current interest in these assets stems from their importance in productivity growth. Although there are different classifications of intangible assets (Schreyer 2007), the most widely accepted classification is the one proposed by Corrado et al. (2005, 2009) that is found in Table 1. One of its main advantages is that it is based on the theory of capital and thus allows tangible and intangible assets to be treated equally. Therefore, both can be introduced naturally in standard productivity analyses that uses the conceptual framework of the production function and its extension, the growth accounting methodology, as discussed further in Sect. 4.
As highlighted by Haskel and Westlake (2018), an important feature of intangible investment is that better results are obtained when several assets, both intangible and tangible, are combined, especially those linked to ICTs. This feature reinforces the importance of investing in intangibles as digitalisation spreads across economies. The main reasons for this conclusion are the following. First, the way of producing associated with the use of ICTs requires, first of all, changes—often drastic—in the organisation of the company, for example, its organisational chart, the way people work, decision-making more horizontally; and greater emphasis on teamwork, multiculturalism and multidisciplinarity. Secondly, it requires increasing sophistication via the design of new products. Third, it entails creating a brand that distinguishes the products from simple commodities. It also requires building customer loyalty to expand the network size. Finally, it needs skilled and experienced workers on the job.
3.1 The evolution of investment in intangibles in Spain from an international perspective
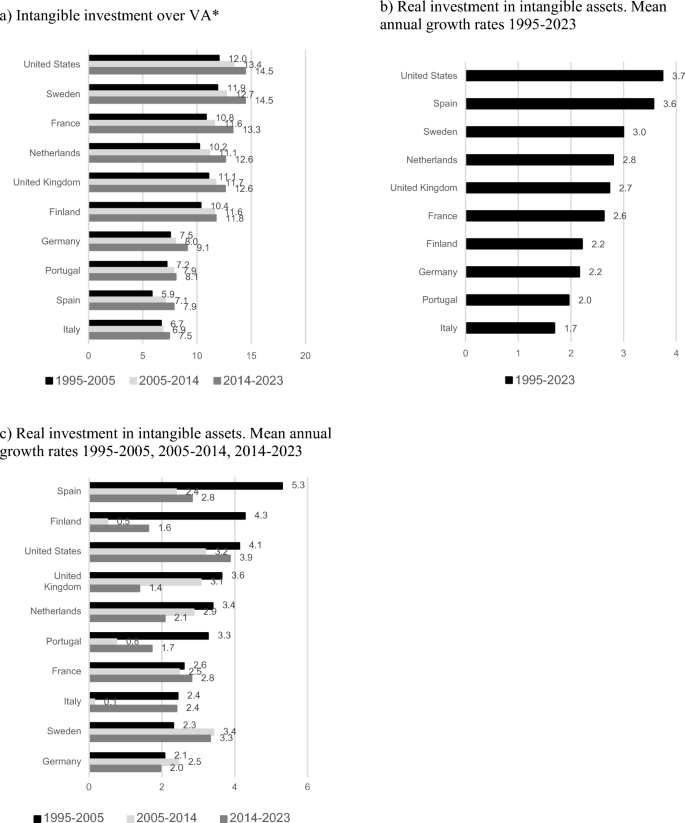
According to data on investment in intangibles, the Spanish economy has had lower investment in these assets in recent decades than reference countries. Figure 3 illustrates the positioning of Spain through two indicators. Panel a refers to average investment effort (investment/extended GVA),Footnote5 in which Spain occupies the last position in the three subperiods considered, together with Italy and Portugal. Panel b presents the rate of growth of investment in intangibles over the full period 1995–2023, with Spain in second position, behind the USA, and Portugal and Italy in the last ones. According to panel c, this strong position was mainly due to the strong growth in intangible investment in Spain in the first subperiod, 1995–2005, at a rate of 5.5%, the highest of all countries.
Source: Fundación Cotec-Ivie (2023), BBVA Foundation-Ivie (2024), Bontadini et al. (2023) and own elaboration
Investment in intangible assets over value added* and growth rates. International comparison, 1995–2023 (shares and growth rates in percentage). Note *Expanded. Countries are ranked in descending order.
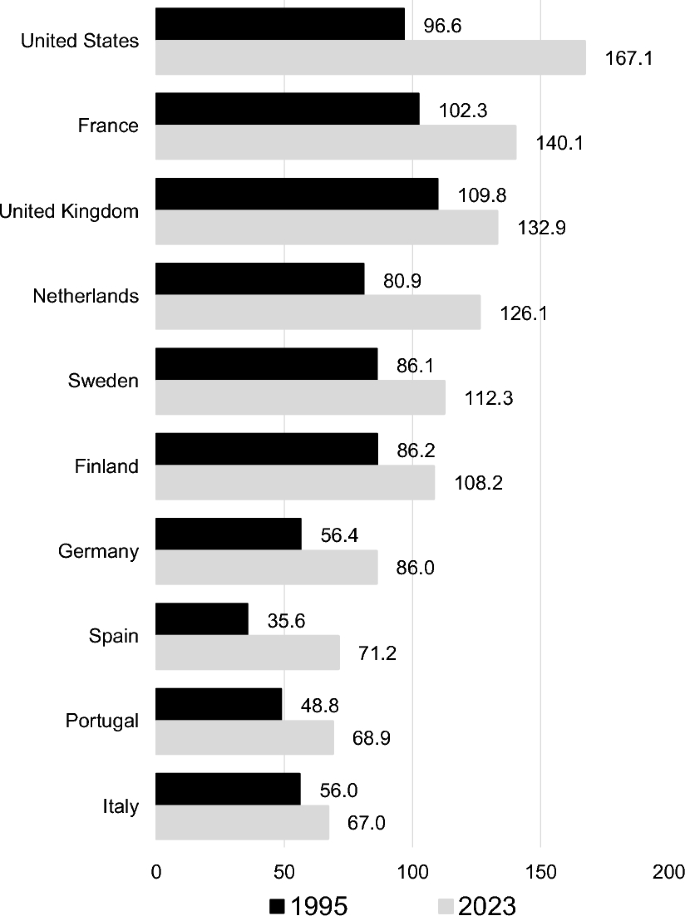
A less favourable picture is obtained when comparing the ratio of investment in intangibles over tangible assets. By 2023, investment in intangibles had already exceeded investment in tangibles in six out of ten countries (Fig. 4). While in the USA intangible investment was more than 50% higher than tangible, in Spain it was 70% less than tangible investment, just ahead of Portugal and Italy.Footnote6
Source: Fundación Cotec-Ivie (2023), BBVA Foundation-Ivie (2024), Bontadini et al. (2023) and own elaboration
Investment in intangible assets relative to tangible non-residential assets. International comparison, 1995 and 2023 (percentage). Note Countries are ranked in descending order according to 2023.
The immediate question is whether, between 1995 and 2023, differences between the ten countries considered have increased or decreased in three variables: per capita income, tangible non-residential investment and intangible investment. Figure 5 presents the results of the so-called β-convergence to examine whether the countries that started from a less favourable situation in GDP per capita and investment in the initial year, 1995, had grown more in the period analysed. If the response is positive, it is concluded that there is convergence, while if it is negative, there is divergence. According to Fig. 5, GDP per capita (panel a) has not experienced either convergence or divergence, while tangible investment (panel b) has shown a convergent profile. On the opposite side, intangible investment has followed a rather divergent profile along the period. That is, countries are becoming more different in terms of intangible investment, but more similar when it comes to tangible investment.
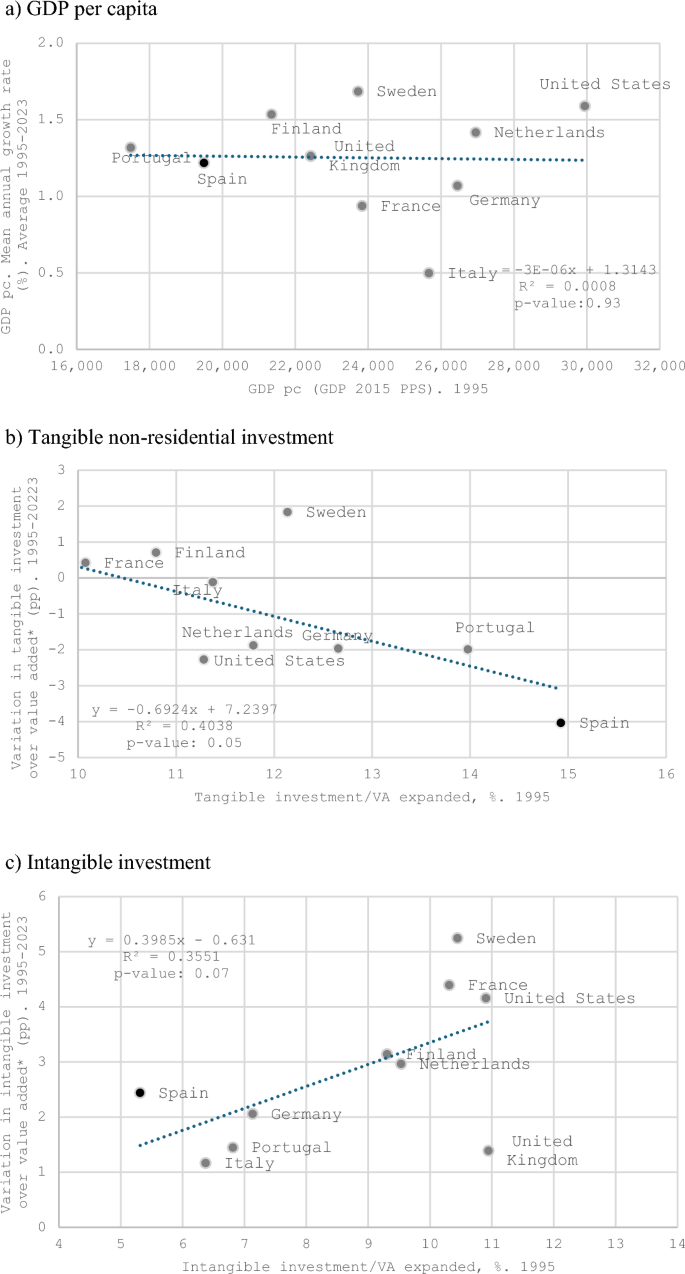
Source: Eurostat (2024), OECD (2024c), Fundación Cotec-Ivie (2023), BBVA Foundation-Ivie (2024), Bontadini et al. (2023) and own elaboration
β-convergence. GDP per capita, investment in tangible and intangible assets. International comparison, 1995–2023. Note *Expanded.
β-convergence or divergence is envisaged from a long-term perspective, that is, after a sufficiently long period of time. Thus, the divergence in investment in intangibles is a lasting trend, which is observed for a larger sample of countries than the one considered here, and also for smaller territories, such as the Spanish regions. Identifying this trend is relevant because it can identify barriers to the expected convergence of other economic outcomes, such as productivity or per capita income.
For its part, from a cyclical perspective it can be seen that, in the vast majority of countries, investment in intangibles is more resilient to expansions and recessions than per capita income or tangible investment. This result is shown for six countries in Fig. 6. In all of them, investment in tangibles fluctuates, as expected, more than per capita income. However, investment in intangibles shows a steady increase over the period 1995–2023. Exceptions are the slight setbacks during the financial crisis and pandemic. It should also be noted that, out of the six countries considered, Spain is the country where tangible investment is the most volatile, whereas intangible investment maintains a steady and more dynamic pace than in other countries.
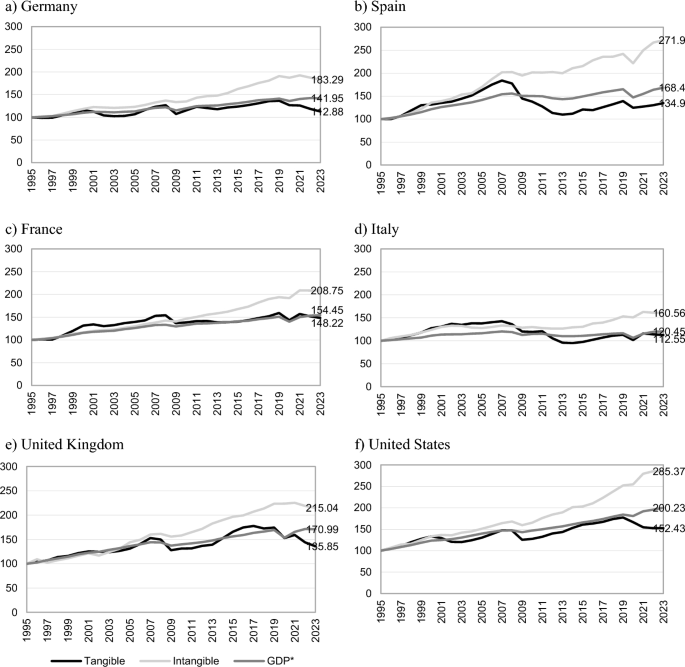
Source: Fundación Cotec-Ivie (2023), BBVA Foundation-Ivie (2024a), Bontadini et al. (2023) and own elaboration
Value added*, investment in tangible non-residential and intangible assets evolution. International comparison, 1995–2023 (1995 = 100). Note *Expanded.
4 Digitalisation and sectoral composition of production
The second way in which digitalisation affects aggregate productivity is through its penetration into economic sectors, where it is important to consider that it operates differently in some of them. In light of this, when analysing the importance of this second route, the 25 sectors for which information is available have been aggregated in three main groups according to the extent to which they have gone digital (Van Ark et al. 2019): (1) the digital producing industries (DP); (2) the most digital intensive using industries (MDIU); and (3) the least digital intensive using industries (LDIU).
Table 5 of Appendix shows the sectoral composition of each of the three aggregates. The DP sector includes a manufacturing sector—manufacturing of computer, electronic and optical products—and a service sector, information and communications. The other two remaining aggregates also combine manufacturing and service sectors, in addition to sectors with varying intensity in the use of human capital or intangible assets. (Distinctions between these two will not be explicitly considered.) Therefore, only the digital intensity taxonomy proposed by van Ark et al. (2019) will be considered.
Figure 7 shows the weight of each of the three aggregations in GVA (panel a) and employment (panel b) in 2020, with data from the Twin Transition Dataset database (JRC 2023). The first striking fact is the low weight of the digital producing sector. A second one is the greater weight of this sector in terms of GVA than employment in all countries. In Spain, the weight of the digital producing sector (DP) was 5.2% of GVA, the lowest of all the countries in the sample, and half of the share it had in three countries where it exceeded 10%: the USA (10.5%), Finland (10.8%) and Sweden (10.4%). Regarding employment, its share in total employment is about half of that of GVA, with Spain at 3.4%, again the lowest of all countries, with Finland (5.9%), Sweden (5.3%) and Germany (5.2%) the only countries to exceed 5%. In the two remaining aggregates, the ordering is not so clear. Spain (47.6%) is, along with Finland (47.7%), the country in which the least intensive ICT sectors (LDIU) have the most weight in terms of GVA, but not in terms of employment (45.3%) where Sweden (52.4%) and Finland (51%) take the lead.
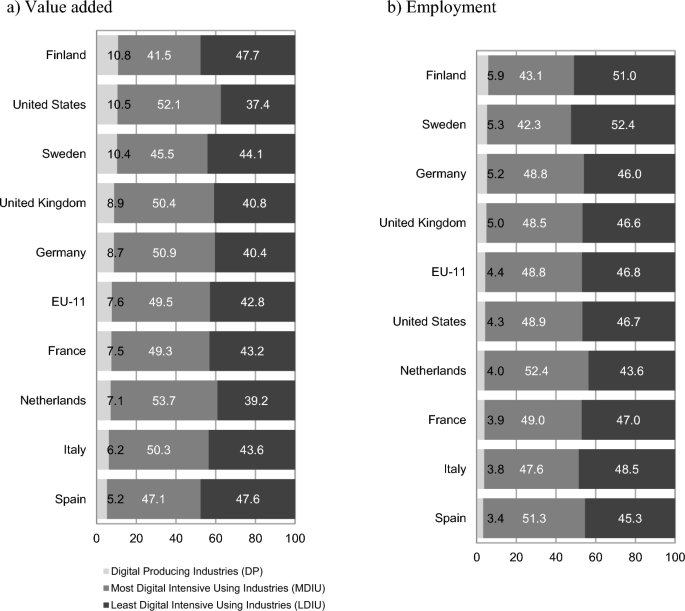
Source: JRC (2023)
Value added and employment by digital intensity. International comparison, 2020. Note EU-11 includes Germany, Austria, Belgium, Czechia, Slovakia, Spain, Finland, France, Italy, the Netherlands and Sweden. The real estate sector is excluded. Countries are ranked in descending order according to their share of DP.
In Fig. 7, the higher weight of the digital producing sector in terms of GVA than employment in all countries indicates that labour productivity in this sector is higher than in the other two. Figure 8 (panel a) confirms this: productivity in the DP sector is significantly greater in all countries. The USA has the leadership position, whereas Spain occupies the last position. Panel b highlights the exceptionally high annual growth rates in the 2000–2020 period in the production sector, with the UK (7.4%) and the USA (6.5%) leading the way, and Spain (2.1%) and Italy (1.8%) again in the last positions. Also it is worth noting that productivity growth rates in most digital intensive sectors (MDIU) are higher than in the less intensive ones (LDIU) in all countries.
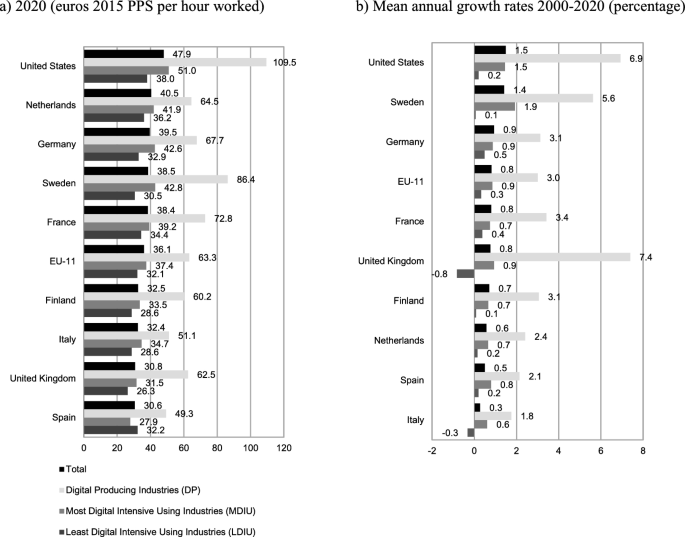
Source: JRC (2023)
Productivity per hour worked by digital intensity. International comparison. Note EU-11 includes Germany, Austria, Belgium, Czechia, Slovakia, Spain, Finland, France, Italy, the Netherlands and Sweden. The real estate sector is excluded. Countries are ranked in descending order according to total productivity.
As already shown in Fig. 4, investment in intangibles already exceeded investment in tangibles in some countries. Figure 9 confirms that this result has its origin in the DP and MDIU sectors, since in all countries the ratio of intangibles to tangibles in these two aggregates exceeds 100% (in Spain it equals it). However, in none of the countries does the ratio in the LDIU sectors reach this percentage. This result once again supports the idea that digitalisation and intangibles go hand in hand: the most digitalised sectors are also those that have greater investment in intangibles.
Source: Bontadini et al. (2023) and own elaboration
Investment in intangible assets over tangible non-residential assets by digital intensity. International comparison, 2020 (percentage). Note EU-11 includes Germany, Austria, Belgium, Czechia, Slovakia, Spain, Finland, France, Italy, the Netherlands and Sweden. The real estate sector is excluded. Year 2019 for the UK due to lack of information in the sectors of public administration, health and education. Countries are ranked in descending order according to total investment.
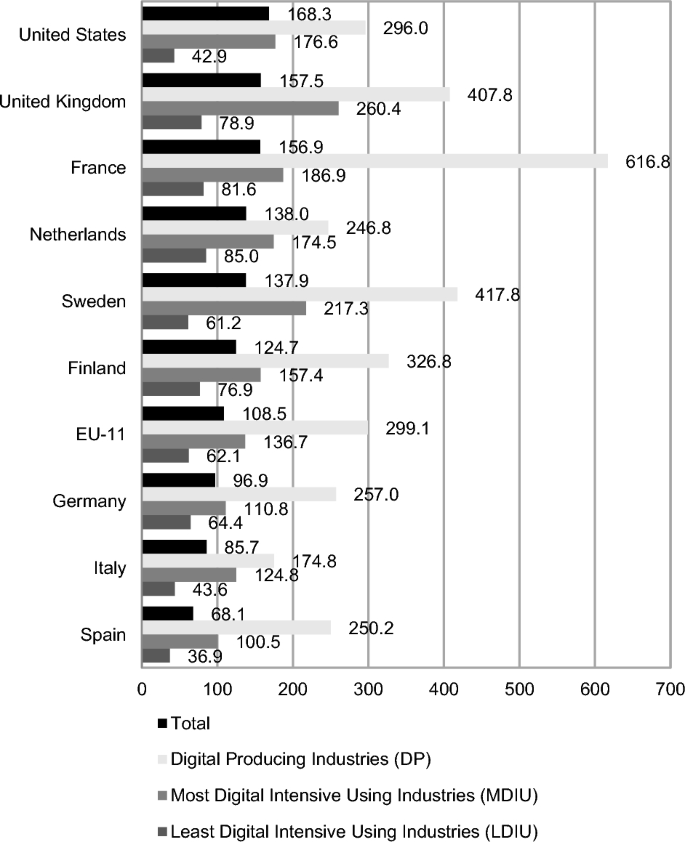
From a long-term perspective, the relevant variable is the capital endowment with which workers combine their efforts—capital deepening—measured by the ratio of the capital endowment to the number of hours worked. This information is provided in Fig. 10 for total capital (panel a), tangible capital (panel b) and intangible capital (panel c). According to panel a, in all countries the highest ratio corresponds to the DP sector, while for MDIU and LDIU there is no definite pattern. In Spain, it is higher in the less digital intensive sector than in the more intensive one. Regarding tangible capital (panel b), there is also no definite pattern. Only in the USA, Sweden and Spain does the producing sector have a higher tangible capital/hours ratio than in the other two. In most countries, this ratio is higher in the non-intensive sector than in the more intensive one. Finally, with regard to intangible capital (panel c), the DP sector has far higher ratios than the other two, followed in all countries by the ICT-intensive sector, and the least intensive last.
Source: Bontadini et al. (2023) and own elaboration
Capital stock per hour worked by digital intensity. International comparison, 2020 (euros 2015 PPS per hour worked). Note EU-11 includes Germany, Austria, Belgium, Czechia, Slovakia, Spain, Finland, France, Italy, the Netherlands and Sweden. Real estate and residential capital are excluded. Countries are ranked in descending order according to total capital stock in panel a.
In short, the information provided in this section shows the following facts in each of the three aggregations: (1) the digital producing sector is small, but has an important impact on aggregate productivity, since labour productivity is much higher and has significantly higher growth in all countries; (2) in all countries except Spain, labour productivity is higher in the digital intensive sector (MDIU) than in the less intensive one (LDIU); (3) in all countries, investment in intangibles exceeds tangible investment in digital producing and digital intensive industries, whereas in non-intensive sectors the opposite is true; and (4) the capital/labour ratio follows only a definite pattern in the case of intangible capital, not in tangible capital and therefore also not in the total. This ratio is clearly higher in the digital producing sector, followed by the intensive sector, with the less intensive in third place.
5 Digitalisation and productivity growth: towards a synthesis
This section combines the two perspectives proposed to analyse the impact of digitalisation on productivity growth. The first is the consideration of tangible assets (hardware and communications) and intangibles (software, R&D, design, brand, training provided by companies and improvements in organisational structures or management capital) directly related to digitalisation. The second is the perspective of the relationship between productive sectors and digitalisation. The analysis applies the growth accounting methodology proposed by Solow (1957) and expanded with the contributions of Jorgenson and co-authors (Jorgenson et al. 1987, 2005; Jorgenson and Schreyer 2013). Equation 1 describes the production function used for the productivity analyses presented in this section, in which Y represents real output, K denotes capital stock, L denotes labour, H denotes human capital, TFP denotes total factor productivity and values are the respective output elasticities with respect to the factors.
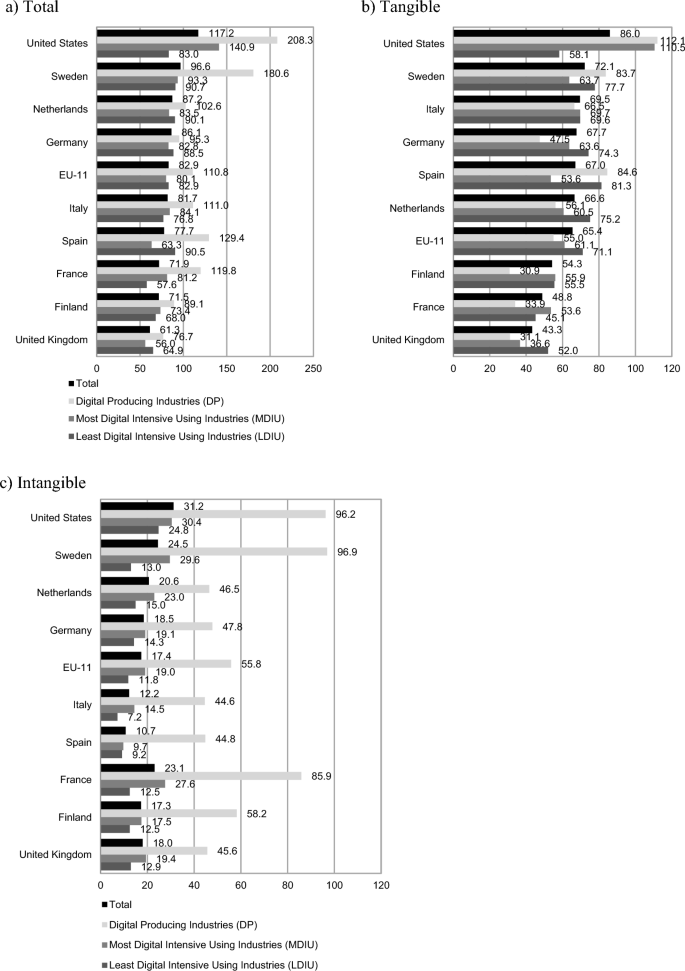
Figure 11 shows the breakdown of the growth rate of productivity per hour worked into four components: (a) changes in the labour composition, which considers improvements in human capital measured by the level of education completed; (b) capital endowments, distinguishing between tangible and intangible capital, scaled by the number of hours worked; and (c) total factor productivity (TFP) frequently interpreted as the rate of improvement of technical progress.
Source: BBVA Foundation-Ivie (2024b), Bontadini et al. (2023), INE (2024a, b), JRC (2023) and own elaboration
Contribution of factor inputs to labour productivity growth. International comparison, 2000–2020 (percentage). Note Consider the change in axis in panel b. Real estate and residential capital are excluded.
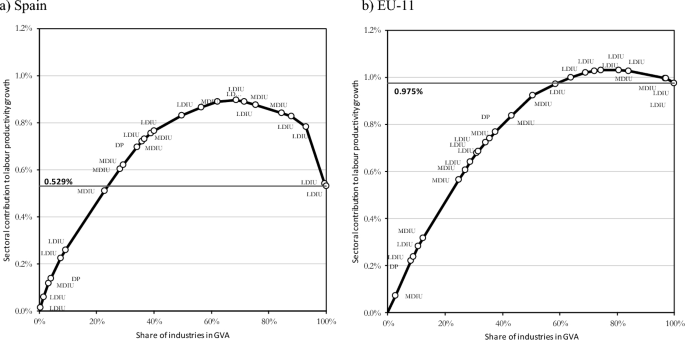
Panel a in Fig. 11 presents this breakdown for the economy as a whole during the period 2000–2020 and shows that the countries with the highest annual growth rates of labour productivity were the USA, the UK and Sweden. Technical progress and intangible capital played a very important role in the growth of the first two countries, whereas growth in Sweden was the result of the accumulation of factors of production, since the TFP contribution was practically nil. In the EU-11,Footnote7 productivity growth was modest and also a result of investment. The most unfavourable growth pattern is observed in Italy and Spain. Both economies experienced negative growth in TFP, while the other three components were positive, albeit with modest contributions.
The three remaining panels detail each of the aggregates we are considering. By far, the most striking aspect is the very strong growth pattern of the digital producing sector (panel b, note the change in the dimension of the axis) with productivity growth significantly higher than in the other two sector. This is the result of important contributions from the two main sources of technology-intensive growth, i.e. technical progress (no country has negative TFP growth, and in the UK, USA and Sweden, the contributions of TFP growth are very high), and intangible capital. Spain occupies the second worst position, after Italy, although it is interesting to note that the contributions of TFP and intangible capital are clearly higher in Spain.
The results of the decomposition for the more intensive sectors in panel c are less clear. Countries with positive TFP contributions, with the exceptions of Italy and France, and intangible capital have the strongest growth. Spain presents modest results, characterised by the country’s slow labour productivity growth, extremely low contributions of intangibles and TFP to growth, and important contributions of human and tangible capital.
Clearly, the group with the worst results is the one that represents the least ICT-intensive sectors. Spain’s labour productivity growth is close to zero and Italy’s is negative. In five countries (Spain, Italy, Sweden, the UK and the USA) and in the EU-11 average, the contribution of TFP growth was negative, strongly negative in Spain and slightly less so in Italy and Sweden. And in all countries, except the UK, the contribution of intangible capital was very limited.
Table 2 gives a more complete overview of the contributions of each of the components analysed in the previous sections on labour productivity growth in Spain and in the EU-11 over the period 2000–2020. The main factor contributing to growth was tangible capital, particularly constructions (excluding residential capital), followed by non-ICT machinery and equipment, and in last place, ICT capital. The contribution of improvements in human capital was higher than that of intangible capital. Among intangible assets, software and R&D contributed the most, followed closely by design and brand. The least favourable component was TFP, with a negative contribution that left the total growth of labour productivity at a very modest 0.53%.
The largest contribution to total productivity growth came from digital intensive industries (MDIU), accounting for 81%, followed, despite its small size, by the digital producing sector (DP) with a 18.5% share, while the least intensive (LDIU) sectors contributed a meagre 0.6%. The poor performance of the latter has its origin in a large negative contribution of TFP, which more than neutralises the positive contributions of capital and labour. Of these, the assets that contributed the most, by far, were tangible capital in constructions (excluding dwellings) and intangible R&D. This is linked to the weight that the extractive and energy industries, and in particular the manufacturing industries, have within this group.
The opposite is true for the digital producing sector, which had negative contributions from tangible capital in three components: buildings (excluding dwellings), transportation equipment and ICT equipment. Among intangibles, the greatest contribution came from software, but the real growth engine of this sector was the positive contribution of TFP.
Finally, the largest contributor to productivity growth was the ICT-intensive cluster, thanks to the significant contribution of human capital, a similar contribution of tangible and intangible capital, especially R&D and software, and the positive contribution of TFP.
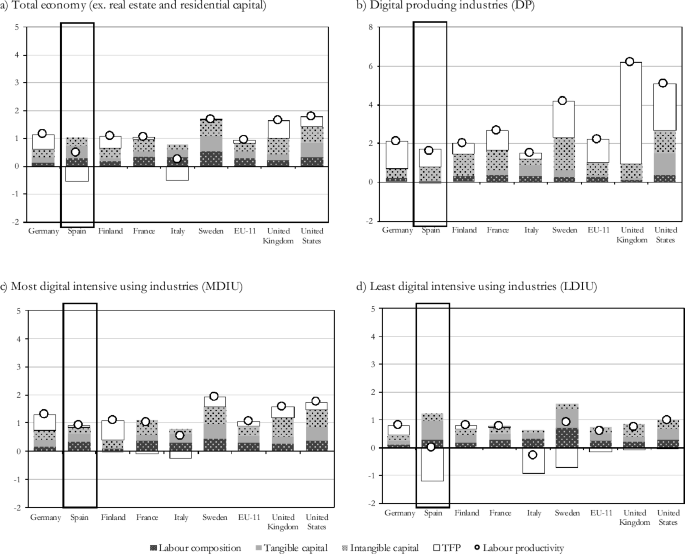
One way to visualise the contributions of different assets and sectors to the growth of labour productivity is through Harberger diagrams. Figure 12 presents the contribution of each of the sectors to aggregate productivity growth in Spain (panel a) and EU-11 (panel b) over the period 2000–2020. The horizontal axis shows the share of industries in aggregate value added and the vertical axis displays the contributions of individual sectors to the growth of labour productivity. The order of the sectors ranges from the highest positive rate of change in productivity (left) to the lowest (right). The sectors are identified by their membership in each of the three aggregations: DP, MDIU and LDIU.
Source: BBVA Foundation-Ivie (2024b), Bontadini et al. (2023), INE (2024a, b), JRC (2023) and own elaboration
Harberger: Sectoral contribution to labour productivity growth, 2000–2020 (percentage). Note Excludes real estate and residential capital. The diagram shows the cumulative sectoral contribution of the variable to labour productivity growth in the y axis and the cumulative participation in the GVA of these industries in the x axis. Sectoral groupings codes: DP: digital producing industries (DP); MDIU: most digital intensive using industries; and LDIU: least digital intensive using industries. EU-11 includes Germany, Austria, Belgium, Czechia, Finland, France, Italy, Slovakia, Spain, the Netherlands and Sweden.
Figure 12 reveals some interesting results. The first is that the lower labour productivity growth in Spain (0.529%) in comparison with the EU-11 (0.975%) has a double origin: a) a lower positive sectoral contribution (the maximum of the diagram for Spain is significantly lower than in the EU-11) and b) much higher negative contributions (the top-down part includes more sectors, most of which have large negative contributions).
Table 6 of Appendix provides a detailed analysis of the sectoral contributions represented in Fig. 12. The two digital producing industries (DP) contributed positively, both in Spain and in the EU-11. Of the nine digital intensive sectors (MDIU), only two—professional, scientific, technical, administrative and support services activities and artistic, recreational and other services—contributed negatively, both in Spain and in the EU-11. Moreover, of the 14 sectors included in the less intensive aggregation, five contributed negatively: food industry, beverages and tobacco; coke and oil refining; electricity, gas, steam and other supplies; transportation; and hospitality. By far the most negative contribution was that of the hotel sector, followed by transportation. On the contrary, the largest positive contributions came from the wholesale and retail trade; repair of motor vehicles and motorcycles (MDIU) sector and, at a distance, from financial and insurance activities (MDIU); agriculture, forestry and fishing (LDIU), and information and communication (DP).
In the EU-11, two MDIU sectors, the same as in Spain—professional, scientific and technical activities and artistic, recreational and other activities—presented negative contributions. But only two LDIU sectors contributed negatively: coke and oil refining and hospitality, although the latter with a much lower impact than Spain. On the positive side, the sectors that contributed most were trade and repair (MDIU) and information and communications (DP).Footnote8
Figure 13 confirms that the worse performance of aggregate productivity in Spain can be mostly explained by the important weight in total GVA of three low-productivity LDIU sectors: construction, accommodation and food service activities and agriculture, forestry and fishing; and one MDIU sector: wholesale and retail trade; repair of motor vehicles and motorcycles. On the contrary, in the EU-11 the DP sector—manufacture of computer, electronic and optical products; electrical equipment—and two MDIU sectors—professional, scientific, technical, administrative and support services activities and manufacture of machinery and equipment n.e.c.—have a relatively higher weight. However, while the latter contributes positively to productivity growth, the professional and other activities sector contributes negatively in both the EU-11 and Spain.
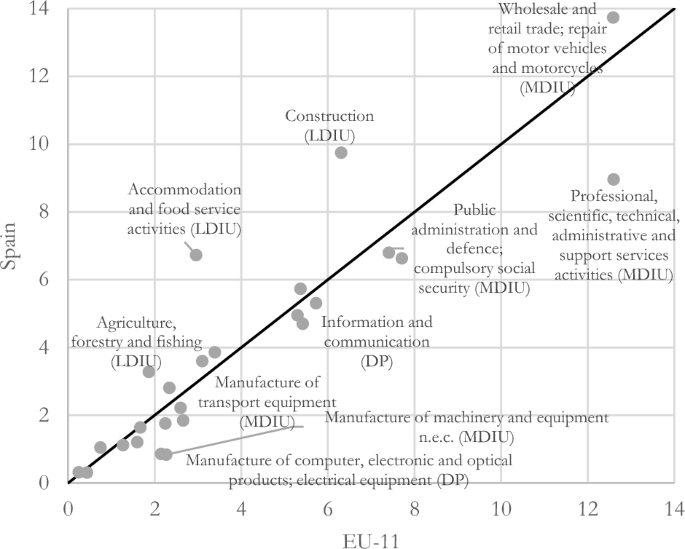
Source: BBVA Foundation-Ivie (2024b), Bontadini et al. (2023), INE (2024a, b), JRC (2023) and own elaboration
Share of industries in GVA, 2000–2020 (percentage). Note Excludes real estate. Sectoral groupings codes: DP: digital producing industries; MDIU: most digital intensive using industries; and LDIU: least digital intensive using industries. EU-11 includes Germany, Austria, Belgium, Czechia, Finland, France, Italy, Slovakia, Spain, the Netherlands and Sweden.
Both figures confirm that the productivity problem in Spain is the result of a combination of two factors: sectors that generally present lower levels of efficiency than their peers in the EU-11 and a productive specialisation biased in favour of more traditional, less digitised and, therefore, less productive sectors. The macroeconomic view offered by these results should be complemented by firm-level analyses that shed light on the origin of the differences and guide policies to correct them.
6 Looking to the future: Can AI improve Spain’s productivity?
What about the future of productivity in Spain? Can new technologies, such as artificial intelligence (AI), help strengthen productivity? The Spanish government recently proposed to establish a productivity commission and indicated that one of its priorities should be the potential of AI to increase future productivity growth. Although many other productivity commissions have already explored the role of digitalisation for productivity (Pilat 2023), only few have thus far had any specific focus on AI.
AI is widely regarded as a technology that could strengthen productivity growth and contribute to overcoming the global productivity slowdown, mainly by increasing the efficiency of workers involved in cognitive tasks, but also by helping accelerate innovation (Baily et al. 2023). Firm-level studies tend to find an association between AI use and productivity, but this effect is hard to disentangle from the broader use of ICT by firms (Calvino and Fontanelli 2023). More recent work focusing on the implementation of generative AI (e.g. large language models such as ChatGPT) on specific tasks finds robust evidence of the impacts of AI on productivity and worker performance. However, evidence at the level of firms or workers does not imply productivity growth at the sectoral or economy-wide level (Filippucci et al. 2024).
Like with other technologies, as discussed earlier in this paper, the productivity impacts of AI do not immediately and automatically follow the implementation of the technology but depend on a range of complementary investments and structural changes in firms and the economy more widely. This includes investments in complementary—often intangible—assets, as already discussed earlier in this paper, such as data, process innovation and skills to make the technology work in specific contexts; the dynamism of the business sector, including the role of young AI-intensive firms and growth of AI-intensive businesses relative to other firms; and complementary policy actions to ensure trust in AI. The need for these complementary investments also helps explain why the productivity benefits of digital technologies such as AI do not appear immediately, but only after a period of investment (Brynjolfsson et al. 2021).
Survey data on the diffusion of different digital technologies across firms provide a first indication of Spain’s potential to use AI to enhance productivity growth (Fig. 14). Spain already has several strengths in the uptake of digital technologies, notably a very high uptake of high-speed broadband (where Spain is among the leaders in the Organisation for Economic Co-operation and Development [OECD]), above-average use of several digital process technologies and strong use of big data analytics, which can serve as a precursor for the use of AI. On the uptake of AI itself, Spain is just ahead of the OECD average, but lags the leaders in the OECD, i.e. countries such as Denmark and Finland. Figure 15 also illustrates that the uptake of AI is still low compared to that of other digital technologies, which also suggests that its productivity impacts at the aggregate level may still take some time to emerge.
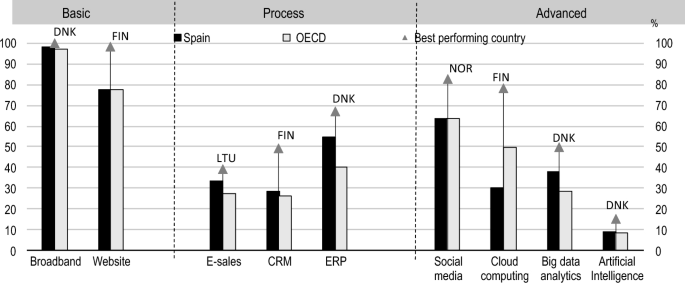
Source: OECD (2024d)
Spanish firms have several strengths in the adoption of digital technologies (% of all firms, 2023 or latest available year). Note Firms with 10 or more employees, excluding financial sector. ERP: enterprise resource planning, CRM: customer relationship management; high-speed broadband are subscriptions with 100 + Mbps.
Source: OECD (2024d)
Large- and medium-sized firms in Spain already have high uptake of AI (% of all firms, 2023 or latest available year). Note Firms with 10 or more employees, excluding financial sector.
Moreover, data on AI uptake for the business sector as a whole, as shown in Fig. 15, may hide the large variety between firms and sectors of the economy. Recent OECD work covering firm-level data for 11 countries found that AI is more widely used across large firms, although small young firms, i.e. start-ups, also tend to have high shares of AI users (Calvino and Fontanelli 2023). This is confirmed by a recent study for the USA (Bonney et al. 2024).
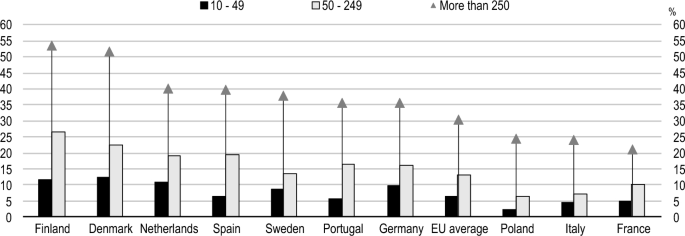
Spain’s business sector is a relatively strong performer in the uptake of AI, with large firms using AI much more than smaller firms. Large-sized (over 250 employees) and medium-sized firms (from 50–249 employees) are among the highest users of AI in the European Union (Fig. 16), only trailing leader countries like Finland, Denmark and the Netherlands, but considerably ahead of several other large EU economies such as Germany, Italy and France. Spain’s average is mainly being held back by low uptake among the smallest firms, i.e. those with 10–49 employees.
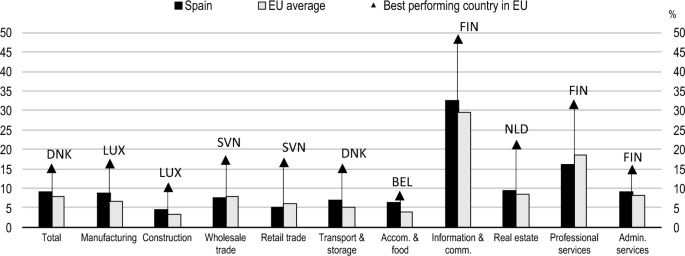
Source: OECD (2024d)
There are large differences across sectors in the uptake of AI (% of all firms, 2023 or latest available year). Note Firms with 10 or more employees, excluding financial sector.
Sectoral diffusion is also important for the potential impacts of AI on productivity. The OECD work found that AI adoption is highest in ICT and professional services (Calvino and Fontanelli 2023), with a considerable gap with other sectors of the economy. This is also the case for Spain (Fig. 16). Spain’s ICT sector has the highest uptake of AI, with almost 33% of all firms using AI, followed by professional services, with almost 16% of all firms. Uptake in other sectors is still below 10% of all firms, with only 5% of firms in construction and retail trade using AI, and only just over 6% of firms in the accommodation and food sector. These large differences across sectors, combined with the considerable gap between the use of AI in Spanish firms and that in the best performing EU countries (Fig. 16), suggests considerable scope for further diffusion of AI across the economy.
The European survey data do not provide much information on the specific uses of AI in firms, but evidence for the USA shows that marketing automation, virtual agents, natural language processing and data or text analytics are the most widely used applications in business, with larger firms mainly using AI for data analytics and robotics automation (Bonney et al. 2024). The US data also indicates that some firms do not expect to use AI, as it is not considered applicable to their business.
Compared to many other digital technologies, the diffusion of AI can be rapid, as the technology mainly involves (sometimes free) software facilitated by the Internet rather than physical infrastructure or equipment. Recent US evidence shows that some AI applications, such as generative AI, do not involve large-fixed costs, making them more attractive to young and small firms (Bonney et al. 2024). A clear illustration of this is the rapid diffusion of ChatGPT, which gained 100 million users in two months (Baily et al. 2023). This does not imply there are no barriers to the diffusion of AI and factors that will influence its impact on future productivity. Many of these have been identified previously in recent studies on Spain’s productivity performance (OECD 2021; Pérez et al. 2024b).
The first of these is investment in intangible assets, as discussed extensively earlier in this paper. While a digital technology, like AI, can be a powerful tool to enhance productivity growth, its implementation is typically accompanied by a range of complementary investments and process changes within the firm to ensure its impact. These may be changes in processes within the firm, including organisational changes; investment in a range of complementary skills; investment in data and complementary software; and product or process innovation. At the economy-wide level, the previous sections have already pointed to the low level of investment in Spain in intangible assets compared to other advanced countries, although such investment has been growing in recent years. Some of these intangible assets are particularly important for the diffusion of AI (Calvino and Fontanelli 2023). Recent evidence for the USA also finds that many firms implement organisational changes when introducing AI, such as training, new workflows, the purchasing of cloud services and storage, and changes in data collection and data management practices (Bonney et al. 2024).
A first and particularly important area of intangible investment is skills. Firms may require advanced AI-related skills if they wish to contribute to the development of AI and use it to innovate or adapt it to specific firm needs. They may also require more general digital and AI-related skills to apply existing AI applications in the firm. Such skills may be technical as well as socio-emotional (Filippucci et al. 2024). And the economy more broadly will require a broad range of skills, including digital skills, to help people adjust to an economy where many jobs are likely to be affected by AI, and where many people will require new skills or may even need to find a new job. Spain faces large challenges in skills, with relatively poor levels of education and less use of qualified labour in firms than in most European countries (Pérez et al. 2024b). Moreover, almost 25% of employed people in Spain lack sufficient digital skills. And as shown earlier in this paper, investment in training is particularly low in Spain compared with other OECD countries (Table 3).
Management skills are also important in a time of deep technological change, as they are linked to the adoption and efficient use of new technologies and because firms using advanced management practices have been found to be more productive (Criscuolo et al. 2021). Spain’s management performance is held back by a large share of (mainly small) firms that do not have professional management, with ownership, governance and management all concentrated in one person with little advanced training. Closely related to management is organisational capital, where this paper already showed that Spain invests very little compared to other OECD countries (Table 3).
Investment in R&D and innovation is also important in generating the benefits from AI for productivity. There are already signs that AI is speeding up the discovery process, e.g. in areas such as drug development or new chemicals. Moreover, firms that invest in R&D and innovation tend to be better equipped than others to engage in complementary product and process innovation that can generate the benefits from AI. Spain only invested 1.4% of GDP in R&D in 2021, however, compared to 2.2% in the EU-27 and 2.7% in the OECD area. Table 3 shows the low levels of investment in R&D in Spain compared with other OECD countries.
A second, more tangible factor that matters for the impact of AI are existing digital capabilities in firms and the digital infrastructure (Calvino and Fontanelli 2023). As shown in Fig. 15, Spain has a number of strengths in digital technologies, notably the extensive diffusion of its broadband network, where it currently only trails Korea, Japan and Iceland in the OECD area in the penetration of high-speed fibre (OECD 2024a). Digital infrastructure is also important as the implementation of AI tends to be accompanied by the use of cloud and storage services (Bonney et al. 2024). In terms of investment in ICT equipment, as shown in Table 3, Spain is a reasonably strong investor compared with other OECD countries.
A third factor that is important for the implementation of AI in Spain and its future impacts on productivity is creative destruction and business dynamism, i.e. the creation, growth and exit (destruction) of firms. This is important as productivity growth benefits from the most productive (likely AI-using) firms growing in size and gaining market share, and from the least productive (likely non-AI-using) firms decreasing in size and potentially exiting the market. Moreover, start-up firms play a particularly important role in the diffusion of a new technology, as they are often more responsive to its diffusion than existing firms (Hvide and Meling 2023). Recent evidence for the USA shows that AI use is higher in young firms (Bonney et al. 2024). Like in many other OECD countries, business dynamism in Spain has slowed down over the past decades, in particular following the 2008 economic crisis (OECD 2020). Moreover, Spain has a considerable share of low-productivity—or zombie—firms that have seen little growth over the past decade (Pérez et al. 2024b).
There are some positive signs for business dynamism linked to AI, however. Venture capital investment in Spanish AI firms has been increasing over the past few years, from only 270 million USD in 2020 to over 1.5 billion USD in 2023 (OECD 2024b). This points to strong investment in AI start-ups, although it does not necessarily imply that these firms will grow to become large firms and gain market share. Many AI start-ups tend to be acquired by existing large AI firms and may thus not grow independently in the Spanish market, limiting their potential impact on productivity growth. However, start-ups do contribute to employment creation and innovation, and thus play an important role in the diffusion process.
A fourth factor that is important for ensuring the productivity benefits of AI are specific digital policies and frameworks that provide some of the broader preconditions for AI, many of which will require investment by firms. For example, in a world where firms rely more and more on digital processes including AI and cloud services for their operations, digital security becomes an essential and increasingly strategic area of investment. As suggested by the US evidence, data collection and data management practices will increasingly be important too. For firms that use personal data in their AI applications, ensuring privacy protection will be important too, as will enhancing access to other (public or private) sources of data. And following the upcoming introduction of the European AI Act, Spanish firms will have to ensure compliance with its guidance. The experience with existing European digital legislation, notably the 2016 General Data Protection Regulation, suggests that large firms are better equipped to bear the costs of such policies and actions than smaller firms (Frey and Presidente 2024), which may serve to enhance the existing productivity gap between large and small firms.
A final factor that is important in achieving the potential productivity gains from AI is ensuring that these gains are societally acceptable and do not increase market power or inequality (Filippucci et al. 2024). To address this risk, it is important to ensure competition and foster the widespread diffusion of AI across firms. Moreover, a strong focus on education and training will be needed to address the inevitable job displacement linked to AI and reduce potential impacts on inequality in the Spanish economy.
7 Conclusions
The slowdown in labour productivity growth over the past three decades has been sustained in most advanced countries, with efficiency declines (TFP) observed in some cases, particularly in Spain. However, over the past decade, the trajectory of Spain’s productivity has become more like that of other large EU economies, with slight improvements in productivity following the end of the Great Recession, which have been reinforced since the pandemic.
The combination of little growth in productivity during a period of intense technological change is paradoxical and has led to much research into its possible causes. One of the most important hypotheses considered is that the exploitation of the potential of ICT requires investments in other assets, especially intangibles. To be productive, ICT requires not only investments in IT, data and communications, hardware and software, but also changes in the qualifications of human resources and their way of work, changes in the organisational structures of companies, and investment in R&D, process and product innovations.
The list of complementary investments is therefore long, and the weakness of any of these links may limit the exploitation of the opportunities presented by new technologies, because the result depends on the strength of the combination of assets and complementary changes. The empirical evidence in this regard is still relatively new but has advanced since intangibles are now included in the list of assets considered when analysing the sources of growth, and statistics to measure their role and allocation have improved. This has allowed us to identify two relevant stylised facts. First, an increase in differences between countries (and regions) in their endowments of intangibles, combined with reduced differences in tangibles. Second, investment in intangibles has had a stabilising influence on total investment as it is less sensitive to the business cycle than other investments.
The empirical study of the evolution of ICTs and intangibles in Spain shows that the considerable delay in productivity growth compared with other countries are associated with low levels of investment in both ICT and intangible assets. They are low compared to investment in tangible assets, while in the reference economies the opposite is true. The Spanish accumulation of investments most closely related to knowledge—ICT and intangibles—does not stand out in any of the assets, neither for the level of existing capital nor for its rate of growth. The effort is low, both in relation to GVA and compared to investment in other less productive assets, such as non-residential buildings, machinery and non-ICT equipment. In the more advanced economies, investments in intangibles already outweigh tangible ones, while in the case of Spain, it is still far from that situation.
These weaknesses are closely linked to the productive specialisation of Spain and other characteristics of its business fabric, such as the size and dynamics of the entry and exit of businesses, and the obstacles found in the implementing simple productivity policies at firm level. Two of these are especially relevant: the lack of managerial and worker capabilities, which are also included in our analysis as intangible assets, following the suggestion of Corrado et al. (2009).
In terms of specialisation, the penetration of digitisation varies greatly among sectors everywhere, being much higher in the sectors producing ICT goods and services, whose weight in the GVA and the employment of the countries is not very large. All the other sectors are already ICT users, but it is very important to differentiate between ICT-intensive and less intensive. Spain stands out for the greater weight of the latter and lesser weight of the first two groups.
This specialisation has consequences because the greater digital intensity of activities is accompanied by more investment in intangible assets and greater endowments of intangible capital per worker (hour worked). As a result of the increased use of such assets, the most productive sectors are digital producers, followed by intensive users. The less digital intensive also invest less in intangibles and are less productive.
The differences among sectors in the structure of their investments are reflected in the pattern of growth in labour productivity. In Spain, improvements in ICT-intensive sectors are based on a virtuous combination of human capital, tangible and intangible assets and TFP. In contrast, contributions from tangible assets weigh more in many non-ICT-intensive sectors, while those from intangibles weigh less, especially in the case of organisational capital, and there are no efficiency gains. In fact, this is the only sector that contributes negatively to aggregate TFP.
This review of the results of the analysis shows two areas to improve the Spanish growth pattern and thus, normalise the negative trajectory of TFP. First, by striving to increase the weight of ICT-intensive activities, both by producers and those who use them intensively, and, second, by reinforcing investments in intangibles in all activities to make better use of the investment effort.
One specific area in which opportunities for productive improvement of this nature are considered is that of artificial intelligence. On the uptake of AI by firms, Spain is just ahead of the OECD average, but lags the leaders in the OECD, i.e. countries such as Denmark and Finland. Larger firms in Spain already have relatively high uptake of AI, but the smallest firms lag compared to other EU countries, and overall uptake is still low compared with many other digital technologies. There are also large differences across sectors, showing that specialisation and the productive fabric matter.
The potential role of artificial intelligence as a future engine of productivity growth in Spain only reinforces the need for broad-ranging action on productivity-enhancing policies. This includes reinforced investment in intangible assets; initiatives to reduce gaps in workers’skills, such as digital skills; and policies to foster the firm-level adoption of digital technologies, including AI.
Low business investment in managerial capital and R&D are other weak points that should be addressed. The large productivity gaps between leading and lagging companies also need to be addressed. There is a risk that these productivity gaps might increase further with the uptake of AI, as is already visible in the large gap uptake between small firms on the one hand and large- and medium-sized firms on the other. Most importantly for pro-productivity policies, AI should be regarded as a tool that can help increase productivity if combined with other investments and actions, not as a silver bullet that can overcome the existing barriers to productivity growth.
Notes
-
Following the usual approach in studies that examine the drivers of growth, this paper does not include dwellings as assets because they are largely owned by households and the value added they produce is based on imputed estimates rather than market values.
-
Bontadini et al. (2023). An important statistical limitation is that the latest data available in the EUKLEMS database is the year 2020, the results of which are strongly affected by the COVID-19 shock. This restriction is relevant when referring to the annual data for that year, but it usually does not apply when variation rates are used for extended periods of time. In these cases, the average rate is calculated as the average of the annual rates, which reduces the impact of any particular year. When the distortion associated with the 2020 anomaly is significantly high, 2019 is the last year considered.
-
It also affects the productivity of capital, which will not be explicitly considered in this paper. The OPCE work (BBVA Foundation and Ivie 2024b) includes a detailed analysis of this variable.
-
TFP is calculated as a residual and is sensitive to the way production factors are measured and highly biased due to omitted variables. When labour and capital are estimated based on changes in their composition (human capital, types of assets), some technical progress becomes endogenous, and the growth rate of factor inputs often increases. Simultaneously, exogenous technical progress measured as a residual (TFP) is reduced (Jorgenson and Vu 2016; Pérez et al. 2024a; Serrano et al. 2017; Pérez and Benages 2017).
-
Extended GVA is the result of the inclusion as an investment of those intangible assets that the national accounts still considers as intermediate consumption. Since these assets are not included in the current definition, the data provided by the national accounts should be revised upwards to reflect the investment. In short, an extended version GVA will be considered throughout the paper, which adds the remaining intangible assets in Table 1 to the intangible assets already included in the national accounts.
-
Appendix provides details on the different tangible and intangible assets in order to measure their size—measured by the ratio between GDP (Table 3) and the investment rate represented by the growth rate over the period 1995-2019 (Table 4). In general, the assets with a greater weight in GDP are other constructions and non-ICT machinery and equipment among the tangibles, and R&D, branding and organisational structure in the intangibles.
-
EU-11 includes Germany, Austria, Belgium, Czechia, Finland, France, Italy, Slovakia, Spain, the Netherlands and Sweden.
-
This exercise has been replicated for the period 2000-2019 to assess the distortions that COVID-19 could have caused. For Spain, the most important differences are that, in this period, the sectors artistic, recreational and other services; food, beverages and tobacco industry; and transportation were all positive. On the contrary, the health and social services sector contributed negatively in 2000-2019, and positively in Q2000-2020. For the EU-11 the only sector that changed from positive in 2000-2019 to negative in 2000-2020 was that of artistic activities, recreational and other services.
References
-
Acemoglu D, Autor D, Patterson C (2023) Bottlenecks: Sectoral imbalances and the US productivity slowdown. In: Working Paper (31427). National Bureau of Economic Research, Cambridge. https://www.nber.org/papers/w31427
-
Andrews D, Criscuolo C, Gal P N (2016) The global productivity slowdown, technology divergence, and public policy: A firm level perspective. In: Hutchins Center Working Paper (24). Brookings Institution, Washington D. C. https://www.brookings.edu/wp-content/uploads/2016/09/wp24_andrews-et-al_final.pdf
-
Andrews D, Criscuolo C, Gal P N (2019) The best versus the rest: divergence across firms during the global productivity slowdown. CEP Discussion Paper (1645). Centre for Economic Performance, LSE, London. https://cep.lse.ac.uk/pubs/download/dp1645.pdf
-
Baily MN, Montalbano N (2016) Why is U.S. productivity growth so slow? Possible explanations and policy responses. In: Brookings Institution. Washington D. C., September 1. https://www.brookings.edu/articles/why-is-us-productivity-growth-so-slow-possible-explanations-and-policy-responses/
-
Baily MN, Brynjolfsson E, Korinek A (2023) Machines of Mind: The Case for an AI-Powered Productivity Boom. In: Brookings Institution. Washington D. C., 10 May. https://www.brookings.edu/articles/machines-of-mind-the-case-for-an-ai-powered-productivity-boom/
-
Bartelsman EJ, Doms M (2000) Understanding productivity: lessons from longitudinal microdata. J Econ Lit 38(3):569–594. https://doi.org/10.1257/jel.38.3.569
-
BBVA Foundation, The Valencian Institute of Economic Research (Ivie) (2024a) El stock y los servicios del capital en España y su distribución territorial y sectorial. https://www.fbbva.es/bd/el-stock-y-los-servicios-del-capital-en-espana/ Accessed April 2024a
-
BBVA Foundation, The Valencian Institute of Economic Research (Ivie) (2024b) Observatorio de la Productividad y la Competitividad en España (OPCE). https://www.fbbva.es/bd/observatorio-productividad-competitividad-espana/ Accessed April 2024b
-
Bonney K, Breaux C, Buffington C, Dinlersoz E, Foster L S, Goldschlag N, Haltiwanger JC, Kroff Z, Savage K (2024) Tracking firm use of ai in real time: a snapshot from the business trends and outlook survey. In: NBER Working Paper Series (32319). National Bureau of Economic Research, Cambridge. http://www.nber.org/papers/w32319
-
Bontadini F, Corrado C, Haskel J, Iommi M, Jona-Lasinio C (2023) EUKLEMS & INTANProd: industry productivity accounts with intangibles. Sources of growth and productivity trends: methods and main measurement challenges. In: Deliverable (D2.3.1). Luiss Guido Carli, Roma. https://euklems-intanprod-llee.luiss.it/wp-content/uploads/2023/02/EUKLEMS_INTANProd_D2.3.1.pdf
-
Brynjolfsson E (1993) The productivity paradox of information technology. Commun ACM 36(12):66–77. https://doi.org/10.1145/163298.163309
-
Brynjolfsson E, Hitt LM (2000) Beyond computation: Information technology, organizational transformation and business performance. J Econ Perspect 14(4):23–48. https://doi.org/10.1257/jep.14.4.23
-
Brynjolfsson E, Rock D, Syverson C (2021) The productivity J-Curve: how intangibles complement general purpose technologies. Am Econ J-Macroecon 13(1):333–372. https://doi.org/10.1257/mac.20180386
-
Byrne DM, Fernald JG, Reinsdorf MB (2016) Does the United States have a productivity slowdown or a measurement problem. Brook Pap Econ Act 1:109–182. https://doi.org/10.1353/eca.2016.0014
-
Calvino F, Fontanelli L (2023) A portrait of AI adopters across countries: Firm characteristics, assets’ complementarities and productivity. In: OECD Science, Technology and Industry Working Papers (02). OECD Publishing, Paris. https://doi.org/10.1787/0fb79bb9-en
-
Constantinescu C, Mattoo A, Ruta M (2019) Does vertical specialisation increase productivity? World Econ 42(8):2385–2402. https://doi.org/10.1111/twec.12801
-
Corrado C, Hulten C, Sichel D (2005) Measuring capital and technology: an expanded framework. In: Corrado C, Haltiwanger J, Sichel D (eds) Measuring capital in the new economy. University of Chicago Press, Chicago, pp 11–46
-
Corrado C, Hulten C, Sichel D (2009) Intangible capital and US economic growth. Rev Income Wealth 55(3):661–685. https://doi.org/10.1111/j.1475-4991.2009.00343.x
-
Crafts N (2010) The contribution of new technology to economic growth: Lessons from Economic History. J Iber Latin Am Econ Hist 28(3):409–440. https://doi.org/10.1017/S0212610910000157
-
Criscuolo C, Gal P, Leidecker T, Nicoletti G (2021) The human side of productivity: uncovering the role of skills and diversity for firm productivity. In: OECD Productivity Working Papers (29). OECD Publishing, Paris. https://doi.org/10.1787/5f391ba9-en
-
David PA (1990) The dynamo and the computer: an historical perspective on the modern productivity paradox. Am Econ Rev 80(2):355–361
-
Eurostat (2023) Annual national accounts. Basic breakdowns of main GDP aggregates and employment (by industry and by assets). European Commission. https://ec.europa.eu/eurostat/databrowser/view/NAMA_10_AN6/default/table?lang=en Accessed September 2023
-
Filippucci F, Gal P, Jona-Lasinio C, Leandro A, Nicoletti G (2024) The impact of artificial intelligence on productivity, distribution and growth: key mechanisms, initial evidence and policy challenges. In: OECD Artificial Intelligence Papers (15). OECD Publishing, Paris. https://doi.org/10.1787/8d900037-en
-
Frey CB, Presidente G (2024) Privacy regulation and firm performance: Estimating the GDPR effect globally. Econ Inq 62(3):1074–1089. https://doi.org/10.1111/ecin.13213
-
Fundación Cotec, The Valencian Institute of Economic Research (Ivie) (2023) Economía Intangible: comparativa internacional (1995–2022). https://cotec.es/informes/economia-intangible-comparativa-internacional/ Accessed December 2023
-
Haskel J, Westlake S (2018) Capitalism without capital. The rise of the intangible economy. Princeton University Press, New Jersey
-
Hvide H K, Meling T (2023) New technology and business dynamics. In: Fisher College of Business Working Paper (019). Columbus. https://doi.org/10.2139/ssrn.4444785
-
Instituto Nacional de Estadística (INE) (2024a) Contabilidad Nacional España (CNE). https://www.ine.es/dyngs/INEbase/es/operacion.htm?c=Estadistica_C&cid=1254736177057&menu=ultiDatos&idp=1254735576581 Accessed April 2024
-
Instituto Nacional de Estadística (INE) (2024b) Contabilidad Nacional Trimestral de España (CNTR). https://www.ine.es/dyngs/INEbase/es/operacion.htm?c=Estadistica_C&cid=1254736164439&menu=ultiDatos&idp=1254735576581 Accessed April 2024
-
Joint Research Centre (JRC) (2023) Digital Economy (Twin Transition Dataset). European Commission https://joint-research-centre.ec.europa.eu/predict/twin-transition-dataset_en
-
Jorgenson DW, Schreyer P (2013) Industry-level productivity measurement and the 2008 System of National Accounts. Rev Income Wealth 59(2):185–211. https://doi.org/10.1111/j.1475-4991.2012.00516.x
-
Jorgenson DW, Vu K (2016) The ICT revolution, world economic growth and policy issues. Telecommun Policy 40(5):383–439. https://doi.org/10.1016/j.telpol.2016.01.002
-
Jorgenson DW, Gollop F, Fraumeni B (1987) Productivity and US economic growth. Harvard University Press, Cambridge
-
Jorgenson DW, Ho MS, Stiroh K (2005) Productivity. Information technology and the american growth resurgence, vol 3. The MIT Press, Cambridge
-
OECD (Organisation for Economic Co-operation and Development) (2020) Spain: Business Dynamics. Insights on Productivity and Business Dynamics (March). OECD Publishing, Paris. https://web-archive.oecd.org/2020-07-16/551850-oecd-business-dynamics-insights-spain.pdf
-
OECD (Organisation for Economic Co-operation and Development) (2021) Enhancing digital diffusion for higher productivity in Spain. In: OECD Economic Surveys: Spain 2021. OECD Publishing, Paris, pp 72–120. https://doi.org/10.1787/21c061a0-en
-
OECD (Organisation for Economic Co-operation and Development) (2024a) OECD Broadband Statistics Update. https://www.oecd.org/digital/broadband/broadband-statistics-update.htm Accessed 12 March 2024
-
OECD (Organisation for Economic Co-operation and Development) (2024b) OECD.AI Policy Observatory – visualisations powered by JSI using data from Preqin. www.oecd.ai Accessed 27 March 2024
-
OECD (Organisation for Economic Co-operation and Development) (2024c) National Accounts. https://www.oecd.org/sdd/na/ Accessed April 2024
-
OECD (Organisation for Economic Co-operation and Development) (2024d) ICT Access and Usage by Businesses. https://stats.oecd.org/Index.aspx?DataSetCode=ICT_BUS Accessed March 2024
-
Pérez F, Benages E (2017) The role of capital accumulation in the evolution of total factor productivity in Spain. Int Product Monit 33:24–50
-
Pérez F, Mas M, Fernández de Guevara J (dirs.), Benages E, Robledo J C, García Á (2024a) El stock de capital en España y sus comunidades autónomas 1995–2023. Cambios recientes en la composición de la inversión y en las respuestas a la crisis. In: Documentos de Trabajo (1). BBVA Foundation, Bilbao. https://www.fbbva.es/wp-content/uploads/2024/02/DE_2024_DT_1_2024_Stock_Ivie.pdf
-
Pérez F, Mas M, Pilat D, Fernández de Guevara J (dirs.), Benages E, Robledo J C, Hernández L (2024b) Informe OPCE 2023. El comportamiento de la productividad en España (1995–2022). BBVA Foundation, Bilbao. https://www.fbbva.es/wp-content/uploads/2024/06/DE_2024_comportamiento-productividad-espana_1995-2022_informe-opce-2023.pdf
-
Pilat D (2004) The ICT Productivity Paradox: Insights from Micro Data. OECD Econ Stud 2004(1):37–65. https://doi.org/10.1787/eco_studies-v2004-art3-en
-
Pilat D (2023) Learning from productivity commissions. A review of analysis and policy recommendations. In: Documento de Trabajo (2). BBVA Foundation, Bilbao. https://www.fbbva.es/publicaciones/learning-from-productivity-commissions/
-
Schreyer P (2007) Old and new asset boundaries: a review article on measuring capital in the new economy. International Productivity Monitor (15): 75–80. http://www.csls.ca/ipm/15/IPM-15-schreyer-e.pdf
-
Serrano L, Pérez F, Mas M, Uriel E, Benages E, Robledo J C (2017) Acumulación y productividad del capital en España y sus comunidades autónomas en el siglo XXI. BBVA Foundation, Bilbao. https://www.fbbva.es/publicaciones/acumulacion-y-productividad-del-capital-en-espana-y-sus-comunidades-autonomas-en-el-siglo-xxi/
-
Solow RW (1957) Technical change and the aggregate production function. Rev Econ Stat 39(3):312–320. https://doi.org/10.2307/1926047
-
Solow RW (1987) You can see the computer age everywhere but in the productivity statistics. New York Review of Books (July)
-
Syverson C (2011) What determines productivity? J Econ Lit 49(2):326–365. https://doi.org/10.1257/jel.49.2.326
-
Syverson C (2017) Challenges to mismeasurement explanations for the US productivity slowdown. J Econ Perspect 31(2):165–186. https://doi.org/10.1257/jep.31.2.165
-
The Conference Board. Total Economy Database™ – Key Findings (TED). https://www.conference-board.org/data/economydatabase## Accessed April 2024
-
Van Ark B, de Vries K, Erumban A A (2019) Productivity & innovation Competencies in the midst of the digital transformation age: A EU-US comparison. In: Discussion Paper (119). Publications Office of the European Union, Luxembourg. https://doi.org/10.2765/106835
Acknowledgements
We are grateful to Eva Benages, Laura Hernández, Consuelo Mínguez and Juan Carlos Robledo for their excellent research assistance. We are also thankful for the comments and suggestions made by the discussant Luis Puch as well as participants of the 3rd Banco de España-CEMFI-UIMP Conference in the Spanish Economy, held at UIMP Santander from 4-5 July 2024 and the AIReF Seminar on Perspectives of Productivity Evolution on 23 October 2024. Furthermore, a special thanks goes to the two editors Juan Francisco Jimeno and Nezih Guner, as well as to Enrique Moral-Benito, Rafael Domenech, Ángel de la Fuente, Juan José Dolado, Paloma López García, Samuel Bentolila and José María Casado.
Funding
Open Access funding provided thanks to the CRUE-CSIC agreement with Springer Nature.
Additional information
Appendix
Appendix
See Tables 3, 4, 5, 6.
Rights and permissions
Open Access This article is licensed under a Creative Commons Attribution 4.0 International License, which permits use, sharing, adaptation, distribution and reproduction in any medium or format, as long as you give appropriate credit to the original author(s) and the source, provide a link to the Creative Commons licence, and indicate if changes were made. The images or other third party material in this article are included in the article’s Creative Commons licence, unless indicated otherwise in a credit line to the material. If material is not included in the article’s Creative Commons licence and your intended use is not permitted by statutory regulation or exceeds the permitted use, you will need to obtain permission directly from the copyright holder. To view a copy of this licence, visit http://creativecommons.org/licenses/by/4.0/.
Reprints and permissions
About this article
Cite this article
Mas, M., Pérez, F. & Pilat, D. Productivity, technology and intangible assets. SERIEs (2025). https://doi.org/10.1007/s13209-025-00310-3
- Received
- Accepted
- Published
- DOI https://doi.org/10.1007/s13209-025-00310-3
Keywords
- Technology
- Digitalisation
- Intangibles
- Productivity
JEL Classification
- 033
- 034
- 047
- 057