Article Content
1 Introduction
Cardiovascular diseases (CVDs) define a group of disorders of the heart and blood vessels that constitute the leading cause of mortality worldwide (Dimmeler 2011). The pathological complications of CVDs often involve thrombosis, i.e., the formation of a blood clot inside a blood vessel, which can lead to partial or total obstruction of blood flow. Preventing or minimizing thrombosis is also a critical consideration in the design of most implantable cardiovascular devices including prosthetic heart valves, endovascular stents, and ventricular assist devices (Sorensen et al. 1999a). In other types of devices such as foam- or coil-based systems used for aneurysm treatment, however, promoting controlled thrombus formation is key to the success of the treatment (Horn et al. 2018). Therefore, the ability to predict and potentially control the occurrence of thrombosis would be a particularly valuable tool in the arsenal of cardiovascular device engineers.
According to Virchow’s triad, there are three principal contributors to thrombus formation: vessel wall injury or dysfunction, changes in the intrinsic properties of blood, and changes in the blood flow field (Schmeltz and Metzger 2007). Thrombus formation occurs upon the dysregulation of two processes that occur simultaneously and that are mechanistically intertwined: platelet aggregation leading to platelet plug formation and the deposition of insoluble fibrin, which is generated by the coagulation cascade (Gale 2011). Platelet plug formation involves two crucial steps: platelet activation and platelet aggregation, both of which can be promoted by chemical and mechanical factors (Fig. 1).
Activated platelets typically extrude hairlike filaments from their membranes, pseudopods, leading to a star-like appearance (Fig. 1). They are more adhesive than resting platelets and attach to each other in large numbers. Activated platelets synthesize and release agonists, clot-promoting substances that enable the recruitment of other platelets, stimulating chemical platelet activation. It has been shown that platelets can also be mechanically activated by pathologically high shear rates (larger than 10,000 ) Casa et al. (2015), Brown et al. (1975), Kroll (1996).
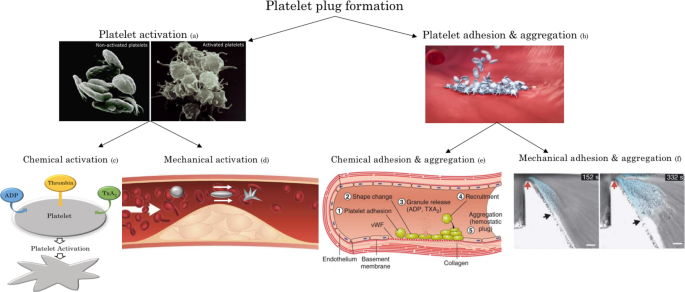
Schematic of the platelet plug formation process involving platelet activation, adhesion, and aggregation. These processes are governed by both chemical and mechanical factors (Fig. generated using images from Suzuki et al. (2012) for a, Bayer for b, Periayah et al. (2017) for e, and Nesbitt et al. (2009) for f)
Platelet aggregation involves platelets adhering to other platelets, thereby creating a plug. Chemical aggregation of platelets is dictated by the presence of damage to the vascular endothelial lining and is mediated by agonists. Activated platelets recruit additional platelets to the growing hemostatic plug in an agonist-mediated process (Rumbaut and Thiagarajan 2010). In addition to chemical aggregation, it has been demonstrated that platelet aggregation can also be mediated by mechanical factors. Nesbitt et al. (2009) have experimentally demonstrated that spatial gradients in shear rate subject platelets to rapidly changing hemodynamic conditions, leading to the development of stabilized platelet aggregates. Importantly, they reported that shear gradient-mediated platelet aggregation occurs even in the absence of coagulation agonists.
Several computational models of the formation and evolution of a thrombus have been developed. One of the first continuum models of platelet aggregation was proposed by Fogelson (1992; 1993). The model considered resting platelets, activated platelets, and a single agonist, namely adenosine diphosphate (ADP), as dilute species suspended in the bloodstream whose concentrations are governed by coupled convection-diffusion–reaction equations. Sorensen et al. (1999a), Sorensen et al. (1999b) used Fogelson’s equations as a basis for developing a more complete computational model that simulated platelet-platelet and platelet-surface adhesion, platelet activation by relevant agonists (ADP and thromboxane A2 (TxA2)), platelet-phospholipid-dependent thrombin generation, and thrombin inhibition by antithrombin III (ATIII).
The models described above focused solely on the chemical aspects of thrombosis. Goodman et al. (2005) added two important fluid dynamic considerations to the Sorensen model: the influence of thrombus growth on the blood flow and the possibility of embolization due to high shear stress. Hosseinzadegan and Tafti (2017), also basing their work on Sorensen’s model, proposed a platelet adhesion rate that is a linear function of shear rate. Finally, Wu et al. (2017) added three important features to the Sorensen model: thrombus growth, shear-induced platelet activation, and thrombus embolization due to shear.
Different literature studies proposed models of platelet plug formation based principally on the role of mechanical platelet activation. Yazdani et al. (2017) developed a shear-dependent platelet adhesion model, coupled with a tissue-factor/contact pathway coagulation cascade. Massai et al. (2012) focused on the influence of disturbed flow caused by a stenosis on shear-induced platelet activation. Finally, Liu et al. (2021) and Van Rooij et al. (2021) developed computational methods to address the growth of an arterial thrombus under elevated high shear stress conditions.
Although the existing literature provides valuable models of platelet aggregation and thrombus formation, a thrombogenesis model that takes into account both the biochemical aspects, i.e., the role of chemical agonists, as well as the significant role of spatial shear gradients (Nesbitt et al. 2009) remains lacking. Accounting for the effect of shear gradients is expected to be especially important in scenarios involving blood flow disturbances, such as in aneuryms, stenosed arteries, and cardiovascular devices. Thus, the present work aims to investigate platelet aggregate size and platelet deposition at the blood vessel wall, accounting for the first time for the role of spatial shear gradients in thrombus formation. More specifically, we wish to develop a computational model that includes: (i) platelet activation induced by both agonists and high shear stress conditions; (ii) kinetics of platelet-platelet and platelet-surface adhesion; (iii) platelet aggregation induced by both damage to the endothelium and spatial shear gradients; and (iv) alterations in local fluid dynamics due to the presence of a thrombus.
2 Methods
The goal of the present work is to extend previous modeling of platelet deposition on the vascular wall by accounting for the role of shear gradients in thrombus formation. The model, which is two-dimensional and developed using the multi-physics finite element commercial code COMSOL Multiphysics 5.6, consists of four fundamental parts: (i) modeling blood flow and species diffusion, (ii) modeling chemical and mechanical platelet activation, (iii) modeling chemical and mechanical platelet aggregation, and (iv) modeling thrombus growth and its influence on the vascular flow field.
2.1 Model formulation and governing equations
As in the previous modeling (Sorensen et al. 1999a, 1999b), we assume that platelets, agonists, and anticoagulant agents are dilute species that are transported by the blood flow, and we include the following seven species: (i) resting platelets (RP); (ii) activated platelets (AP); (iii) agonists released from platelet granules, such as ADP (; iv) agonists synthesized by activated platelets, such as TxA2 (); v) prothrombin (PT); vi) thrombin, which is generated from prothrombin on platelet phospholipid membranes (T); and vii) antithrombin (AT), which inhibits thrombin and whose action is catalyzed by heparin. The concentration of each species as a function of space and time is governed by the convection-diffusion–reaction (CDR) equation:
where is the divergence operator, is the gradient operator, is the mass diffusivity of species i in blood, is the two-dimensional fluid velocity vector, is the concentration of species i, and is a source term for species i.
The concentration boundary conditions are as follows: a constant physiological concentration for each species is imposed at the inlet of the considered vascular segment (see Table 1 below for values). An outflow condition corresponding to a zero axial concentration gradient is imposed for all the species at the outlet. At the walls, different kinds of flux boundary conditions are considered, as detailed in section 2.3.
We note that in the choice of inlet concentration boundary conditions, we conducted a preliminary analysis to establish the most accurate such conditions to impose. In this context, two types of conditions were considered: a constant inlet concentration and a periodic condition. A constant inlet concentration for platelets and the other species implies a continuous influx over the entire simulation time. A periodic boundary condition, on the other hand, represents a situation where the same amount of platelets, set by the initial condition, recirculates in the domain over the entire simulation time, mimicking blood circulation. It was observed (data not shown) that while platelet plug growth is well represented by implementing a periodic condition at the beginning of the simulation, the aggregate size reaches a plateau after approximately 50 s because all the platelets in the domain had adhered to the vessel wall. This behavior can be explained by the fact that while it is true that blood recirculation occurs in the vessel, the total amount of platelets that recirculates is not only ones contained in the analyzed domain but also ones contained in the other parts of the vascular system. Thus, for a system that is significantly larger than the analyzed domain, which is certainly the case here, the periodic inlet condition becomes less pertinent. Therefore, we finally chose a constant inlet concentration for modeling platelet plug growth.
2.2 Modeling blood flow and species diffusion
Blood is regarded as an incompressible Newtonian fluid. The assumption of Newtonian behavior is considered valid at sufficiently high shear rates, , Sarkar et al. (2024), which is typically the case for arterial flows and within cardiovascular devices. The blood flow field is evaluated by solving the Navier–Stokes equations:
where is the velocity vector, p is the fluid pressure, and and are the blood density and kinematic viscosity, respectively. At the inlet, a prescribed constant velocity is imposed, while atmospheric pressure is considered at the outlet. Finally, no-slip conditions are imposed at the walls.
It has been shown that red blood cells have a shear-dependent diffusion-augmenting effect on the transport of platelets and large proteins. Thus, similar to Sorensen et al. (1999a) and Wootton et al. (2001), we adjust the diffusivities for platelets and “larger” species, namely thrombin, prothrombin, and ATIII, by adding a shear-enhanced diffusivity to the Brownian diffusivity coefficient :
The shear-enhanced diffusivity was modeled using the Keller formulation (Keller 1971) in which the augmentation factor is linearly proportional to the local shear rate and to red blood cell size:
where is the red blood cell diameter and is the local fluid shear rate.
2.3 Modeling platelet activation
Platelet activation is assumed to occur as a result of stimulation by both platelet agonists (chemical activation) and shear stress (mechanical activation).
2.3.1 Chemical platelet activation
Chemical platelet activation is simulated following the Sorensen et al. (1999a) approach, implementing the source terms in eq. 1 for the different species as follows:
In these equations, represents a first-order reaction rate constant (in ) that determines the rate of activation of resting platelets, i.e., the rate of consumption of resting platelets and of generation of activated platelets by the first-order reaction , as a function of local agonist concentrations; is the amount of agonist j released per platelet, so that represents the rate at which agonist j is generated from newly activated platelets. The source term for aps (Eq. (9)) represents generation and inhibition of an agonist synthesized by the activated platelets, and the term is the rate of synthesis of the agonist. In equations (9) and (8), is a first-order reaction rate constant for the inhibition of agonist j.
Following Sorensen et al. (1999a), the rate of activation of resting platelets is treated as a linear function of the weighted concentrations of the agonists with an activation threshold:
where is the activation function:
In these equations, is the total number of agonists in the model, is the concentration of the jth agonist, is the threshold concentration at which the jth agonist induces platelet activation, is an agonist-specific weight to mimic the differential effects of strong and weak agonists on the activation reaction which we here assume equal to one for all the agonists, and is a “characteristic” time constant for platelet activation. In order to avoid function discontinuities and consequent numerical instabilities, it was decided to model the platelet activation rate as where is a smooth step function localized where is equal to one and with the minimum and maximum values equal to zero and one, respectively.
The source terms for PT, T, and AT represent the thrombin-related portion of the model. It is assumed that the generation of thrombin from prothrombin takes place both on platelets adhered to the wall and bulk platelets; the equations for surface-based thrombin generation are incorporated into the flux boundary conditions described in section 2.3. To represent the different rates of thrombin generation from prothrombin at the surface of resting and activated platelets, two rate constants and in the source terms for PT and T are implemented. In the source terms for T and AT, is the rate of the heparin-catalyzed inactivation of thrombin by antithrombin, which depends on different factors such as the concentration of heparin [H] (which is assumed constant during the process) as well as the concentrations of both thrombin and antithrombin (see Appendix A for the expression of ).
2.3.2 Mechanical platelet activation
Mechanical platelet activation is implemented through a first-order reaction rate constant (in ). In line with the approaches suggested by Chesnutt et al. (2015) and Feng et al. (2017), the rate of mechanical activation of resting platelets is considered to be solely dependent on the local shear rate. Thus, the dependence of mechanical platelet activation on exposure time is not considered (Nobili et al. 2008). For sake of simplicity, similar to (Eq. (13)), a linear equation (Han et al. 2022) with an activation threshold is considered for modeling :
where is the shear rate of blood flow and is the critical shear rate at which the resting platelets begin to become activated. Thus, in the proposed model, the rate of activation of resting platelets is the sum of the chemical activation rate and the mechanical activation rate:
2.4 Modeling platelet adhesion and aggregation
2.4.1 Chemical platelet adhesion and aggregation
Chemical platelet adhesion and aggregation occur if the endothelium is damaged or injured. The platelets adhering to the surface tend to be activated, and they synthesize and release the agonists that, in turn, enable the recruitment of other platelets. Platelet-surface adhesion and platelet-platelet adhesion, i.e., aggregation, are modeled by surface-flux boundary conditions, similar to Sorensen et al. (1999a) and Goodman et al. (2005). The flux boundary conditions are described using first-order rate equations as follows (where a positive term indicates an efflux or consumption from the domain and a negative term indicates an influx or generation):
- adhesion of resting platelets to the vascular surface only and not to other platelets:
(17)
- adhesion of activated platelets to the vascular surface and to deposited activated platelets:
(18)
- generation of platelet-released agonists ():
(19)
- generation of platelet-synthesized agonists ():
(20)
- consumption of prothrombin due to thrombin generation:
(21)
- generation of thrombin from prothrombin on deposited platelets:
(22)
In all these boundary conditions, species concentrations correspond to the values at the vessel wall. In these equations, , , and are heterogeneous reaction rate constants that govern the rates of adhesion between, respectively, resting platelets and the vascular surface, activated platelets and the vascular surface, and deposited activated platelets and other platelets, while is the fraction of adhering resting platelets that activate upon surface contact. All these flux boundary conditions need to be imposed in the portion of the vessel wall that is modeled as injured. For antithrombin, which is not involved in surface-based reactions (Sorensen et al. 1999a), a no flux condition was imposed.
The platelet-surface deposition Eqs. (17–19), in line with Sorensen’s formulation (Sorensen et al. 1999a) , included a saturation term that limited platelet adhesion to the capacity of the surface, preventing additional platelet-surface adhesion once the capacity of the surface for platelets is reached. The saturation term is formulated as follows:
where is the total capacity of the surface for platelets and M(x, t), which is the total surface coverage with platelets at time t and at position x, is determined as follows:
Following Sorensen et al. (1999a), in addition to M(x, t), the quantities , , , which represent, respectively, the portion of the surface coverage due to activated platelets, the portion of the surface coverage due to resting platelets, and the total amount of deposited activated platelets (activated platelet-surface plus platelet-platelet adhesion), were defined as follows:
where is the activation rate constant evaluated at the wall. Thus, the term represents the rate of activation of deposited resting platelets due to agonists.
The flux boundary conditions are coupled to the saturation term (Eq.23) and the term M(x, t), i.e., the total surface coverage with platelets, (Eq.24). Combining Equations (17), (23), and (24) yields the following single equation for M(x, t), the total surface coverage with platelets as a function of space and time:
Differentiating Eq. 28 leads to an ordinary differential equation (ODE) that describes the time rate of change of the total surface coverage with platelets:
Proceeding analogously for , and , we obtain:
In order to impose the proper flux boundary conditions (Eqs.17-22), the ordinary differential equations (ODE) system above has to be solved. Thus, the overall model is represented by a coupled Navier Stokes-CDR-ODE system.
Assuming that is equal to 1, i.e., that all the adhering resting platelets are activated upon surface contact, the ODE system can be simplified as follows:
2.4.2 Mechanical platelet adhesion and aggregation
A key distinguishing feature of our current model is the inclusion of platelet aggregation in regions of negative shear gradients, in accordance with the experimental findings of Nesbitt et al. (2009). To this end, a flux boundary condition for both resting and activated platelets that applies in zones of negative axial derivatives of shear rate is implemented. Furthermore, because the experimental evidence (Nesbitt et al. 2009) suggests that the extent of platelet aggregation depends on the magnitude of the negative shear gradient, the introduced flux boundary conditions for resting and activated platelets are assumed to be directly proportional to the absolute value of the negative shear gradient. More specifically, the flux boundary condition that represents mechanical deposition of resting platelets is:
while the flux boundary condition that represents mechanical deposition and aggregation of activated platelets is:
In Eq. 37-38, the ratio is a scale factor introduced to obtain a more feasible value of the fluxes and to ensure the consistency of the units of measurement. Here L is the characteristic length of the domain, taken as 10 times the entrance diameter of the geometry, and is the wall shear rate in the straight vessel upstream the disturbance.
The flux boundary conditions that characterize the coupled chemical and mechanical problem become:
and the ODE system that describes the platelet deposition and aggregation on the damaged surface, including both chemical and mechanical contributions, becomes:
2.5 Modeling the influence of thrombus growth on the flow field
In the present model, thrombus growth was tracked in time. The thrombus was assumed to be impermeable; thus, its growth was represented simply as a normal displacement of the portion of the domain boundary to which platelets adhere. The impact of the altered vessel geometry on the local fluid dynamics is computed, and the effect of the new flow field on platelet activation and aggregation is subsequently determined. The deformable domain, implemented using the Arbirary Lagrangian–Eulerian (ALE) formulation in the Moving Mesh module of COMSOL 5.6, considered that in the portion of the vessel wall to which platelets adhere, the normal mesh displacement is given by:
where is the volume of a single platelet, is the total platelet deposition at the wall, and h is a scale factor that accounts for thrombus composition. Thrombi may be composed principally of platelets (white thrombi) or may contain a significant number of red blood cells (red and mixed thrombi). The volume of a red blood cell is approximately 24 times that of a platelet. Thus, considering different values of h ranging from 1 to 24 allows modeling thrombi that span the spectrum of 0 to 100% red blood cells.
2.6 Model parameters
Table 1 provides the values of the main model parameters and the literature sources from which they were derived (see Appendix B for the remaining parameters).
3 Results
3.1 Model validation
The current computational model was validated against the in vitro thrombus formation experimental results of Nesbitt et al. (2009). In those experiments, the authors considered the flow of whole blood in a microfluidic chamber with a 90% stenosis, and they reported the time evolution of the size of the blood aggregate that formed in the expanding flow zone immediately downstream of the stenosis. To validate our computational model against these in vitro results, we considered a geometry analogous to that in Nesbitt et al.’s experiments with an initial straight section that is followed by a 90% stenosis downstream of which is a larger expansion zone. The imposed flow boundary conditions ensure that wall shear rate values at the inlet, stenosis, and expansion zone matched those in Nesbitt et al.’s experiments, namely 1800 , higher than 20000 and 200 , respectively (Nesbitt et al. 2009). Furthermore, Nesbitt et al. reported that the thrombi observed in their in vitro experiments consisted principally of platelets (Nesbitt et al. 2009). In light of the above, a scale factor h of 1, representing a thrombus composed uniquely of platelets, was considered for the validation.
The simulations were carried out using physiological parameter values from the literature. As is typical for biological and biophysical features, these values exhibit inherent variability. The specific values used for model validation and following model applications are summarized in Table 1.
Figure 2, reporting the results obtained for this specific set of model parameters, reveals that the current computational model is capable of capturing the dynamics of aggregate formation. Additionally, Fig. 2 illustrates, along with the experimental data, computational results obtained including the role of shear gradients, computational results obtained excluding the role of shear gradients, and the results obtained excluding shear gradient-mediated platelet aggregation and shear stress-mediated platelet activation. As evident from the results, incorporating the role of spatial shear gradients in promoting platelet aggregation is essential for obtaining thrombus growth predictions that are comparable to the experimental data. Indeed, biochemical platelet activation and aggregation and shear induced-platelet activation cannot by themselves reproduce the in vitro thrombus formation downstream of the stenosis observed experimentally by Nesbitt et al. (2009).
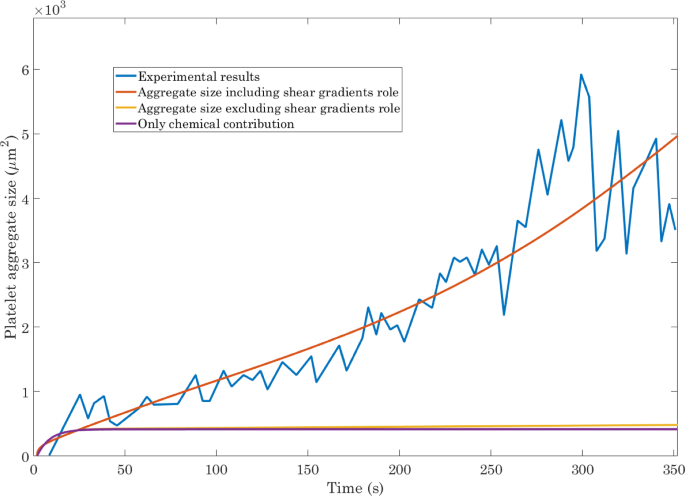
Validation of the computational model against the experimental results of Nesbitt et al. (2009) for the time evolution of platelet aggregate size. Incorporating the effects of spatial shear gradients is essential
It should be noted that, although the model contains a large number of parameters, the only parameter that was arbitrarily set is the ratio which is a scale factor introduced to obtain a more feasible value of the flux of negative shear gradient-mediated platelet aggregation and to ensure the consistency of the units of measurement. We tested several values of L, namely 5, 10, and 15 times the entrance diameter, and the value specified in Table 1, 10 times the entrance diameter, was determined to be the one that best reproduces the experimental data.
It should be pointed out that our formulation does not account for the differential effects of strong and weak agonists on platelet activation (Wu et al. 2017). This same assumption was made in a number of other studies:including Sorensen et al. (1999a), Sorensen et al. (1999b), Rezaeimoghaddam and Vosse (2022). A sensitivity analysis on the agonist-specific weights () demonstrated that assuming values of and greater than one greatly enhances chemical platelet activation, resulting in a large increase in the amount of available activated platelets for the growth of aggregate size (data not shown). Importantly, this analysis showed that our benchmark validation case (where is equal to one for all the three agonists) yields computational predictions that most accurately match the experimental data.
3.2 Thrombus formation in a stenosed vessel
Thrombosis is commonly observed in stenosed vessels,(Flores Marcial et al. (2022), Westein et al. (2013)). Now that our computational model has been validated against experiments, we used it to investigate thrombus formation in stenosed vascular segments. Of particular interest in this regard are the effects of the extent of vessel stenosis and the inlet flow conditions.
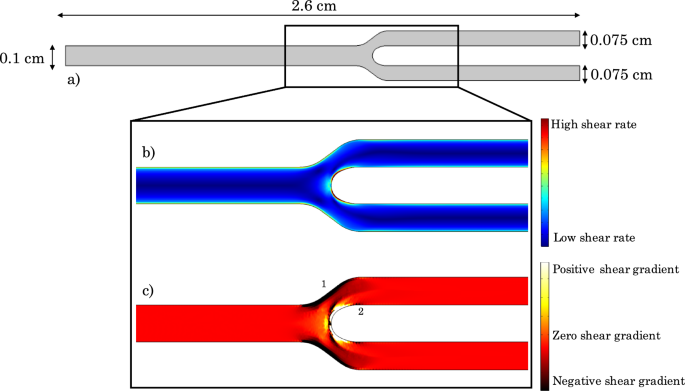
The simulations were performed using the domain depicted in Fig. 3a. In this geometry, the percent stenosis is defined as follows:
Figure 3b and c respectively depict the expected shear rate and shear gradient distributions in a stenosed vessel. In the contraction zone, the flow accelerates, leading to a positive shear gradient. The stenosis throat or apex demarcates the point at which the peak shear is attained. Finally, the expansion zone downstream of the stenosis demarcates the region of flow deceleration and hence negative shear gradient.
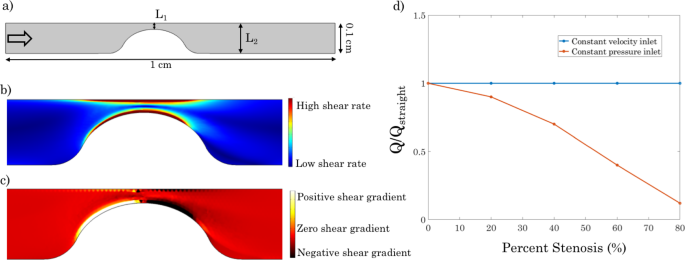
Geometry and inlet boundary conditions considered for the stenosed vessel simulations. a Flow domain. Arrow at the inlet denotes the flow direction. b Shear rate distribution in a stenosed vessel. c) Shear gradient distribution in a stenosed vessel. d Normalized flow rate as a function of percent stenosis for either a prescribed inlet velocity or a prescribed inlet pressure. The normalization is relative to flow in a straight (unstenosed) vessel
Two different inlet boundary conditions were considered for flow field assessment: a prescribed constant velocity and a prescribed constant pressure. Due to mass conservation, a prescribed inlet velocity leads to the same flow rate through the vessel regardless of the percent stenosis. On the other hand, a prescribed inlet pressure results in a flow rate that decreases progressively as the percent stenosis is increased due to the increased hydraulic resistance. These two distinct behaviors are illustrated in Fig. 3d. At the outlet, a zero pressure boundary condition is imposed in all simulations.
In the simulations, the bottom vessel surface is assumed to be an active surface, i.e., a damaged or inflamed endothelium. Platelet deposition and aggregation, even when driven by negative shear gradients, is assumed to only occur on this damaged surface. Furthermore, a scale factor of 3 is considered in order to take into account the fact that the platelet plug is likely to trap a certain amount of red blood cells during the aggregation process.
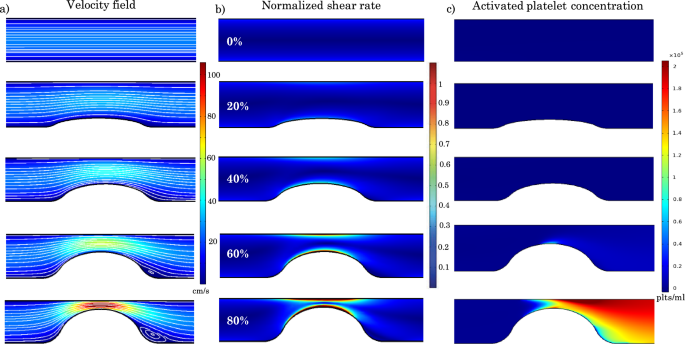
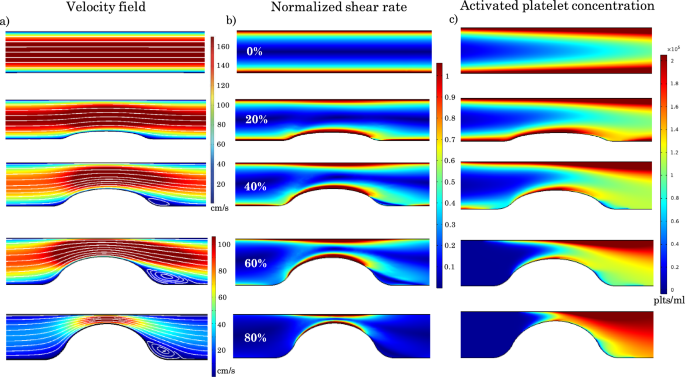
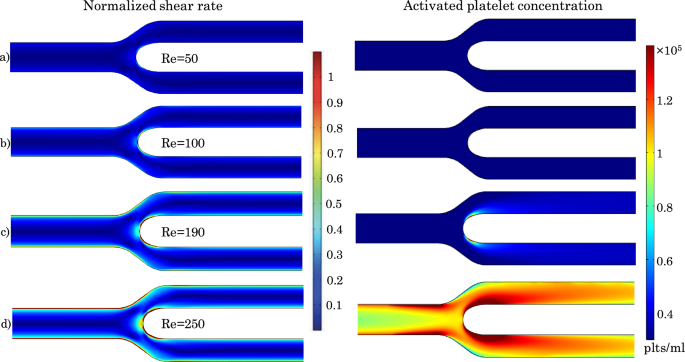
Velocity field, shear rate distribution, and activated platelet concentration for vessels with different percent stenosis and a constant inlet velocity of 17 cm/s. a Velocity contours and streamlines for different percent stenosis values. b Normalized shear rate distribution for different percent stenosis values. The normalization is relative to the critical shear rate needed for platelet activation. c Activated platelet concentration distribution for different percent stenosis values
3.2.1 Constant inlet velocity
Figure 4 illustrates the distributions of velocity contours and associated streamlines, normalized shear rate (where the normalization is relative to the critical value needed for platelet activation which is taken to be 10,000 ), and activated platelet concentration within the stenosed vessel for stenoses ranging from 0 to 80% and for a physiological value of the inlet velocity of 17 cm/s (Carretero et al. 2020), which corresponds to a Reynolds number of 50 (Doutel et al. 2021). As expected, the velocity and shear rate within the contraction zone increase as the percent stenosis increases. As depicted in Fig. 4a, recirculation zones are observed downstream of the stenosis for the cases of 60% and 80% stenosis.
For values smaller than 60%, the shear rate remains below the critical threshold within the entire domain. The critical shear rate is attained in the 60% stenosis vessel, leading to platelet activation and hence to the activated platelet distribution shown in Fig. 4c. For an 80% stenosis vessel, the critical shear rate threshold encompasses a wider area of the domain, and the peak shear rate is higher than in the 60% case, resulting in significantly higher activated platelet concentrations (Fig. 4c).
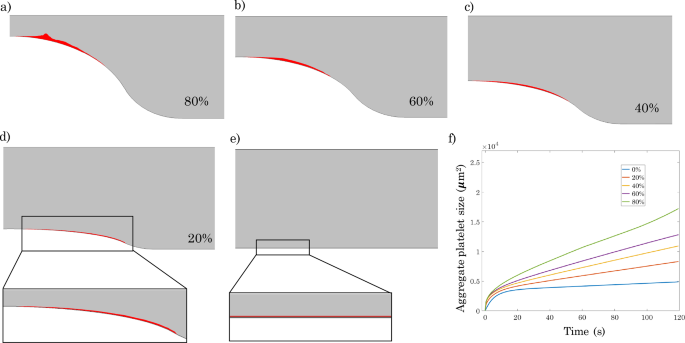
Figure 5 depicts how stenosis severity ultimately impacts platelet plug size as well as the dynamics of platelet plug evolution. Consistent with the results of Fig. 4, while stenoses up to 60% lead to limited platelet plug formation, there is a dramatic change in behavior at 80% stenosis with a much larger platelet plug that evolves much more rapidly. This effect can be attributed to two distinct but additive factors that increase rapidly at 80% stenosis, namely larger shear gradients and greater mechanical platelet activation. It should be noted that although Fig. 5f suggests that platelet plugs evolve similarly in vessels with 0 to 60% stenosis, the 60% stenosis case is actually qualitatively different from the 0 to 40% stenosis cases in that while the platelet plug size for the 0–40% stenosis cases attains a plateau, this is not the case for 60% stenosis where plug size continues to grow, albeit at a very slow rate. The reason for this difference is that in the 0–40% stenosis cases, the shear rate in the contraction zone never exceeds the critical shear rate, and platelet activation thus does not occur. Consequently, platelet plug growth stops once the damaged endothelial surface is saturated with a first layer of resting platelets, and the remaining resting platelets cannot adhere to other platelets. On the other hand, in the 60% stenosis case, the critical shear rate for platelet activation is attained, which leads to a situation where these activated platelets are able to attach to underlying layers of adhered platelets and thus continue the process of platelet aggregation and plug formation.
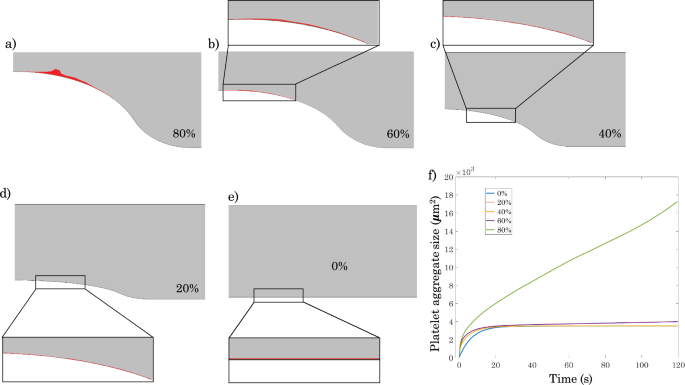
Effect of stenosis severity on platelet plug formation for a prescribed inlet velocity of 17 cm/s and h=3. a–e Platelet plug formation after 120 s for 80%, 60%, 40%, 20%, and 0% stenosis, respectively. f Time evolution of platelet plug size for vessels with different percent stenosis
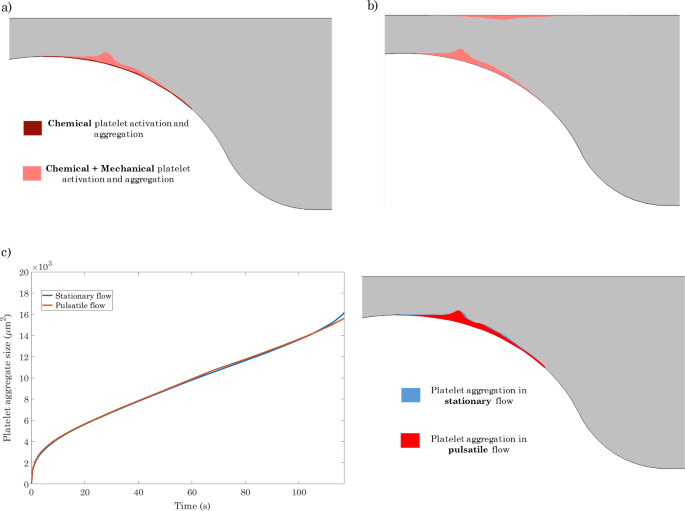
a Platelet plug after 120 s driven by only biochemical factors vs. that driven by both biochemical and mechanical factors in a vessel with 80% stenosis. b Platelet plug after 120 s in a vessel with 80% stenosis assuming that platelet aggregation is driven by negative shear gradients regardless of whether or not the endothelium is damaged or inflamed. c Left: Effect of blood flow pulsatility on the time evolution of platelet plug aggregate size in a vessel with 80% stenosis. Right: Platelet plug after 120 s for stationary flow vs. pulsatile flow
As already described, the current model of platelet plug formation includes contributions from both mechanical and biochemical factors. In order to better understand the process of plug development, we wish to delineate the relative contributions of these two factors. Figure 6a compares the size of the platelet plug predicted by our model for an 80% stenosis after 120 s when only biochemical factors drive plug formation to that obtained when the interplay between biochemical and mechanical factors is considered. Once again, the fact that inclusion of mechanical factors results in a considerably larger platelet plug underscores the importance of including mechanical platelet activation and aggregation in the mathematical model, particularly for geometries characterized by non-constant wall shear rates.
Figure 6b depicts thrombus formation predicted by the model for the case of 80% stenosis after 120 s assuming that platelet aggregation is driven by negative shear gradients regardless of whether or not the endothelium is damaged or inflamed. In this case, two areas of platelet deposition are observed, corresponding to the zones of negative shear gradients (cf: Fig. 3c). This localization agrees well with the in vitro results reported in Nesbitt et al. (2009).
As the platelet plug grows out from the vascular wall, it begins to penetrate the lumen and to exert an effect on the vascular flow field. Figure 6c compares the time evolution of platelet plug aggregate size for stationary flow to that for pulsatile flow having a sinusoidal non-reversing flow waveform that oscillates around the values of the stationary inlet velocity with a physiological frequency of 1 Hz:
where is the angular frequency. The results suggest that blood flow pulsatility does not have a significant effect on platelet plug formation, at least for the duration of time considered. Platelet plug evolution under pulsatile flow exhibits small oscillations, but the overall size of the aggregate is virtually unaffected by flow unsteadiness. These results are reasonable because the waveform oscillates around the value of the stationary velocity inlet, implying that periodic decreases and increases in mechanical platelet activation and shear gradient magnitude occur during the cycle, but the average rate of platelet plug growth remains the same.
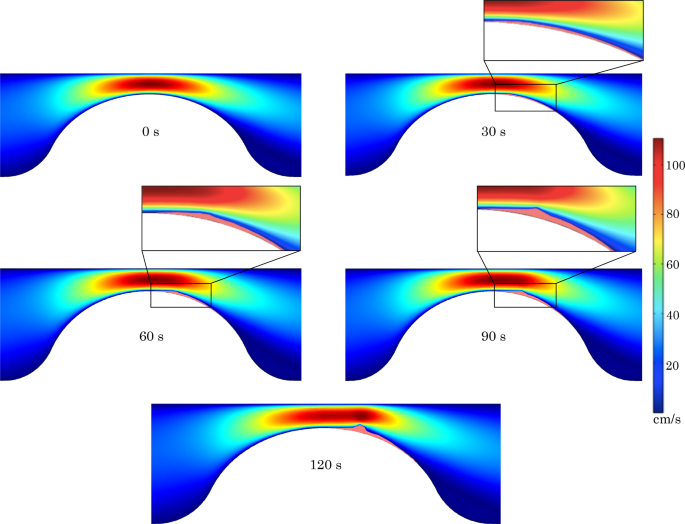
Effect of thrombus growth on the blood velocity field in a vessel with 80% stenosis at time points ranging from 0 to 120 s. Zoom on the thrombus peak for 30 s, 60 s, 90 s
Figure 7 depicts the impact of platelet plug growth on the blood flow field in the most extreme scenario analyzed, namely an 80% stenosis. Under these conditions, the effect of the platelet plug on the velocity field becomes visible after 90 s. After 120 s, the velocity field in the contraction zone is significantly altered, with the region in which velocities higher than 100 cm/s are attained becoming significantly more elongated. The location of peak velocity is also observed to be shifted downstream of the stenosis neck, corresponding to the position where the thrombus reaches its maximum extent.
Velocity field, shear rate distribution, and platelet activation for vessels with different percent stenosis and a prescribed inlet pressure of 2.8 kPa.a Velocity contours and streamlines for different percent stenosis values. b Normalized shear rate distribution for different percent stenosis values. The normalization is relative to the critical shear rate needed for platelet activation. c Activated platelet concentration distribution for different percent stenosis values
3.2.2 Constant inlet pressure
Figure 8 depicts the distributions of velocity contours and associated streamlines, normalized shear rate (where the normalization is relative to the critical value needed for platelet activation which is taken to be 10,000 ), and activated platelet concentration within the stenosed vessel for stenoses ranging from 0 to 80% and for a constant inlet pressure of 2.8 kPa. In a vessel with 80% of stenosis, this value of the inlet pressure induces the same blood flow field obtained by imposing an inlet velocity of 17 cm/s as considered in the previous section. Imposing a constant pressure at the inlet implies that the flow rate decreases progressively with increasing stenosis severity due to the increased hydraulic resistance as already discussed (cf: Fig. 3d). Consequently, the mean velocity in the vessel and the wall shear rate also decrease with increasing stenosis severity (see Fig. 8a). Under these conditions, recirculation zones downstream of the stenosis are observed starting at 40% stenosis. In the case of straight vessel, the considered inlet pressure leads to a wall shear rate that exceeds the critical value required for platelet activation as illustrated in the top row of Fig. 8. Although increasing stenosis severity leads to a reduction in the portion of the vessel wall where the critical shear rate is attained, significant platelet activation occurs nevertheless in all the considered vessel configurations.
Effect of stenosis severity on platelet plug formation for a prescribed constant inlet pressure of 2.8 kPa and h=3.a–e Platelet plug formation after 120 s for 80%, 60%, 40%, 20%, and 0% stenosis, respectively. f Time evolution of platelet plug size for vessels with different percent stenosis
Figure 9a–e provides a visual depiction of the progressive increase in platelet plug size with increasing stenosis severity after 120 s. The time evolution of platelet plug size during this period is illustrated in Fig. 9f. It is noteworthy that this time evolution for the case of constant inlet pressure shown here is considerably different from the case of constant inlet velocity (cf: Fig. 5f). This difference is not surprising in light of the differences in activated platelet concentration profiles between the two scenarios (compare Fig. 4c to Fig. 8c). We note that in the case of an 80% stenosis, the computed aggregate size after 120 s for the constant inlet pressure case is very close to that previously shown for the constant inlet velocity (see Fig. 5e). This, of course, is not surprising in light of the fact that we have set the boundary conditions so as to have the same initial flow field in both cases for the vessel with 80% stenosis.
3.3 Thrombus formation at a bifurcation
The capabilities of the proposed model were also tested in a bifurcation geometry. To this end, platelet plug development at a symmetric bifurcation was investigated for different Reynolds numbers ranging from 50 to 250. The analysis assumes that platelet aggregation occurs for negative shear gradients regardless of endothelial damage or inflammation.
Bifurcation geometry and associated shear rate and shear gradient distributions. a Computational domain considered. b Shear rate distribution. c Shear gradient distribution
Figure 10 shows the considered bifurcation geometry along with the computed shear rate and shear gradient distributions. As expected, the highest shear stress zone is observed along the inner walls of the flow divider due to the skewness of the velocity profile toward this wall. Conversely, a lower shear stress zone prevails along the outer bifurcation walls. Thus, the velocity profile skewness results in positive shear gradients along the inner walls of the bifurcation and negative shear gradients along the outer vessel walls (zone 1 in Fig. 10c). Furthermore, shortly downstream of the positive shear gradient area along the inner walls of the bifurcation, a flow deceleration zone and hence a region of negative shear gradient is observed (zone 2 in Fig. 10c).
Distributions of normalized shear rate (left) and activated platelet concentration (right) in the considered bifurcation for different Reynolds numbers ranging from 50 to 250. For the normalized shear rate maps, the normalization is relative to the critical shear rate needed for platelet activation
Figure 11 depicts the distribution of normalized shear rate relative to the critical shear rate needed for platelet activation within the bifurcation geometry (left column) as well as the distribution of activated platelets (right column) for the different values of Reynolds numbers considered. The critical shear rate, and consequently platelet activation, are not attained for Reynolds numbers below 100. For a Re of 190, platelet activation is localized around the bifurcation apex, where the wall shear rate has its peak. Increasing Re to 250, the region of platelet activation expands to encompass a larger zone along the inner walls of the bifurcation as well as a zone upstream of the bifurcation along the walls of the parent vessel.
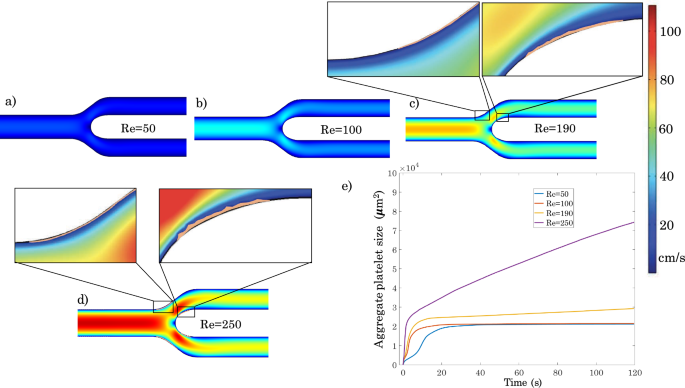
a–d Platelet plug formation after 120 s in the considered bifurcation for different Reynolds numbers ranging from 50 to 250. e Time evolution of platelet plug size in the considered bifurcation for the different values of Reynolds number
Figure 12 depicts platelet plug formation in the bifurcation geometry for different Reynolds numbers. Broadly speaking, two areas of platelet deposition are observed corresponding to zones 1 and 2 in Fig. 10c where the shear gradients are negative. Platelet plug formation is very small for Reynolds numbers below 100. This is due to the fact that for these Reynolds numbers, the threshold for platelet activation is not attained, so that once the portion of the vessel wall characterized by negative shear gradients is saturated with a first layer of resting platelets, platelet plug growth stops because the resting platelets cannot adhere to other platelets. The zoom-in area in Fig. 12 shows the platelet monolayer in area 2. For a Re of 190, platelet plug formation increases along the interior walls downstream of the bifurcation apex. In zone 1 (see Fig. 10c), platelet adhesion is limited to a monolayer because platelet activation occurs only downstream of the bifurcation point. Finally, for Re=250, after 120 s, platelet plug formation starts to be noticeable in both zones 1 and 2, with platelet activation occurring in both the parent artery and the daughter branches.
4 Discussion and conclusions
The present work proposes a two-dimensional computational model capable of predicting platelet plug formation along a blood vessel wall. Relative to other computational models, the principal novelty of the current work lies in accounting for the role of spatial shear gradients in platelet adhesion and aggregation. These gradients have been shown experimentally to be crucial in the thrombogenesis process (Nesbitt et al. 2009). The model also includes the impact of platelet aggregate growth on the blood flow field and how these hemodynamic alterations feed back into platelet plug evolution.
The model predictions were initially validated against experimental data from the literature. The large difference in how the computational results compare to the experimental data depending on whether or not the effect of shear gradients was taken into account confirms the central role that these gradients play in predicting thrombus size and localization. After validation, our computational model was used to study platelet plug formation in specific scenarios of physiological and pathological relevance, namely an idealized stenosed arterial segment and a vascular bifurcation.
In the case of the stenosis model, we investigated the impact of stenosis severity and explored differences in the predictions of the model for the case of a constant velocity vs a constant pressure at the inlet of the simulated vascular segment. For both the cases of constant inlet velocity and constant inlet pressure, a platelet plug is observed to form immediately downstream of the stenosis along both the top and bottom surfaces. This thrombus formation downstream of the a stenosis along both the top and bottom surfaces is in line with in vitro experimental observations (Nesbitt et al. 2009).
For a constant inlet velocity, the model predicts that stenoses up to 60% lead to limited platelet plug formation, whereas an 80% stenosis leads to a considerably larger platelet plug that develops much more rapidly. In contrast, imposing a constant pressure at the inlet leads to a progressive increase in platelet plug size with increasing stenosis severity. These results suggest that the growth of a platelet plug as stenosis severity increases depends critically on the flow environment within the stenosed vessel and on whether or not the stenosis increases the overall hydraulic resistance within the vessel sufficiently to induce a reduction in blood flow rate.
In the case of a vascular bifurcation, the computed shear rate distributions agree with various hemodynamic studies in the literature (White and Frangos 2007; Naplekov et al. 2018). Our model predicts minimal plug formation at Reynolds numbers below 100. At higher Reynolds numbers, platelet plug formation occurs in two distinct areas; along the inner walls of the daughter vessels shortly downstream of the bifurcation point and along the walls of the mother vessel shortly upstream of the bifurcation point. The dynamics of plug formation become considerably faster above a Reynolds number of 250.
As already noted, the principal novelty of the present work lies in the inclusion of the role of negative shear gradients in the process of platelet plug formation. Indeed, the current results confirm that incorporating the effect of shear gradients is critical for accurately predicting thrombus size and localization. In our model formulation, we assumed that platelet aggregation is directly proportional to the axial shear gradient . Evaluating this quantity involves two successive numerical differentiations of the computed velocity field, which is prone to lead to a noisy output signal. To obtain relatively smooth shear gradient results, we used higher order elements in the fluid dynamics discretization, namely P2 elements for velocity and P1 elements for pressure. The resulting increase in the number of degrees of freedom imposed a higher demand on computational resources. Even higher accuracy may be needed if precise determination of the shape of the platelet aggregate is desired.
Concerning the formulation implemented for shear-induced platelet activation, it is relatively simple and does not account for the role of exposure time. One way to improve the model would be to track the exposure time by introducing a variable that is modeled as a passive tracer transported by the flow, as implemented by Menechini and Xu (2016). This approach would allow for the implementation of the mechanical platelet activation rate depending on both exposure time and shear stress (Han et al. 2022).
Nonetheless, the fact that the model succeeded in reproducing the experimentally observed platelet aggregate size and localization in the case of a stenosis provides confidence in its performance and predictive ability.
A platelet plug formation model that accounts for both chemical and mechanical platelet activation and aggregation in complex vascular geometries is computationally very expensive. Consequently, the current version of the model has a number of limitations that need to be addressed in future work.
One notable limitation is that the model is two-dimensional. In light of the fact that thrombosis in vivo often occurs in vessels exhibiting complex three-dimensional geometries, a three-dimensional version of the model would certainly enhance its applicability to real clinical situations. However, a 3D formulation would considerably increase the computational cost. The rate-limiting step in these simulations is the moving mesh formulation for platelet plug growth that leads to a change in the computational domain that depends at each time step on the second derivative in space of the velocity field. As a result, going to a 3D formulation would greatly increase the number of degrees of freedom (DOFs) in the simulations and would therefore lead to an explosion in the RAM memory requirements and computational times. A 3D framework would be more easily implemented by abandoning the moving mesh formulation and tracking thrombus growth through another approach such as representing the thrombus by a local increase in blood viscosity.
A second limitation stems from the fact that fibrin formation and its role in the stabilization of the platelet aggregate was not included in the model. In this regard, it should be noted that thrombotic deposition in arteries and in implantable endovascular devices is characterized by less fibrin involvement than that encountered in low-shear venous thrombosis (Sorensen et al. 1999a).
A third limitation is the fact that thromboembolism was also not taken into account in this work. High shear stress has a dual role on thrombus formation and evolution: on the one hand, it promotes platelet activation, but on the other hand, it induces disaggregation of a platelet plug. In the current model, there is no limit on thrombus growth, so the thrombus will invariably end up occluding the vessel given a sufficiently long period of time. In the perspective of evaluating thrombotic deposition and occlusions, this aspect renders the predictions of the current model quite conservative.
Due to the preliminary nature of the proposed computational approach, the role of von Willebrand factor (vWF) in the thrombogenesis process was not included. However, it is important to note that this large multimeric glycoprotein, present in sub-endothelial extracellular matrix and blood plasma, has an important role in mediating adhesive interactions of platelets exposed to rapid blood flow. vWF promotes platelet adhesion and aggregation at shear rates higher than 2000 (Ruggeri 2007). The current framework lends itself to the integration of the role of vWF in platelet adhesion, for instance by increasing the rate constants for platelet adhesion, and , in equations (17) and (18) in the zones of high shear rate. Additionally, vWF in the bulk flow can be modeled by introducing it as a biochemical species in the coupled set of convection-diffusion–reaction equations on which the model is based and implementing its role in promoting platelet aggregation in high shear rate environments.
Finally, blood in the current formulation is assumed to behave as a Newtonian fluid. In general, this assumption is largely valid for arterial flow. However, in the case of highly irregular arterial geometries such as stenoses, there may be local zones, particularly regions of flow separation and recirculation, where the shear rates are sufficiently low for non-Newtonian effects to be important. Choi and Barakat (2005) investigated the impact of the non-Newtonian behavior of blood for the case of flow over a backward facing step and reported that spatial gradients of shear stress tend to be larger for a non-Newtonian fluid. In this perspective, our model may tend to underestimate thrombotic deposition.
Despite its simplicity and its limitations, the present work represents an important attempt to couple different key aspects of the thrombus formation and evolution process: chemically- and mechanically-induced platelet activation and aggregation and the influence of platelet plug growth on both the blood flow field and thrombus evolution. The model constitutes an initial effort in the creation of a tool in helping to predict thrombotic deposition in the cardiovascular system, most notably in important pathological situations involving blood flow disturbance including aneurysms, stenoses due to advanced atherosclerotic disease, and implantable endovascular devices such as stents, grafts, and valves.