Article Content
1 Introduction
Dementia, a progressive neurodegenerative disease typically associated with memory loss and diminished ability to perform daily tasks independently, is the leading cause for disability and dependency among older demographics globally (GBD, 2019 Dementia Forecasting Collaborators, 2022). At its core, dementia challenges the essence of personal identity and autonomy which results in difficulties maintaining pre-dementia lifestyle (Fuchs, 2020). As a result, living with dementia will have major implications on a person’s ability to maintain the same quality of life due to psychological, physical, sensory, and overall cognitive decline (Akpınar Söylemez et al., 2020). Considering these unique requirements, dementia-friendly architecture is explored in the literature to provide guidelines for spatial designers to create spaces that enhances the quality of life for the end-user.
Dementia introduces distinct challenges, encompassing sensory impairments in vision, hearing, sight, smell, and spatial awareness, characterized by an “impaired identification of incoming stimuli (perceptual deficits), resulting in distorted perceptions” (van Hoof et al., 2010); therefore, it necessitates a thorough understanding on how space support high quality of life. In the context of residential care facilities, personal autonomy, the ability to exert a level of control performing daily activities with some degree of independence, can be realized by preserving the end-user’s existing habits and values which allows them to cope better with symptoms of dementia (Serbser-Koal et al., 2024). The preservation of one’s personal habits and values also increases quality of life by feeling more at home at a residential care facility (Rijnaard et al., 2016).
The design of layouts in residential care facilities can affect the degree of independence that people affected by dementia can maintain. Layouts designed without considering the special needs of people affected by dementia can hinder the ability to independently navigate indoor environments and becomes a barrier to preserving personal autonomy. Human navigation includes the cognitive decision process about where to go (wayfinding) and the capacity to physically move across spaces and obstacles (locomotion) (Kuliga et al., 2021). Wayfinding in dementia context is defined as the ability to know one’s position in space, while knowing the destination, planning, and following the best route towards it, recognizing the destination upon arrival, and finding the way back (Marquardt, 2011). The neurodegeneration that develops in persons affected by dementia often causes cognitive impairments that increase challenges in wayfinding. This includes difficulties with path integration (thus, reduced awareness about own position, speed and trajectory) and cognitive mapping (thus, mental capacity of representing space) (Kuliga et al., 2021).
Occupants who are affected by Alzheimer also have more difficulties to accurately identify relevant visual information to perform a cognitive task than those without Alzheimer (Foldi et al., 2005). Besides the risk of getting lost, challenges in wayfinding imply also emotional consequences, such as anxiety. Limited spatial orientation can affect behavioural, emotional, and social reactions of occupant who suffer from Alzheimer (Kleibusch, 2018). The physical environment can support wayfinding abilities of people living with dementia while reducing confusion and agitation (Marquardt & Schmieg, 2009; van Buuren & Mohammadi, 2022).
One of the main principles to facilitating a greater degree of independence for people affected by dementia is adhering to the Dementia Design Principle (DDP) allowing people to see and be seen (Chen et al., 2023; Lee, 2003). Clear sightlines in the building layout factors with the largest effect on autonomy for persons with dementia in hospitals (Kirch & Marquardt., 2023). Visual sightlines are vital because they can compensate cognitive limitations connected to mental representation of spatial situations that the end-user cannot directly see. Therefore, key relevant spaces to daily activities should allow for sufficient visual access (Marquardt, 2011). Also, seeing amenities can facilitate certain activities that contribute to positive experiences of people who suffer from dementia (Hammink et al., 2024). This principle closely relates with building layouts and can be measured by direct lines of sight, known as visual access.
The state-of-the-art research and practice provide several design guidelines and references expanding on our understanding on how the physical environment creates dementia-inclusive spaces, and an evaluation framework using various assessment indicators and tools. For example, how much a certain space facilitates or challenges wayfinding has been assessed by considering the presence or absence of certain factors, such as recognisable tactile or acoustic stimuli (Fleming et al., 2017; Kuliga et al., 2021). Several studies on dementia have shown that architectural design can facilitate or challenge wayfinding based on spatial arrangements, circulation spaces and visual connections (Marquardt & Schmieg, 2009; van Buuren et al., 2025).
Besides design guidelines, the state-of-the-art research and practice also offer an increasingly vast and reliable range of computational methods and related tools that can support designers and decision makers to implement the guidelines. ML support tools, for instance, enable early-stage validation by analyzing spatial configurations and predicting compliance with dementia-friendly design principles. These tools streamline iteration and enhance decision-making by offering data-driven insights into key outcomes such as personal autonomy and social integration.
The state-of-the-art research and practice provide several design guidelines on visual access and other principles. Computational methods that are potentially useful as decision-making tools during the early stages of design, are well developed. However, the evaluation frameworks of dementia-friendly design face also current gaps. When focusing on visual access, quantification methods are missing. With respect to quantification, the state-of-the-art lacks a consistent measurement scheme for visual access data in terms of how the information is captured and how they relate to the evaluation of spatial quality. Moreover, the potential of Machine Learning (ML) methods remains vastly unexploited. There is an absence of ML tools and computational frameworks that bridge qualitative user experiences in dementia care with quantitative, data-driven methods. Such tools can fill in a critical gap in architectural decision-support systems during the early design stages.
This study proposes a novel ML-based framework to assist in decision-making during the early stages of design with providing feedback on floor layouts in relation to DDP compliance when such information is difficult or not possible to obtain due to time constraints or limited expertise on dementia-friendly design principles during those stages. Floor plan representations are commonly utilized in early-stage ideation; therefore, it is the means of representation selected for this study. The intended ML assessment model works by entering (spatial) feature inputs derived from floor plan geometry information to provide feedback on the extent of compliance with the DDPs of interest, allowing designers to iterate and compare design options prior to the expert validation stage. The focus is on the DDPs that can be quantified using visual access, an indicator for environments that promote easier wayfinding skills for people living with dementia that leads to higher degree of independence. More specifically, this study focuses on a proof-of-concept computational tool to evaluate the floor plan quality by analyzing geometry features of a floor layout and produce a score representing the degree of compliance with certain DDP criteria. The purpose of the proof-of-concept computational tool is to identify optimal and suboptimal layouts. Ultimately, the aim of the study is to define the scope of the dataset requirements for the development of a ML assessment framework on the DDP provisions that have a high impact on the quality of spaces. A proof-of-concept ML model on a limited set of DDP criteria is included in the study.
A computational framework for the quantification of visual access data is proposed for the purpose of scoring and ranking layouts based on numeric metrics to fill in the discovered gap found in the literature relating to consistent measurement scheme. Measuring clear lines of sight can give an indication of how spaces are visually connected. A methodical approach to assess visual access can relieve the burden for the evaluator of decision on position(s) in the floor plan that are critical to measure, thereby mitigating the element of subjectivity in the assessment. Some key locations can be considered where clear lines of sights are critical to establish, but due to the evolving information from early design stages to developed designs, it is difficult to conclude with high degree of certainty where the key locations are in a given space or based on a furniture layout that may change over the lifespan of a building. Deciding on when a clear line of sight is considered acceptable could be defined in terms of range and field of view. Current literature does not provide specific information on these aspects. Therefore, the proposed quantification scheme ensures the reproducibility of the assessment, while introducing a consistent data metric that best represents the perceived visual access quality (VAQ).
This paper is structured as following. After this introduction section, Sect. 2 highlights the state-of-the-art for environmental assessment of dementia-friendly spaces and for related computational methods. Section 3 presents the research methodology followed during this research. Section 4 presents the work developed during the research, with focus on the quantification of visual access and on the ML model framework to support design decision-making. Section 5 shows the results and discussions. Finally ending in Sect. 6 with concluding remarks and recommendations.
2 Background studies
2.1 Environmental assessment of dementia-friendly spaces
Previous studies highlighted the factors in physical environments supporting independence and higher quality of life for people affected by dementia. This culminated in several assessment tools, one of them being the Environmental Assessment Tool (EAT) by Fleming which enables the quantification for the quality of the built environment to accommodate people living with dementia in homelike care facilities (Fleming, 2011). The assessment tools were further expanded upon, resulting in the Environmental Assessment Tool Handbook (Fleming & Bennett, 2021) introducing a systematic way to evaluating care facilities with respect to 10 DDPs. The EAT includes an assessment model that can provide additional actionable insights for the evaluator towards improving care facilities. Recently the EAT was adapted for evaluating floor plans, called the Plan-EAT (Quirke et al., 2021) demonstrating an evidence-based approach for assessing spatial quality using floor plan information for evaluating existing facilities, but also in the design proposal phase as a means for design validation.
The third EAT principle of allow people to see and be seen touches on the ability to clearly see the surrounding environment which can be measured by visual access metrics. This DDP allows end-users to make decisions, based on the received visual information, on where they want to go. This boosts the confidence of end-users to explore their own environments independently with the added benefit of increased opportunities for spontaneous social interaction between residents including caregivers (Fleming & Bennett, 2021). In the EAT evaluation scheme, visual access is assessed by comparing direct visual sightlines between most frequented spaces such as living to kitchen, living to dining, dining to toilet, and so on. Direct sightlines between key spaces improves recognition of adjacent rooms and might lead users to occupy spaces that might otherwise not have remembered, thereby increasing their use and facilitate wayfinding (Passini et al., 2000). This improved recognition and facilitated wayfinding is particularly critical because dementia commonly affects the ability to recall spatial layouts or plan routes. Seeing the destination directly reduces the cognitive load associated with navigation.
Several studies regarding dementia correlate direct visual connection with facilitated wayfinding. Largely, they ground on the principle that visual access of a destination increases chances one can reach the destination (Marquardt, 2011; van Buuren & Mohammadi, 2022). Recent research using eye-tracking technology highlights that individuals with mild cognitive impairment may rely on different visual cues for wayfinding compared to cognitively healthy older adults. Specifically, cognitively healthy older adults tend to focus more on identifying informative signs, while others with mild cognitive decline prioritize directional signs and architectural features, suggesting these elements may be particularly impactful for navigation support in this population (Ghamari & Golshany, 2025). The use of visible architectural features, such as plants or decorative objects, serves as mental landmark to support successful wayfinding for users affected by dementia (Faith et al., 2015).
Visually salient landmarks suggest to support route-following and functional independence for users affected by dementia (Carton et al., 2024; Davis et al., 2016). Navigation is based on two principal systems: path integration and landmark-based navigation (Zhao & Warren, 2015). Path integration is the process of updating information on one’s movement while keeping track of position and orientation during travel, whereas landmark-based navigation relies on mental landmark and other environmental cues for orientation and wayfinding (Wiener & Pazzaglia, 2021). The visually-differentiated environments creates more landmarks which influences perceived complexity and supports landmark-based navigation in combination with visual cues (De Cock et al., 2021). A study states “Visual access to destinations while within corridors is now a core feature of dementia-friendly designs” (Carton et al., 2024).
Quantifying the effects of visual access on user experience is a topic explored in the literature. A study examining 3 care facilities in Australia tackled visual connection by utilizing the isovist method developed by Clifford Tandy in 1967 which was later expanded on as an analytical method for quantitative description of space (Benedikt, 1979). Isovists were used as a measure taken from the domestic kitchen of the 3 care facilities to rank the designs from good, better, and best to quantify visual connection (Chau et al., 2018). Visual access is also relevant for social interaction. Ferdous and Moore (2014) employed quantitative methods like visibility graph analysis, derived from space syntax, to measure spatial configurations, including visibility and accessibility within care environments for people living with dementia. Their findings on visual access extends beyond wayfinding, citing that the degree of visibility has direct influence on social dynamics, and did not confirm space syntax hypothesis that spatial layout with high visibility increased social interaction (Ferdous & Moore, 2014). These studies underscore the interplay between quantitative visual access metrics and user experience. They provide a deeper understanding of how visual access influences user behaviour in residential care settings to inform evidence-based quantitative assessment frameworks and design guidelines.
A set of design criteria for design typologies supporting wayfinding is further investigated in a recent paper outlining direct measurement criteria with corresponding weights and possible scores for design evaluation (van Buuren & Mohammadi, 2022). Several design criteria relating to spatial orientation are included, ranging from spatial hierarchy, visual access, length of routes, shape of corridor, moments of decisions along a route, daylight, and position of doors along the corridor. The evaluation scheme is designed to improve spatial orientation and wayfinding skills for people affected by dementia, assessed qualitatively resulting to possible scores ranging from bad, neutral, good, very good, excellent, and a few others quantitatively such as length of route, number of decision points and doors along a corridor. The study tackles visual connections for example between the entrance hall and the living room, the living room and the corridor, the door of the sanitary room from the bed in the individual room.
A qualitative observational study highlights the role of visual connection in supporting habitual activities (Chen et al., 2023). The study observed how spatial layouts with clear sightlines between frequently used spaces facilitated autonomy and spontaneous interactions. Strategic placement of furniture and activity spaces was found to encourage both nonverbal and verbal interactions between residents and caregivers, fostering a sense of community and enhancing the homelike atmosphere. Views from within and out of the building through the use of internal glazed screens and windows has been shown to offer assistance in wayfinding as a result of improve visual connection allowing users to see a room or garden without going in (Faith et al., 2015).
Visual access have additional benefits to care staff members to facilitate monitoring and supervision of spaces in long-term care facilities (Faith et al., 2015). A recent study published survey results from caregivers of older adults affected by dementia to better understand the end-user’s wayfinding experience in relation to 22 design elements found from the literature related to wayfinding (Alam & Kim, 2023). The caregivers highlighted the importance of visual connection between residents and caregivers which can help them respond more effectively when an older adult is lost in their way. The survey results from caregivers show visibility as among the most important, and the satisfaction of wayfinding design element. Visibility increases the satisfaction of caregivers but also has been shown to improve wayfinding skills of older adults.
Visual connection is not the only factor affecting wayfinding. Other factors include for example proportions and dimensions of spaces, where some studies highlight small spaces may facilitate wayfinding possibly in relation to feelings of safety and facilitate social interaction (Leung et al., 2024; Marquardt, 2011). The exact effect of visual connection is also yet to be fully understood, where some study report the emergence of conflicting information. This includes observations on wayfinding behaviours that suggest increased confusion and decreased social interaction in places with high visibility (Ferdous & Moore, 2014; van Buuren et al., 2025). Finally, a point of attention is the difference between physical and cognitive perception, where physical visibility may not suffice to guarantee understanding and location awareness. Despite the complexity and interrelations, and despite there are still knowledge gaps and limited understanding, visual connection is acknowledged beneficial for a relevant range of cases. As such, it also increasingly analysed via several methods.
2.2 Computational methods and machine learning models
Several computational methods have been developed to quantify visual connection. Visibility-based analysis applies to various scales of the built environment and uses various techniques. Visibility graphs and isovist are among the most established ones. Visibility graphs record relationships of mutual visibility in a space and enable further analysis (Azizi & Sulaimany, 2024). Recent examples of applications in the built environment include outdoor paths (Omrani Azizabad et al., 2024), indoors of multi-story buildings (Zhou et al., 2022); commercial spaces (Ayesha et al., 2023). Isovist of a point is defined as all points visible from it (Davis & Benedikt, 1979). Its origins dates back to the late seventies (Benedikt, 1979) and its applications in the built environment includes recent examples on residential buildings (Parhizkari et al., 2023; Esfandiari et al., 2020) traditional gardens (Chen et al., 2024), indoor localisation (Triantafyllou et al., 2024), among others. With regard to spatial quality in nursing homes, a study (Wei & Li, 2021) on a computational model to quantify visual environmental properties of bedrooms in care-facilities for the elderly outstands among recent works. The study uses viewing distance, viewing angle, and viewing field as variables of the computational model.
Among the computational techniques employed to model visual properties and specifically visual connection, Machine Learning (ML) techniques are emerging rapidly. ML are computer systems capable of learning from past examples and can make predictions based on the patterns observed in the training data (Sedlmeier & Feld, 2018). The ML method can be exploited to learn from recurring patterns found in floor plan geometry to classify designs according to their spatial qualities derived from visual access data. There are several ML algorithms and categories. Supervised learning algorithms learn a function based on a given pair of inputs and corresponding unknown output label to solve regression or classification problems (Sedlmeier & Feld, 2018). The algorithm extracts hidden relationships between target variables and find the coefficient function based on the related problem. It tests for the accuracy of its correctness on the training data (Alloghani et al., 2020). A few of the most common classification algorithms include decision trees, random forests, and support vector machine (Ross et al., 2023). Random forest (RF) classifier is a statistical ML algorithm for prediction (Breiman, 2001) based on a collection of decision trees involving recursive partitioning of data into two groups, that stops once the predetermined condition is met (Schonlau & Zou, 2020). RF classifiers can give insights on the important features in the model as exhibited in a study examining conditions influencing patient satisfaction in a hospital setting with respect to indoor environmental quality measures (Ali et al., 2022).
One of the key Artificial Intelligence (AI) support tools for early design ideation is demonstrated by Foster + Partners to support the decision-making process for optimal workplace layouts (Tarabishy et al., 2020). In this work the ML model is a surrogate model. It can identify spatial and visual connectivity potential of a space by visualizing it on an image representing floor layouts overlaid with a visual or spatial connectivity heatmap. The dataset contains 6000 floor plan images of 100 × 100 pixels generated from Grasshopper where each pixel represents 1 square meter. The plans are analyzed using both visual and spatial connectivity with Dijkstra’s algorithm to find average shortest path between every other location according to visibility graph analysis techniques described in Turner et al.’s article (2001). The end-product gives designers the ability to iterate designs in the early stages by producing heatmap visualizations to make decisions on the layout of workspaces based on visual and spatial connectivity that would otherwise be both time and computationally expensive to simulate for each design option especially when considering the resolution of the isovist and the sizes of floor plans.
In recent studies, the combination of ML and isovists is also explored as means to describe spatial data numerically. Spatial quality data can be used to predict a certain aspect of architectural experience. ML models were studied to classify to explore the relationship between geometry and spatial awareness, by classification of spaces through their isovist properties (Ferrando, 2018). The data was acquired from a database of vernacular French farmhouses to train a model on predicting levels of privacy according to its isovist features.
Capturing spatial quality based on the principles of isovist is also shown to have potential in generative AI models. ML frameworks using spatial encoder, latent semantics, and generative isovist transformer, fill in the missing modality of spatiality in the ML and AI approach in architectural design (Johanes, 2024). The methodology of Johanes and Huang (2022) can be summarized in 4 steps: isovist sampling on dataset of floor plans, generative adversarial networks (GAN) training and inversion, latent space interpretation, and architectural decoding (Johanes & Huang, 2022). This allows for the evaluation of design qualities according to their isovist signature by comparing latent space for regularity, the degree of similarity between isovist signature in the latent space, and uniqueness, i.e. the degree of difference to other isovist signature in the latent space. The present study highlights the potential of neural networks as means for architectural representation based on isovist signatures for analyzing and generating designs.
3 Research methodology
The literature review on existing studies addressing dementia-friendly design criteria, AI support tools, and ML methods highlights the potentials of AI-augmented design and yet the lack of computational support in early design stages for dementia care facilities. With focus on visual connection, the aim of this study is to investigate the feasibility of a ML model for early-stage assessment that can use features of floor plan geometry to produce feedback on DDP compliance. The study was organized in multiple phases. First, the role of visual connection was framed, as one of the key soft design criteria in DDP compliance. The most important soft criteria to measure in the early stages of design include personal autonomy and sense of connection, which are influenced early on based on the floor layout scheme. To support the important decisions made in the early design process and their relation with soft design criteria, various quantification methods were considered. The choice of the techniques used in this study took into account the possibility to further implement a more holistic AI-augmented support to later extend the assessment beyond visual connection only. Another important criterion included the opportunity for designers to work directly with visual representations of floor plans. Thus, the methodology included measuring visual access data on a dataset of floor plans (Alsaggaf, 2024). To develop the proposed workflow, an existing dataset of floor plans was used. The dataset includes a variety of residential floor plans not of dementia care facilities but rather of standard dwelling to allow higher availability of data at this stage. The dataset is extracted from the Swiss Dwellings Dataset v3.0.0Footnote1 (Standfest et al., 2022). The full Swiss Dwellings dataset is publicly available on Zenodo, an open-source library of datasets containing detailed building information data on over 42 thousand apartments, nearly a total of 242 thousand rooms in over 3000 buildings. Working on this dataset, the first step was assigning quality labels based on visual access metrics on a small selection of the data. Then, the data for building geometry, visual access, and simulation features were combined into a dataset.Footnote2 The assembled dataset is then imported in a new Jupyter Notebook using Python ML libraries to prepare the data including ML model settings, feature selection, and evaluation metrics (see Fig. 1 for the workflow of ML model). This methodology allows for isovist sampling on floor plan data and selecting features to evaluate ML performance.
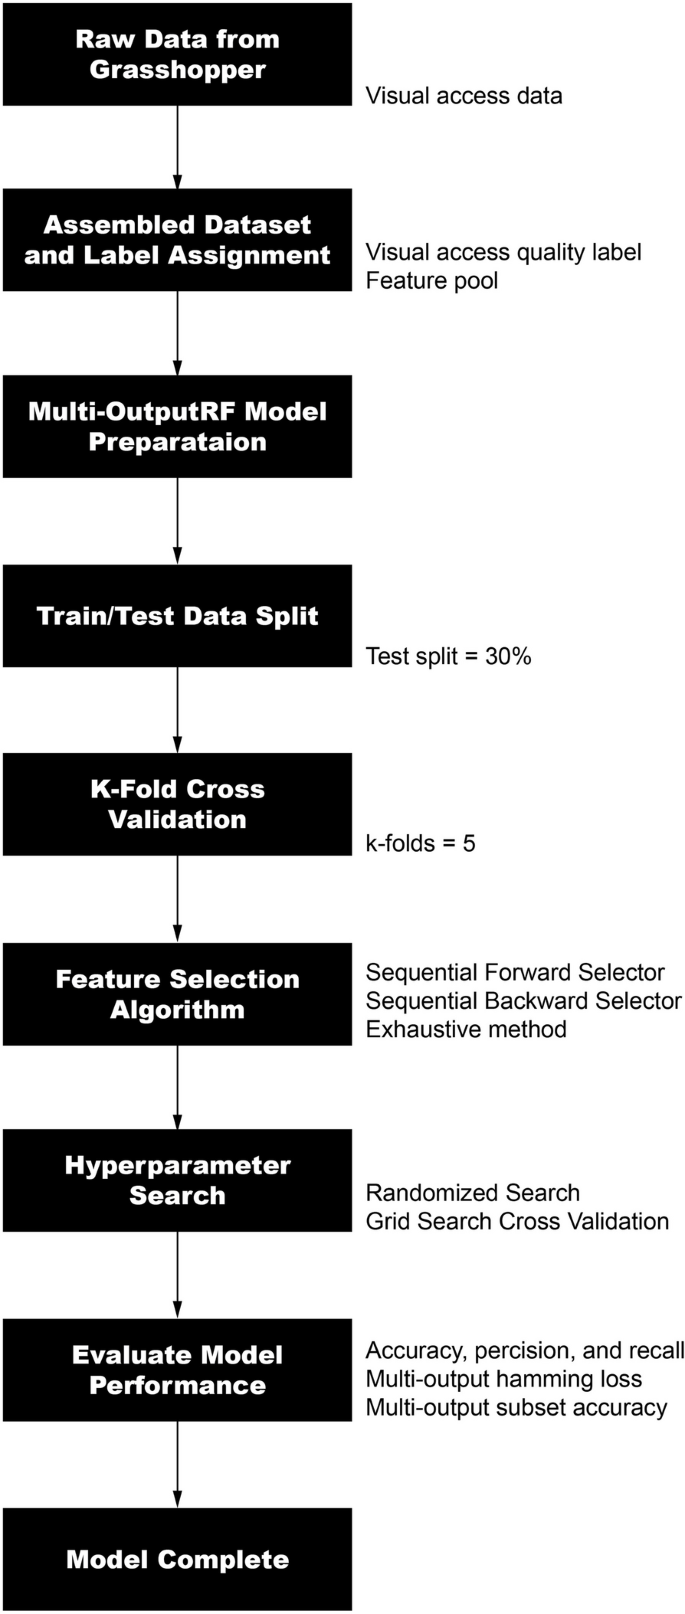
The ML workflow of this study
4 Computational framework to assess visual access
The allow to see and be seen DDP provides a range of benefits for people affected by dementia, namely it can contribute to higher degree of independence and encourage spontaneous interaction (Fleming & Bennett, 2021). Within the EAT evaluation framework across all the DDP categories, the total possible points related to visual sightlines add up to 33 points out of 112, a significant 29.5% of the final score’s weight, signifying the importance of visual access for dementia-inclusive design. Direct visual sightlines are measured using the isovist method. Using this visual access metric, the spatial experience can be quantified and then be used in the formal assessment of visual access using numeric values.
4.1 Measuring visual access with isovists
A numeric approach to measuring floor plan’s visual access is done by drawing direct lines between two different spaces. This is done using the isovist method, the area visible from a vantage point (Benedikt, 1979) which is best suited for describing perception of space. A field of isovists populated in space can give an indication on visual access taken from multiple vantage points in a room, providing consistent and more granular assessment for how subtle changes in layout might affect visual access criteria.
The living room, or broadly the common lounge area, was chosen as the primary room function to collect visual access in the scope of this study because of its importance in maintaining visual access to 7 key spaces: direct sightlines from lounge to dining, kitchen, garden, corridor, toilets, staff supervision point, and bedroom doors, see Fig. 2 (Fleming & Bennett, 2021; Quirke et al., 2021; van Buuren & Mohammadi, 2022).
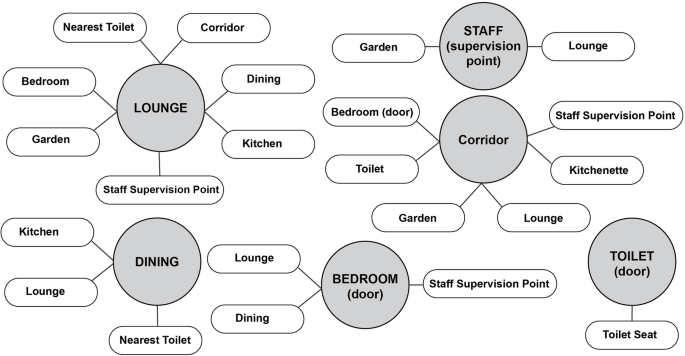
Direct lines of sight queries mentioned in assessment schemes (Fleming & Bennett, 2021; Quirke et al., 2021; van Buuren & Mohammadi, 2022)
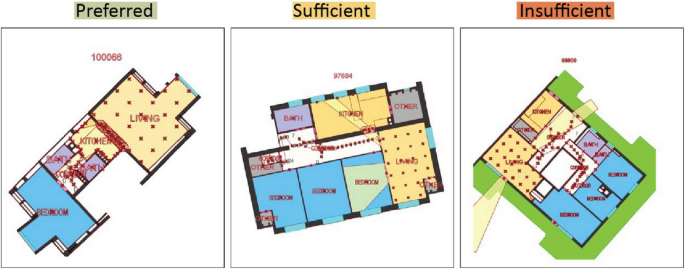
The measurement for visual access is conducted by applying an isovist field in the living space and then checking for direct lines of sights from all possible positions in the room. The test grid resolution is adjustable and can be set to 1-m apart from the wall and between each test point to approximate a human-scale grid (Turner et al., 2001). Each vertex from the living room will radially generate a pre-determined number of isovists and checks if intersections are made between the living room and other spaces, returning a true or false value for each point, respectively “seen” or “not seen”. The percentage of ‘satisfactory’ isovists is calculated to determine the visual access quality (VAQ) score; whether insufficient, where not many points maintain visual access, sufficient, where some points satisfy visual access, and preferred, most points satisfy visual access. The precise threshold on when the requirements are satisfied for visual access leading to improved personal autonomy and improved wayfinding is not mentioned in the literature which warrants further investigation to understand the relationship between visual access and the wayfinding skills of people affected by dementia. For this study, the thresholds set in Fig. 3 was selected in order to produce a balanced dataset from poor to good sample layouts for the ML training step.
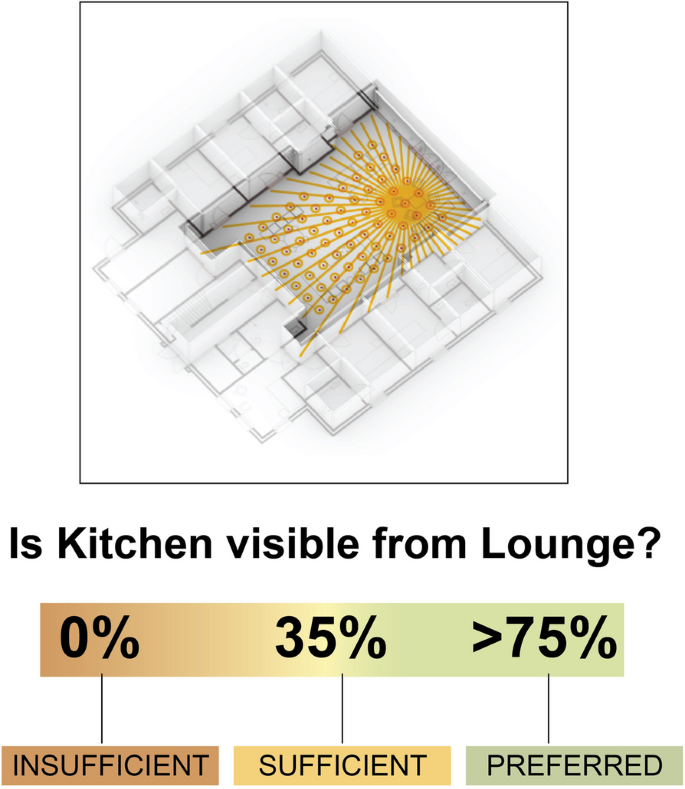
Visual access quality (VAQ) scores
Additional quality checks
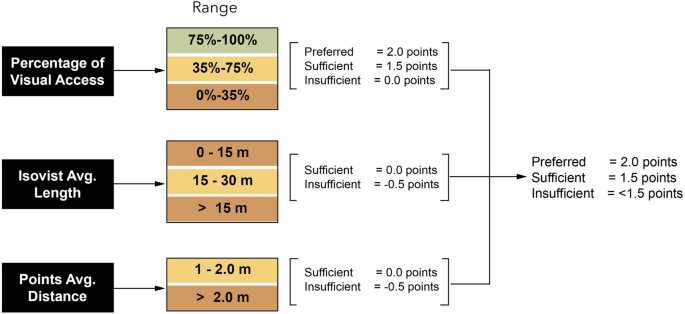
Additional checks can also be considered relating to the direct lines of sight maintained in a room such as the distance of the sight line and extent of blind spots where visual access suffers in comparison to the rest of the space (see Fig. 4). The sight line distance is averaged to a single value and the average distance between closest satisfactory test point is the indicator for fragmented visual access within the space.
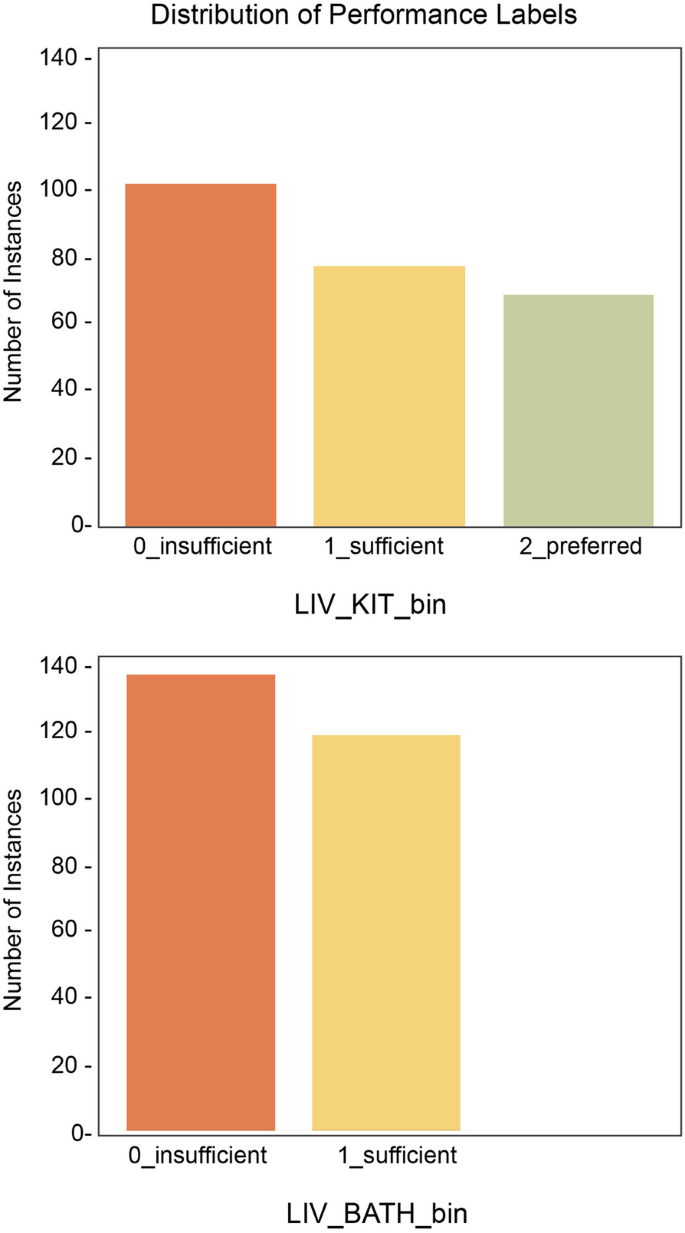
Distribution of the VAQ labels
The threshold scale yielded a balanced distribution of labels on the floor plan training set that measured direct lines of sight between living to kitchen. In the case of nearest toilet visibility, any satisfactory sightline to the nearest toilet is labelled as sufficient, yielding even results (see Fig. 5). The selected thresholds are a result of the limitation of the dataset, ultimately these thresholds should be determined based on user testing to better describe the nuance relationship between changes in visual access and perceived user experience.
4.2 Generating visual access data
The original Swiss Dwellings Dataset v3.0.0 (Standfest et al., 2022) was filtered using Python and Pandas library. First, selecting only single-story apartments by counting the unique floor_id values and matching it to unit_id to make a selection of units existing only on one floor. Then, a subsequent selection is made to choose units containing both “living”, “corridor”, and “kitchen” as entity_subtype which indicates that kitchens have a defined zone. Then, a selection was made to allow for dwellings that have more than 3-bedroom entity_subtype to corresponding unit_id to exclude studios and small apartments yielding to 500 unique apartment_id. The duplicate layouts were removed through a manual filtering process, adding up to 256 dwellings in the end. This subset of floor plans was imported into Grasshopper and automatically generates the visual access data. The Grasshopper script populates entity_subtype = LIVING with the isovist field, checks for intersections made with kitchen and toilets, records the number of isovists with intersections, and calculates the percentage of points satisfying direct line of sight condition.
In the scope of this study, direct lines of sight from the living room to the kitchen and nearest toilet were recorded. The raw isovist data was processed in Python to assign the class of the VAQ for one of the three possible scores: insufficient, sufficient, and preferred. Subsequently, the assigned classes model was combined with a list of spatial features from the simulations file, resulting in a dataset containing building information, visual access data, and spatial features.
The final data output included two visual access metrics: living to kitchen with three possible outcomes, and living to nearest toilet with two possible outcomes.
4.3 Model and feature selection
The features from the simulations file were approximately 360 features related to sun, noise, views to outside, area features, geometry features, area adjacencies, and connectivity (see Table 1 for actions taken in the filtering steps). Sun, noise, and views to outside features were removed as the focus of this study did not include climate or noise factors. Given that the study aims to predict visual access quality—a direct consequence of spatial layout—features related to geometry, area, and spatial topology were prioritized, while environmental factors like sun, noise, and views were excluded in this initial phase to isolate the impact of the layout itself. This resulted in reduction from the initial feature pool of roughly 360 features down to 70 unique spatial features (see Fig. 6). The remaining features with weak correlations were removed upon inspecting histogram and scatter plots at an exploratory analysis step. Features with visible correlations to each label output were prioritized for the feature subset (example shown in Fig. 7). Some features are described in multiple numeric representation that convey one concept such as connectivity_eigen_centrality which included statistical mean, min, max, standard deviation, median, 20 th percentile, and 80 th percentile. Only the 20 th and 80 th percentile values were taken in to reduce computational cost leading to the final 18 feature subset.
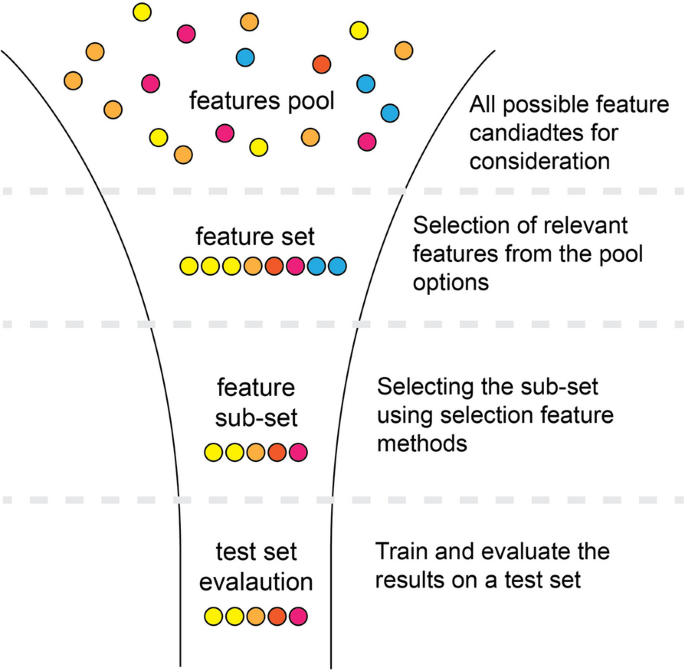
Feature pool to feature subset filtering steps
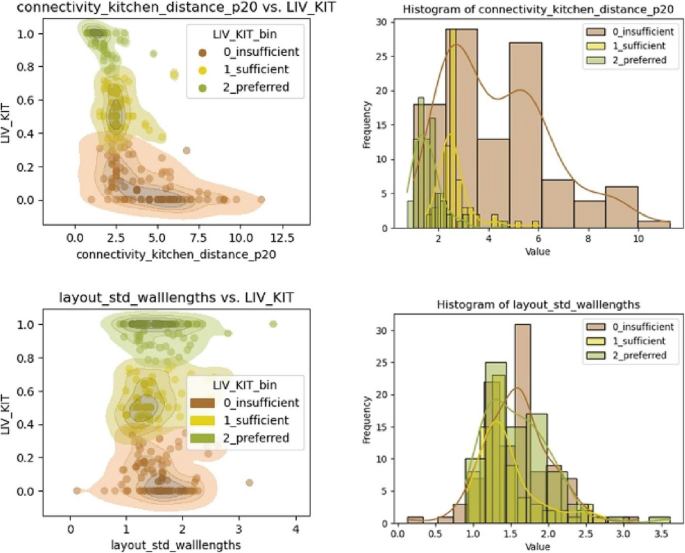
Example of exploratory data analysis plots. (left) scatter plot with KDE contours; (right) histogram distribution
The final feature subset for consideration included spatial features such as compactness, which expresses the relationship between area and perimeter relative to a circle (Schneider & Koenig, 2012), eigen centrality, a measure of the influence of a node in the network (Agryzkov et al., 2019), betweenness centrality, expresses the extent to which a node lies on the shortest paths between other nodes in the network (Xiaohuan et al., 2022), and closeness centrality, expresses how close the node is to all other nodes in the network (Zhang et al., 2024). Other features included layout wall lengths, layout perimeter, distance to entrance door, and distances to different spaces measured from the living room.
A wrapper-based feature selection was implemented on a feature set to define the optimal feature subset according to the highest subset accuracy performance. This method is based on the ‘greedy/exhaustive search method’ because it considers every feature set selection possibility with respect to the evaluation criteria using a pre-determined classifier such as random forests (Balogun et al., 2020). Although it provides a thorough search, it is computationally expensive and was only tested on a small subset of features. Forward and backward sequential feature selection is less computationally expensive and was used by evaluating the subset accuracy of the model by sequentially adding or removing one feature at a time.
The RF classifier learning algorithm was used in the feature selection process to predict VAQ based on the features subset. The model was built to take multiple inputs, called features, and produce two multiclass classification outputs, the VAQ label. The model’s hyperparameters were selected using a pre-defined range of hyperparameters by executing a GridSearchCV on the selected feature subset. The dataset was split into 70% training (179 dwellings) and 30% testing (77 dwellings). A fivefold cross-validation was applied to the training data during feature selection, hyperparameter grid search, and model evaluation to mitigate overfitting issues due to the limited data size.
4.4 Model evaluation metrics
The model is evaluated using confusion matrix, accuracy (1), precision (2), recall (3), and F1 score (4) metrics to give an idea of the performance of the model on an individual class. Accuracy describes the overall accuracy of correct prediction whereas precision focuses on the proportions of positive predictions which are correct. F1 score is a single metric value representing the harmonic mean of precision and recall (Abhishek & Abdelaziz, 2023). The confusion matrix breaks down the model’s predictions into true positives, true negatives, false positives, and false negatives for classification output, offering a more granular understanding of where the model succeeds and fails compared to overall accuracy.
ML evaluation metrics for feature selection
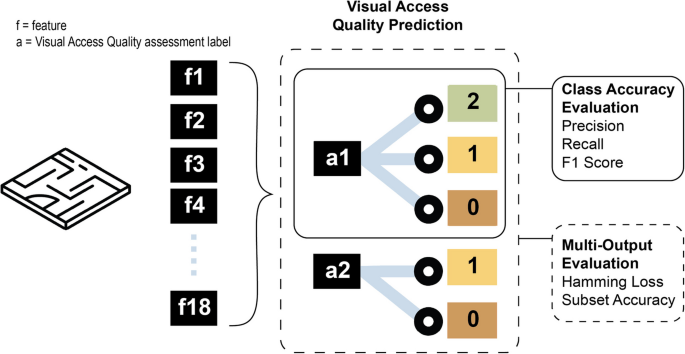
The model utilizes the multi-output classification—the key distinction from the single-output counterpart is that the model takes a set of features to classify instances into two or more labels that measure different concepts and solved concurrently, whereas single output produces a single-output prediction (Linusson, 2013). The model is evaluated using subset accuracy (5) and hamming loss (6) metrics providing an indication on how the model is overall performing with respect to multiple outputs (see overall model evaluation scheme in Fig. 8). The subset accuracy is a strict metric where it captures the percentage of instances where the model accurately predicted all class outputs (Jamthikar et al., 2022; Romeo et al., 2021). In evaluating VAQ, it is important to minimize the false positives where the subset accuracy can provide a metric on this. Hamming loss, on the other hand, is the less stringent criteria measuring the fraction of incorrectly predicted labels by the model (Yang et al., 2020).
where:
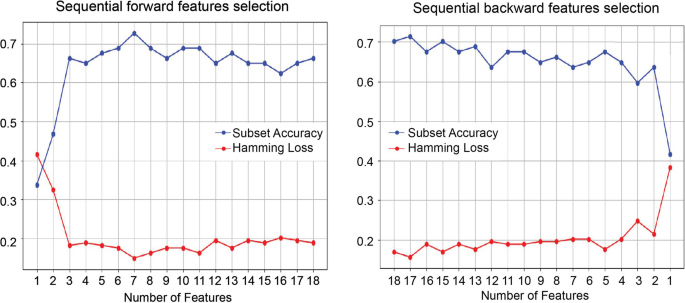
Forward and backward sequential feature selection
: true positives.
: true negatives.
: false positives.
: false negatives
where:
: total number of samples in the dataset.
: the true label set for i-th sample.
: predicted label set of the i-th sample.
: the total number of labels in the multi-label problem.
: symmetric difference between predicted and true labels.
5 Results and discussion
Topological features derived from building geometry correlate with two visual access quality labels measured using isovist fields as the basis of the quality label. The ML model shows reasonable accuracy on an individual class, exceeding 80% for both outputs, and 70–80% when combined as multi-input, multi-output model. The feature subset chosen using forward sequential feature selection included in no particular order: (1) layout compactness, (2) layout door perimeter, (3) layout number of doors, (4) connectivity-bathroom-distance-P20, (5) connectivity-kitchen-distance-P20, (6) connectivity-kitchen-distance-P80, (7) layout biggest rectangle-width which are the results of the forward sequential feature selector (Fig. 9).
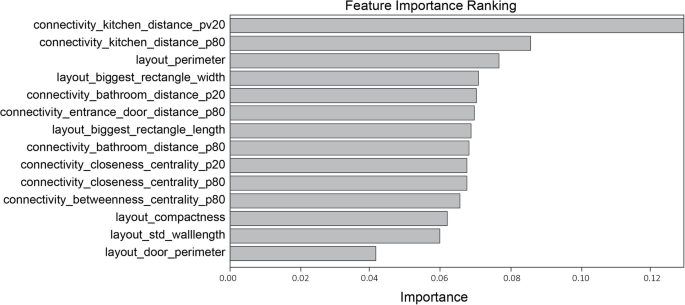
Importance ranking for multi-output RF model
5.1 Feature subset
The topological features correlating to VAQ labels show that the model can relate the quality labels to building geometry features (see Fig. 10). The connectivity features are among the best indicators for visual access quality between living to kitchen, followed by layout geometry features.
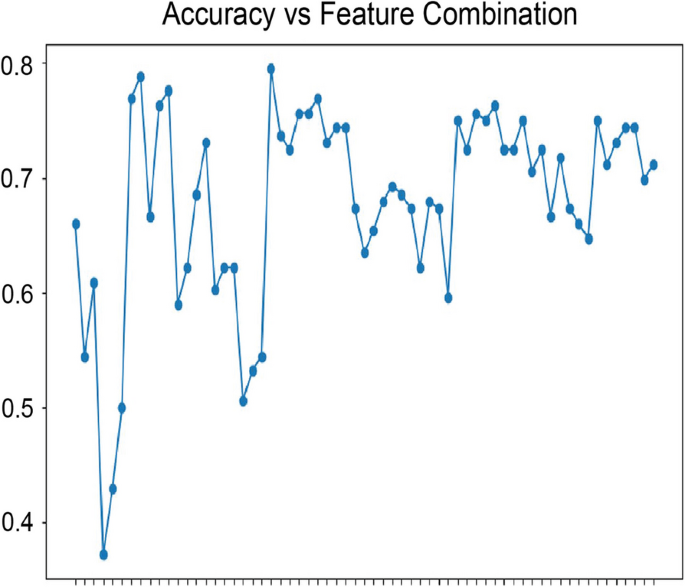
Exhaustive search on limited subset of features
The feature selection was optimized for subset accuracy where the model iterates through different feature-set combinations and favors the feature subset resulting into highest subset accuracy score. An exhaustive feature search confirmed topological feature combinations yielding the best results on the accuracy metric (Fig. 11).
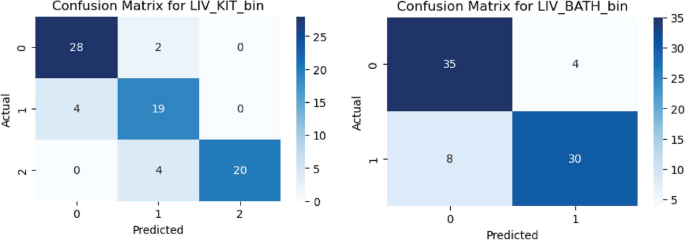
Confusion matrix for VAQ label outputs
5.2 Model evaluation
The model was evaluated using a confusion matrix (see Fig. 12) giving more insight into how well the model is predicting the labels, see classification report Table 2. For VAQ label from living to kitchen, the accuracy is 0.87. This means that in about 87% of cases, the model correctly predicted the label associated with visual access between the living area and the kitchen. VAQ label from living to nearest toilet has an accuracy of 0.84 which is slightly lower.
For the living-to-kitchen scenario, the “preferred” and “insufficient” classes show high precision and recall compared to “sufficient” prediction. The layout with “sufficient” label is slightly more difficult to detect. For the living-to-toilet scenario, performance is balanced between “Insufficient” and “Sufficient,” with F1 scores around 0.80–0.85. This suggests the model handles both classes reasonably well but not as strongly as in the three-class scenario.
These reports suggest the model is learning from the data and the metrics indicate that spaces with “sufficient” visual access is somewhat harder to predict.
5.3 Limitations and future work
Dementia-friendly architectural design is multifaceted involving many variables in determining quality of spaces. This becomes especially more complex when additional factors are considered such as cultural background, varying experienced symptoms, and subjective preferences of people affected by dementia. While visual access is broadly known to support independent navigation by virtue of improving intelligibility of spatial layout, there are additional factors that have effects on ease of wayfinding, excluded from this study. These include articulation of the corridor, spatial hierarchy, position of common areas in relation to the corridor, number of doors along a corridor, corridor path length, and so on. It is imperative to consider all measurable aspects of a floor layout that can be related to increased higher degree of independence for a thorough evaluation. Also, non-visual aspects, such as acoustical quality, contribute to dementia-friendly design. This warrants future investigation on the quantification approach for non-visual data to establish consistent measuring scheme for all DDP criteria. The addition of more DDPs to the quantification scheme will likely have an impact on the feature selection process. It is expected that evaluation metrics from other DDPs use different set of features for the evaluation, or that assessment models are separated by DDP categories. More work on the quantification of other DDP is required for holistic assessment of dementia-friendly spaces.
The floor plans sourced from the Swiss Dwellings dataset allowed for the development of a proof-of-concept ML model that would have been otherwise difficult to test. Although the dataset was useful for isovist sampling, it is limited in terms of quantity and typological variations. The layouts derived from the dataset naturally had varying degree of visual access between the living to kitchen and nearest toilet allowing for diverse distribution of labels. The ML model showed results on Swiss residential typology, and generalizability of the training data on other typologies is not viable. However, the workflow of this study can be applied for a dataset more resembling dementia care setting. Future investigation on suitable means to source or generate synthetic training data that closely align with residential dementia care typology at a given geographic location is therefore recommended as future steps to increase both quantity and variety of the layouts.
The feature pool obtained from the Swiss Dwellings dataset was a good starting point, and the topological features were the most relevant features to correlate with the VAQ labels. The feature subset was derived from the Swiss Dwellings dataset, but it does not go in detail how the features were generated, posing a critical question on the feature extraction step between floor plan geometry into ML model feature inputs. Future possibilities in generating useful topological features correlating to DDP compliance remains unexplored. The possibility of using feature extraction algorithms to directly use floor plans as inputs, such as from building information models, to relate topological features with DDP compliance could play a pivotal role in making the ML model more accessible and useful during the design process. The current model can be applied as means to guide the design towards DDP-compliance when considering wider range of design options. This process complements the expert validation step where a design option was already vetted through the ML model (see Table 3 for comparison between existing methods to the proposed ML approach). Currently it is possible to visualize the analysis (as displayed in Fig. 13), however, more work needs to be done to integrate insights into the software packages to deliver actionable insights to the designer.
A sample of the floor layouts showing the model’s prediction of visual access between living to kitchen. In top row are correctly labelled floor layouts showing the isovist field of view in relation to the living room test points
The ML framework provides several other opportunities as a design-support tool to assess the visual comfort of people living with dementia including light quality and contrast, as sight of elderly can be limited (Habell, 2012). Moreover, the effects of acoustic quality in relation to space could be further investigated as it has effects on wayfinding abilities for people affected by dementia (Alam & Kim, 2023; Fleming & Bennett, 2021). User testing and validation on the indoor spatial qualities, that affect user experiences, should therefore be examined. Such validation can provide more insights in quantification approaches, to determine in which contexts these are applicable. Furthermore, validation with users is required to determine relevant thresholds, such as sufficiency of sightlines, that can contribute to national regulations and dementia environmental assessment tools. The assessment could also be specific to user abilities, including people with mobility challenges, as well as layout considerations based on staff and caregivers’priorities in effectively delivering care and meeting their functional needs.
Measuring dementia-friendly design criteria is a multi-faceted process making it challenging to capture all aspects on floor plans, especially when considering key wellbeing metrics of interest such as personal autonomy or social integration, which can be prone to subjectivity, differ between persons, and are inherently difficult to quantify. Realizing the full potential of this framework will require collaboration across disciplines. Architects, care professionals, facility managers, caregivers, and ML experts must work together to refine the methodology, ensuring that it aligns with the lived experiences of people affected by dementia and the practical needs of care providers. By incorporating their insights, the framework can better address real-world challenges and deliver tangible benefits. ML models have demonstrated their utility in various areas of architectural design, making them well-suited for supporting architects with insights into design quality.
This framework has the potential to improve the lives of people affected by dementia by creating spaces that foster autonomy and social integration, reducing confusion and stress. For architects, it can offer an accessible tool to evaluate designs in real-time, enhancing workflows and promoting data-driven decision-making early in the design process. The adoption of this framework in architectural practice will require integration with existing design tools, such as BIM platforms or generative design systems. By addressing these practical considerations, the framework can become a transformative asset in the pursuit of dementia-friendly architecture.
6 Conclusion
This study introduced a novel approach to dementia-friendly architectural design by integrating ML and isovist-based metrics—a combination not previously explored in the context of dementia-friendly design. By leveraging isovists to quantify visual access and applying ML to assess layout quality, the research bridges qualitative aspects of user experience with quantitative evaluation methods. This unique framework can provide architects with an early-stage decision-support tool that delivers actionable feedback on compliance with DDPs, which are traditionally assessed much later in the process.
The integration of isovists with ML offers a scalable, data-driven solution. This framework enhances the precision and consistency of spatial evaluations, enabling nuanced insights into the relationship between building geometry and user experience. Moreover, the methodology’s adaptability to other design contexts highlights its potential to redefine how architectural layouts are evaluated and iterated during the design process. During the early stages of design, when time or expertise in dementia-specific design is limited, AI can play a pivotal role in bridging the gap between concept ideation and professional assessment.
The visual access quantification metrics proposed in this study provide a consistent measurement scheme, offering a foundation for improving standards for visual access, underpinned by numerical values. Topological features derived from building geometry strongly correlate with the visual access quality labels identified in this research, highlighting the relevance of spatial geometry in dementia-friendly design.
Developing a numerical quantification approach to capture spatial qualities has significant potential for advancing AI and ML models capable of analyzing and generating dementia-friendly architectural designs.