Article Content
Abstract
As eukaryotic organisms, fungi play a pivotal role within ecosystems and exert profound influences on agriculture, the pharmaceutical industry, and human health. The classification of fungi in databases has emerged as a crucial and complex issue in the field of biology. In this study, by leveraging the local distribution of k-mer in nucleotide sequences, we introduce a novel alignment-free method, denoted as k-mer SNV, to address this challenge. On a large fungi dataset including 120,140 sequences, our innovative approach has achieved remarkable success in predicting the taxonomic labels of fungi across six hierarchical taxonomic levels: phylum (99.52%), class (98.17%), order (97.20%), family (96.11%), genus (94.14%), and species (93.32%). The approach is also evaluated on the common Taxxi benchmark dataset. Based on these results, it has been convincingly demonstrated that the k-mer SNV method exhibits outstanding performance in processing large-scale fungal sequence data.
Introduction
Approximately 144,000 species of organisms have been documented, with fungi representing one of the most widely distributed groups on Earth and exhibiting substantial environmental and medical significance [1, 2]. Since the 1990 s, the issue of fungal classification has emerged as a critical area of focus [3, 4]. The classification of fungi can be categorized into three main types: classical, culture-based, and modern. The classical approach achieves the purpose of classifying fungi by identifying specific morphological areas [5], but requires specialized knowledge. The culture-based method identifies fungal classes by examining colonies grown in culture, but it is not suitable for fungi that cannot grow or produce reproductive structures in culture, or for those that are difficult to reproduce naturally. These methods are time-consuming and labor-intensive, leading to their declining use. Modern methods have shifted towards DNA-based technology due to the rapid development of biotechnology. The accurate classification at each taxonomic level is crucial for future ecological and physiological studies [6]. With the advancement of molecular biology, more studies are being conducted on the classification and analysis of fungi based on genome sequences. DNA barcoding is widely used in species classification, and the internal transcribed spacer (ITS) region is often used for fungal identification due to its simplicity and effectiveness [7, 8].
Some researches utilize targeted sequencing analysis followed by the BLAST method [32] to identify fungi. Although these methods often provide a new means of sequencing [10,11,12], they require a high level of expertise, making it difficult for teams without relevant experimental foundations. There are also many approaches based on phylogenetic trees to determine fungal types [13, 15, 16]. However, phylogenetic-based methods struggle with processing big data and may yield inconsistent results due to variations in the evolutionary models employed [17]. Phenotype-based approaches [18,19,20]are relatively time-consuming and costly.
Machine learning-based methods have become popular in recent years [21]. Combining correlations between nucleotides with machine learning methods, Yau proposed an 18-dimensional Natural Vector approach for fungal classification [22]. However, this approach only utilizes the distribution of single nucleotide ignoring that of k-mers. Two other prominent techniques in the field of fungal classification are the Hitac method, which is based on DNA barcodes, and the Kraken2 method, which is purely based on k-mer. Hitac is a hierarchical taxonomic classifier for fungal ITS sequences [27]. On the other hand, the Kraken2 use k-mers for mapping sequences to a database for classification [26, 28]. Given the vast number of fungal taxa across multiple hierarchical levels, ranging from kingdom to species, and the uneven distribution of taxa within each class, many methods are only capable of identifying fungi at specific taxonomic levels [30, 31].Even when these methods can be applied to other levels, their accuracy is often compromised.
To overcome these challenges, we propose a new alignment-free method: K-mer Subsequence Natural Vector (K-mer SNV). The K-mer SNV method divides fungal ITS region sequences into segments, then utilizes the frequency, average positions, and variance of positions of K-mers to represent each segment. By using the distribution of K-mers, the method better adapts to the diversity of fungal sequences. In particular, this technique can classify fungi from phylum to species with high accuracy.
Materials and methods
Dataset
The dataset used in this study was downloaded on January 22, 2024 from the Bold Systems (https://portal.boldsystems.org/result?query=Fungi[tax]). Regarding data processing, for each taxonomic level, samples with fewer than 20 occurrences and species without clear classification were removed. This decision was made because, for taxonomic categories with too few samples, the model may struggle to learn meaningful patterns. Concurrently, the dataset containing fungal ITS region data was retained. Finally, a total of 120,140 barcode entries were included for this research. This dataset contains six categories: phylum, class, order, family, genus, and species, with their numbers being 118,918, 115,241, 113,683, 105,513, 92,141, and 38,646, respectively. As the taxonomic rank decreases from phylum to species, the entry counts for each level decreasing. (see Fig. 1)
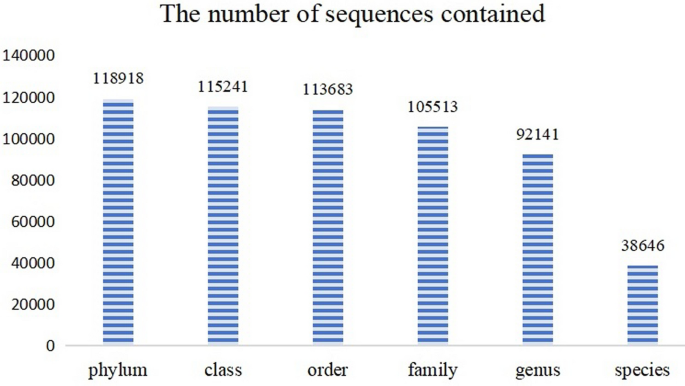
Fungal ITS regional data distribution map
In addition, the distribution across taxonomic levels is as follows: there are 4 phyla, 24 classes, 85 orders, 230 families, 563 genera, and 665 species. (see Fig. 2)
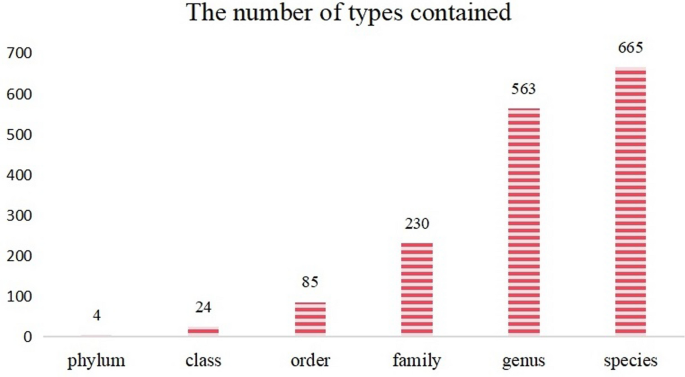
Distribution map of fungal ITS regional data types
Subsequence
We take as a example one ITS DNA sequence S as our input data. Let , we first divide the sequence into L segments. The method proposed in [23] is used to make the number of nucleotides for all segments basically equal. This method divides the sequence into L non-overlapping subsequences by using the formula (1):
where M is the quotient and J is the remainder when dividing N by L. Therefore, for the first J segments (), each segment consists of nucleotides. At the same time, for the remaining segments (), each segment consists of M nucleotides. L is a preset integer () which can be adjusted based on the dataset.
K-mer Subsequence Natural Vector (K-mer SNV)
Before introducing our proposed method, it is worth reviewing the 18-dimensional Natural Vector (18-NV) for classifying fungi based on their ITS region DNA barcodes in [23]. The 18-NV method captures sequence information through the following features: the count of each nucleotide (4 features), the mean position of each nucleotide (4 features), the normalized variance of the position for each nucleotide (4 features), and the covariance between each pair of nucleotides (6 features). This method has demonstrated the potential of utilizing sequence distribution and nucleotide correlations for effective classification. Building on this concept, we introduce the K-mer Subsequence Natural Vector (K-mer SNV) method, which further enhances feature extraction efficiency and adaptability to sequence diversity.
After cutting the sequence into L segments, we calculate the K-mer values for each subsequence. We begin by introducing the concept of a K-mer in the DNA sequence. A K-mer refers to a sequence of K nucleotides. For instance: there are 4 possibilities for 1-mer: A, C, G, T (), 16 possibilities for 2-mer: AA, AC, AT, AG, CA, CC, CT, CG, GA, GC, GG,GT, TA, TC, TG, TT ().Continuing in this manner, when , there will be possibilities of combining.Next, we calculate the K-mer Subsequence Natural Vector (K-mer SNV), which is ultimately used as the feature vector for the sequence. Before calculating the feature, we define an indicative function:
Where, , for example, when K=2, .
Subsequently, for each in each subsequence, three statistics are used for feature extraction:
- 1.Let describe the number of .
- 2.Let be the mean position of .
- 3.Let be the normalized second central moment of position of .
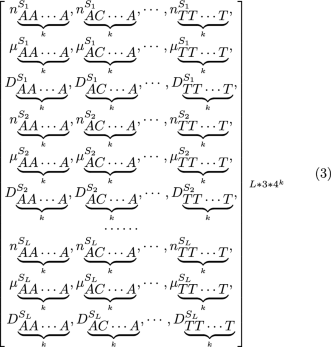
Consequently, when the sequence is separated into L subsequences: , we ultimately obtain an dimensional numeric vector, (see (3)), and use it as a feature vector. This vector called the K-mer Subsequence Natural Vector (K-mer SNV).
In Supplementary File 1, we provide a detailed demonstration of the calculation process.
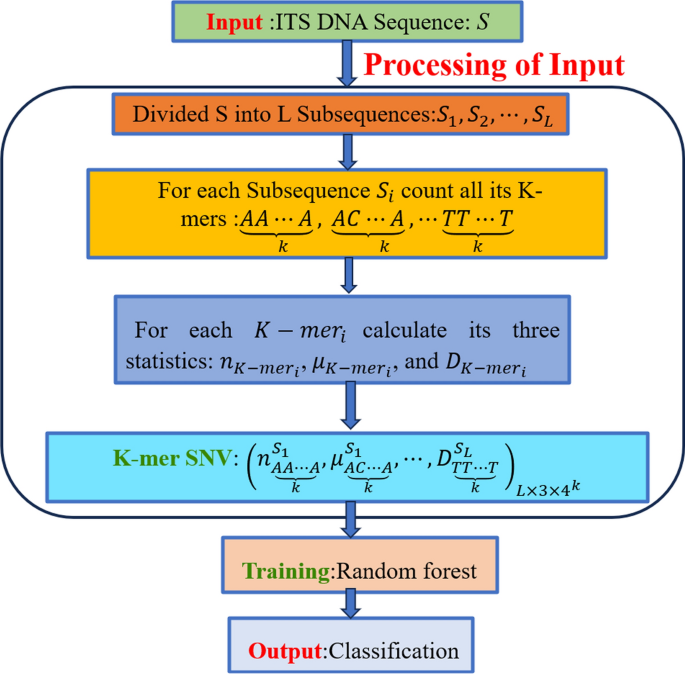
Flowchart of the K-mer SNV method
At this point, we successfully convert a DNA sequence into a numeric feature vector, known as the K-mer Subsequence Natural Vector (K-mer SNV). This vector will serve as our input for the machine learning model. In the next step, we will utilize machine learning algorithms to classify fungi, as illustrated in the flowchart (see Fig. 3)
Supervised classification
Due to the complexity and data characteristics of the fungal datasets, we have chosen the random forest algorithm as the classifier for our study. Random forest [24] is a widely-used supervised learning method, which employs an ensemble learning-based approach that performs the classification task by constructing multiple decision trees and synthesizing their predictions.
To ensure the robustness of our model and to prevent data leakage, we have carefully de-duplicated the dataset to ensure that identical sequences do not appear in both the training and test sets. We allocate 80% of the data to the training set and 20% to the testing set respectively, ensuring that there is no overlap between the training and testing datasets. Next, we train the model, where only the training set participates in the training phase, and the test set is an independent set that is used to test the results of the model. We employ 5-fold cross-validation for both modeling and testing, which further enhances the reliability of our evaluation. The parameters of the random forest are optimized through a grid search, ensuring that our model benefits from the most effective hyperparameter configuration. The output of our method is a classification result that categorizes the fungal sequences into various taxonomic levels, specifically: phylum, class, order, family, genus, and species.
In this study, we employed several evaluation metrics to assess the performance of our Random Forest model, beginning with accuracy. Accuracy [14] is defined as the ratio of correctly predicted samples to the total number of samples. Specifically, it is calculated by dividing the number of correctly classified samples by the total number of samples in the dataset. The formula for accuracy is:
Correctly classified samples are those for which the model’s predictions match the actual labels, while the total number of samples refers to all the samples used for evaluation. To compute accuracy, we compare the model’s predicted outputs with the true labels, count the number of samples that were classified correctly, and divide this count by the total number of samples.
Accuracy is a commonly used and straightforward metric to evaluate classification models, as it provides a general measure of the model’s performance. In our study, accuracy effectively reflects the overall performance of the model in classifying ITS DNA sequences. However, we recognize that accuracy alone may not fully capture the model’s performance, especially in cases where the dataset is imbalanced. For this reason, we also employ additional evaluation metrics to provide a more comprehensive understanding of the model’s effectiveness.
In addition to accuracy, we calculate the F1-score, which is the harmonic mean of precision and recall. The F1-score [14] is calculated using the following formula:
The F1-score provides a balanced measure between precision and recall, particularly useful when there is an uneven class distribution. We also use the Area Under the Curve (AUC), which measures the model’s ability to distinguish between different classes. AUC is derived from the Receiver Operating Characteristic (ROC) curve and provides a summary of the model’s classification performance across different thresholds.
Lastly, we assess recall (also known as sensitivity), which calculates the proportion of actual positives correctly identified by the model. The recall [14] is calculated as:
Recall is particularly important when we need to minimize false negatives in classification tasks, ensuring that as many relevant samples as possible are correctly identified.
Together, these metrics-accuracy, F1-score, AUC, and recall-offer a thorough evaluation of our model’s performance, addressing various aspects of classification accuracy, precision, and reliability.
The source code has been made publicly available on GitHub. You can access it through the following link https://github.com/point4444/k-mer-snv/tree/master.
Results
Selection of parameters K and L
In our study, K and L are parameters that need to be determined based on the dataset of the experiment. To determine the optimal values for parameters K and L, we compute e a series of accuracies for different K and L. For the Phylum dataset, using the random forest method with 20 trees, we adjusted the values of K and L, calculating the prediction accuracy for the test set and selecting the parameter values corresponding to the highest accuracy, as shown in Fig. 4. We observed that accuracy initially increased and then decreased, with the model achieving its peak accuracy of 99.35%. when K = 4 and L = 3. Consequently, we settled on K = 4 and L = 3 for our model. These parameters, once optimized in the training set, were then applied to the test set to evaluate the model’s performance.This approach was consistently applied to other datasets, which also demonstrated peak performance withK and L set to 3 and 4, respectively.
Furthermore, Fig. 5 illustrates the changes in the AUC values on the species dataset with variations in K and L. It can be seen from the graph that the AUC value generally shows an upward trend with the increase of K and L, which further supports the rationale behind our selection of the K and L parameters. In particular, the AUC value reached its highest point when K=4,L=3, which is consistent with our previous findings on the phylum dataset and further substantiates our parameter choices. These results indicate that by adjusting the K and L parameters, we can effectively enhance the model’s classification performance.
Regarding the choice of L and K, due to computational resource limitations, the parameter range we selected is within what can be handled by the current hardware. Larger values of L or K would significantly increase the computational burden, especially when processing large amounts of data on a standard laptop, leading to higher time and memory costs. Through experimentation, we found that the performance reached a plateau near K=4 and L=3. Increasing the parameters further did not result in significant improvements. With more powerful computational resources, increasing the parameters might be beneficial, but under the current conditions, we believe the chosen settings already provide satisfactory results.
Computations were performed on a personal computer with an Intel Core i5-7200U CPU @ 2.50 GHz and 8 GB RAM.
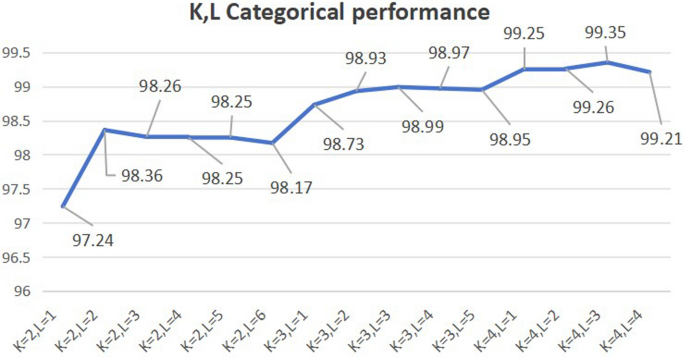
On our dataset, the prediction accuracy of Phylum dataset with changes in K and L
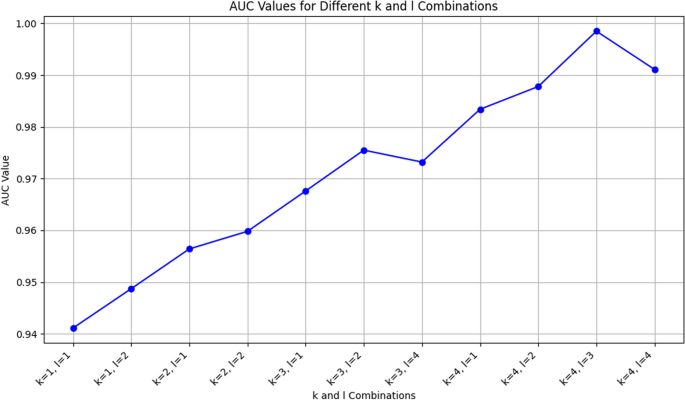
On our dataset, the AUC at the Species dataset with changes in K and L
Classification performance
In order to demonstrate the advantages of our method in the classification of fungi, we initially assessed its predictive performance across each taxonomic level using aggregated data from each level and compared it with the 18-NV method [23]. As illustrated in Table 1, the 18-NV method analyzes fungi species by leveraging correlations between nucleotides, relying on the convex hull method. In contrast, our method has yielded promising results across various datasets. Although the number of categories increases and becomes uneven from Phylum to Species, leading to a decrease in prediction accuracy, our method still maintains an accuracy above 93%.
In our study, when using the method of only building fungi libraries, running according to the program of kraken2 build always fails to complete, and it seems that the required fungi sequence cannot be found on the NCBI server. We took the approach of building the entire library, but it didn’t always work out due to network issues. Finally, we download the database from the https://benlangmead.github.io/aws-indexes/k2 website. We have selected Standard plus Refeq protozoa & fungi which contains the latest kraken2 database with fungi released on 2024-12-28. The database is k2_pluspf_20241228.tar.gz, 70GB in compressed package, 92GB after decompression. At the same time, we compared it with the BTOP [32], which is a BLAST-based method, and TOP, which is a usearch-based techique. [33] The outcomes of our experiments are presented in Table 1.We compared our method with these existing ones at various taxonomic levels. The performance of Hitac showed a significant improvement over the previous 18-NV method. However, as shown in Table 1, our proposed method demonstrated better advantages at all levels.
Additionally, the time required to complete this work at each level is less than 30 min. These calculations were conducted on a personal computer equipped with an Intel Core i5-7200U CPU @ 2.50 GHz and 8 GB of RAM, showcasing the efficiency and feasibility of our method even on standard hardware.
From the Fig. 6, The 18-NV method shows a high performance with AUC values starting at 0.99 for the Phylum level and slightly decreasing to 0.96 at the Species level. On the other hand, the K-mer SNV method demonstrates perfect or near-perfect performance across all taxonomic levels, with AUC values ranging from 0.99 to 1.00. This indicates that while both methods perform well, the K-mer SNV method is more consistent and robust, especially as the classification becomes more refined. The slight decrease in AUC for the 18-NV method from Phylum to Species suggests that it may be slightly less effective at handling the increased complexity and uneven distribution of categories at finer taxonomic levels. In contrast, the K-mer SNV method maintains high accuracy, indicating its superior capability in classifying fungi across different taxonomic levels. This analysis highlights the advantages of the K-mer SNV method in fungal classification, particularly its ability to maintain high performance even as the classification task becomes more challenging.
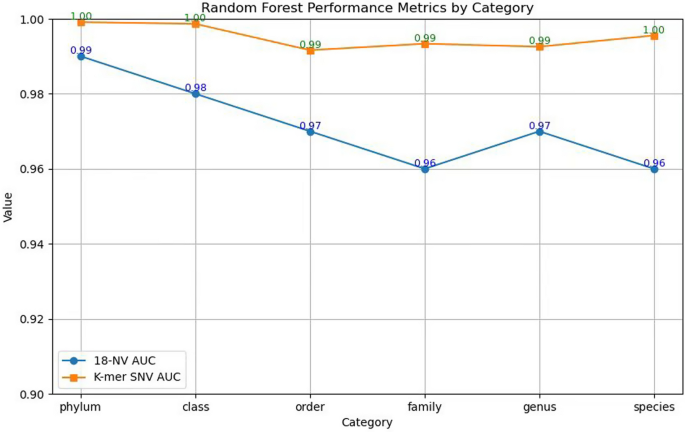
On our dataset, comparison of the AUC between the 18-NV method and our K-mer SNV method
Classification of phylum
For the Phylum, there are 118,918 barcodes. This dataset is divided into four categories: Ascomycota, Basidiomycota, Glomeromycota, and Zygomycota. For more information about the number and length range of datasets, see Table 2. As can be seen from the Table 2, there is little difference in the length of each fungal phyla, but there is a significant difference in the amount of Ascomycota and Basidiomycota compared to Glomeromycota, and Zygomycota. Although the amount of data varies widely, the results are good. For each class, the values of the four quantities Precision, Recall, F1 score, and Accuracy are close to 1. After calculating the k-mer SNV, we used the Random Forest (RF) and Logistic Regression (Lg) classifiers for verification, and from the results, it can be seen that the Random Forest and Logistic Regression classifiers have little impact on the results, indicating that the K-mer SNV encoding effect plays a major role in data prediction. Meanwhile, this proves that our method works even when the amount of data is uneven, and that our method is robust.
Classification of class
Unlike Phylum, Class has 115,241 barcodes, and it contains 24 classes, and the number of classes is even more uneven, the largest number of class includes 34,307 barcodes, however, the class contains only 21 barcodes, the difference between the two is more than 1,000 times. Still, the results of our algorithm at the level of Class have been shown to be very effective, see Table 3. Except for Agaricostilbomycetes, which has a relatively small number, it is only 0.8 on the Precision indicator, and everything else is close to 1.
The remaining prediction results are included in the Supplementary Files 2 (Order, Family, Genus, and Species).
Discussion
Our method was evaluated on the Taxxi (sp_rdp_its.90) dataset and compared with other existing methods. Note that this dataset is the most difficult to analyze among five fungi ITS datasets in the TAXXI benchmark.
Using the hierarchical precision, recall and F1-score defined in [27], our method achieved an F1-score of 89, demonstrating good performance, yet there is still room for improvement. Figure 7 presents a comprehensive comparison between k-mer SNV and other state-of-the-art methods. Our method achieves an F1-score of 89, indicating that it has the potential to compete effectively with other methods in the field. One of the strengths of our method is the flexibility in parameter adjustment. By tuning the k and l parameters, we can fine-tune the model’s performance. Despite the current F1-score already indicating strong performance, further optimization of these parameters could lead to even higher performance.
While the results are promising, our method, like any other, has its limitations. The selection of K and L parameters is crucial and may require manual adjustment based on the specific characteristics of different datasets. Future work could focus on developing automated parameter selection strategies, potentially leveraging machine learning techniques to predict optimal parameter values based on dataset attributes.
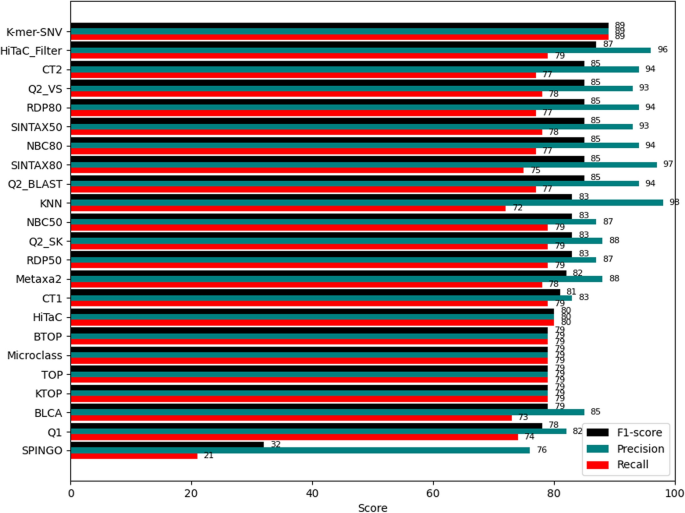
Comparison of methods on the Taxxi (sp_rdp_its.90) dataset
In addition to this, our methods can also be applied to the phytogenetic analysis of fungi. After calculating the corresponding K-mer SNV, the following Fig. 8 of the UPGMA [25] phylogenetic tree is obtained using MEGA software [29]. Through the phylogenetic tree, it can be seen that our method can show the evolutionary relationship of fungi very well.
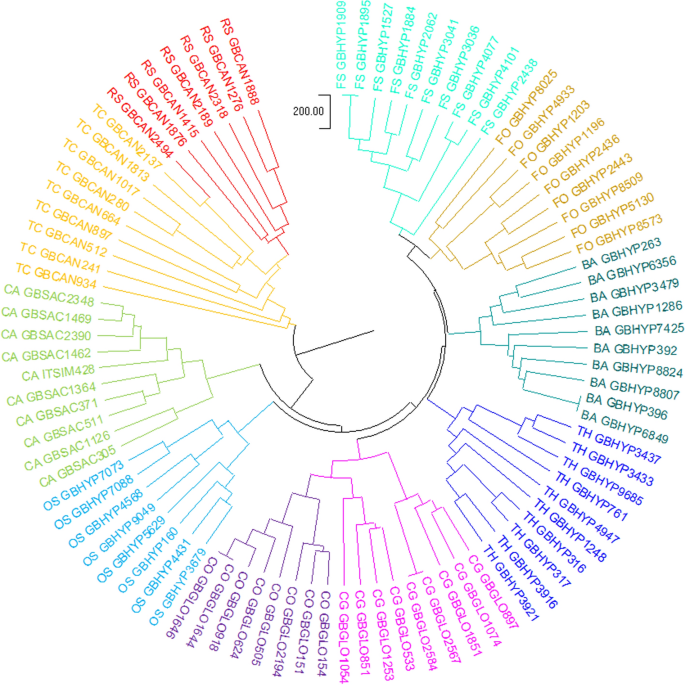
UPGMA phylogenetic tree of ITS sequences from 90 fungal Species in our dataset, constructed using the K-mer SNV method with K=4,L=3
In summary, we propose a new computational method that can be effectively applied to the identification of fungi. Traditional sequence alignment methods are widely used, but they are time-consuming and require a high-performance computer to process large data sets. However, our approach is effective in overcoming these problems. Compared to 18-NV, although our method achieves good classification results on all layers, we still need to optimize our method for some layers, such as genus and species. Our approach also shows great advantages in some sub-categories.
Conclusions
Moreover, in the selection of parameters K and L, our method needs to do more comprehensive experiments to explore the problem of parameter selection. At the same time, we need to see if our approach can be applied to other species classifications. These problems should be investigated in further study.
Availability of data and materials
The datasets analysed during the current study are available in the [Bold Systems] repository, [https://portal.boldsystems.org/result?query=Fungi[tax]].
References
-
Moore D, Alexopoulos CJ, et al. ”Fungus”. Encyclopedia Britannica, 2024-07-21, https://www.britannica.com/science/fungus
-
Lücking R, Aime MC, Robbertse B, et al. Fungal taxonomy and sequence-based nomenclature. Nat Microbiol. 2021;6:540–8.
-
Gautam AK, Verma RK, et al. Current insight into traditional and modern methods in fungal diversity estimates. J Fungi. 2022;8(3):226.
-
Lin P, Kook M, Yi TH, et al. Current fungal taxonomy and developments in the identification system. Curr Microbiol. 2023;80:375.
-
Hoefnagels MH. Biodiversity of fungi: inventory and monitoring methods. BioScience. 2005;55(3):282–3.
-
Tedersoo L, Smith ME. Ectomycorrhizal fungal lineages: detection of four new groups and notes on consistent recognition of ectomycorrhizal taxa in high-throughput sequencing studies. Ecol Stud. 2017;30:125–42.
-
Schoch CL, Seifert KA, et al. Fungal barcoding consortium; fungal barcoding consortium author list. Nuclear ribosomal internal transcribed spacer (ITS) region as a universal dna barcode marker for fungi. Proceedings of the national academy of sciences of the United States of America. 2012;109(16):6241-6.
-
Irinyi L, Serena C, Garcia-Hermoso DD, et al. International society of human and animal mycology (ISHAM)-ITS reference DNA barcoding database-the quality controlled standard tool for routine identification of human and animal pathogenic fungi. Med Mycol. 2015;53(4):313–37.
-
Altschul SF, Gish W, Miller W. Basic local alignment search tool. J Mol Biol. 1990;215:403–10.
-
Langsiri N, Worasilchai N, Irinyi L, et al. Targeted sequencing analysis pipeline for species identification of human pathogenic fungi using long-read nanopore sequencing. IMA Fungus. 2023;14(1):18.
-
Jain M, Olsen HE, Paten B, et al. The Oxford nanopore MinION: delivery of nanopore sequencing to the genomics community. Genome Biol. 2016;17(1):239.
-
Lücking R, Aime MC, Robbertse B, et al. Unambiguous identification of fungi: where do we stand and how accurate and precise is fungal DNA barcoding. IMA Fungus. 2020;11:14.
-
Yuanning L, Jacob SLL, Ying Changwald C, et al. A genome-scale phylogeny of the kingdom Fungi. Curr Biol. 2021;31(8):1653–65.
-
Rainio O, Teuho J, Klén R. Evaluation metrics and statistical tests for machine learning. Sci Rep. 2025;14(1):1–14. https://doi.org/10.1038/s41598-024-56706-x.
-
Mehta N, Jadhav R, Baghela A, Molecular taxonomy A, multigene phylogeny of filamentous fungi. In: Gupta VK, Tuohy M, editors. Laboratory protocols in fungal biology. Fungal Biology. Cham: Springer; 2022.
-
Tedersoo L, Snchez-Ramrez S, Kljalg U, et al. High-level classification of the fungi and a tool for evolutionary ecological analyses. Fungal divers. 2018;90:135–59.
-
Wang Y, Dong W, Liang Y, Lin W, Chen J, Henry R, Chen F. PhyloForge: unifying micro- and macroevolution with comprehensive genomic signals. First published: 26 November 2024.
-
Hewitt SK, Foster DS, Dyer PS, et al. Phenotypic heterogeneity in fungi: importance and methodology. Fungal Biol Rev. 2016;30(4):176–84.
-
Smith TJ, Donoghue PCJ. Evolution of fungal phenotypic disparity. Nat Ecol Evol. 2022;6:1489–500.
-
Persoh D. Plant-associated fungal communities in the light of meta’omics. Fungal Divers. 2015;75:1–25.
-
Liu Z, Li Y. Fungi classification in various growth stages using shortwave infrared (SWIR) spectroscopy and machine learning. J Fungi. 2022;8:978.
-
Zhao X, Tian K, Yau SST. A new efficient method for analyzing fungi species using correlations between nucleotides. BMC Evol Biol. 2018;18:1–13.
-
Zhao B, He RL, Yau SS-T. A new distribution vector and its application in genome clustering. Mol Phylogenet Evol. 2011;59:438–43.
-
Breiman L. Random forests. Mach Learn. 2001;45:5–32.
-
Loewenstein Y, Portugaly E, Fromer M, et al. Efficient algorithms for accurate hierarchical clustering of huge datasets: tackling the entire protein space. Bioinformatics. 2008;24(13):i41–9.
-
Wood DE, Lu J, Langmead B. Improved metagenomic analysis with Kraken 2. Genome Biol. 2019;20(257):1–13. https://doi.org/10.1186/s13059-019-1891-0.
-
Miranda FM, Azevedo VC, Ramos RJ, Renard BY, Piro VC. Hitac: a hierarchical taxonomic classifier for fungal ITS sequences compatible with QIIME2. BMC Bioinform. 2024;25(228):1–13. https://doi.org/10.1186/s12859-024-05839-x.
-
Lu J, Salzberg SL. Ultrafast and accurate 16S rRNA microbial community analysis using Kraken 2. Microbiome. 2020;8:124.
-
Tamura K, Stecher G, Kumar S. MEGA11: molecular evolutionary genetics analysis version 11. Mol Biol Evol. 2021;38(7):3022–7.
-
Nilsson RH, Abarenkov K, Ryberg M, et al. The UNITE database for molecular identification of fungi: handling dark taxa and parallel taxonomic classifications. Nucleic Acids Res. 2019;47(D1):D259–64.
-
Lücking R, Dentinger BM, Lumbsch HT. Fungal taxonomy and sequence-based nomenclature. Nat Microbiol. 2020;5(5):540–8.
-
Altschul SF, Gish W, Miller W, Myers EW, Lipman DJ. Basic local alignment search tool. J Mol Biol. 1990;215:403–10.
-
Edgar RC. Accuracy of taxonomy prediction for 16s RRNA and fungal its sequences. PeerJ. 2018;6:e4652.
Acknowledgements
This work is supported by National Natural Science Foundation of China (NSFC) grant (42450242), Tsinghua University Education Foundation fund, and Beijing Key Laboratory of Topological Statistics and Applications for Complex Systems (BIMSA), Beijing Institute of Mathematical Sciences and Applications, Beijing 101408, China, as well as the Youth Project of Beijing Digital Education Research Project, 2024 (BDEC2024QN081), General Project of the 2024 Scientific Research Plan of Beijing Municipal Education Commission (KM202410016001), and Research Project of Beijing Higher Education Society, 2024 (MS2024130).
Ethics declarations
Competing of interest
The authors declare that they have no Conflict of interest.
Ethics approval and consent to participate
Not applicable.
Consent for publication
Not applicable.
Additional information
Publisher’s Note
Springer Nature remains neutral with regard to jurisdictional claims in published maps and institutional affiliations.
Supplementary Information
Supplementary file 1.
Supplementary file 2.
Rights and permissions
Open Access This article is licensed under a Creative Commons Attribution-NonCommercial-NoDerivatives 4.0 International License, which permits any non-commercial use, sharing, distribution and reproduction in any medium or format, as long as you give appropriate credit to the original author(s) and the source, provide a link to the Creative Commons licence, and indicate if you modified the licensed material. You do not have permission under this licence to share adapted material derived from this article or parts of it. The images or other third party material in this article are included in the article’s Creative Commons licence, unless indicated otherwise in a credit line to the material. If material is not included in the article’s Creative Commons licence and your intended use is not permitted by statutory regulation or exceeds the permitted use, you will need to obtain permission directly from the copyright holder. To view a copy of this licence, visit http://creativecommons.org/licenses/by-nc-nd/4.0/.
Reprints and permissions
Cite this article
He, L., Huang, M., Yiming, G. et al. A new alignment-free method: K-mer Subsequence Natural Vector (K-mer SNV) for classification of fungi. BMC Bioinformatics 26, 170 (2025). https://doi.org/10.1186/s12859-025-06152-x
- Received
- Accepted
- Published
- DOIhttps://doi.org/10.1186/s12859-025-06152-x
Keywords
- K-mer SNV
- Fungi
- Alignment-free
- Classification