Article Content
1 Introduction
1.1 Solar cells: uses and applications
Solar cells are pivotal in the transition towards sustainable energy sources, converting sunlight into electricity. However, the efficiency and longevity of these cells can be compromised by material defects and abnormalities, which can lead to performance degradation. The rapid detection and accurate diagnosis of these defects are crucial for maintaining high efficiency in solar power systems and reducing operational costs. Traditional diagnostic methods, such as I–V characterization, although effective, are invasive and time-consuming. Consequently, there is a growing demand for advanced, non-contact diagnostic techniques that offer real-time, high-resolution analysis (Green et al. 2019; Luque and Hegedus 2003; Aberle 2009; Green 2015).
To maintain the durability and reliable performance of solar cell panels, robust quality control measures must be implemented to prevent faulty cells from being included in the final product. With the anticipated growth in solar cell manufacturing, reliability-based maintenance using non-destructive testing (NDT) and non-destructive evaluation (NDE) methods must be developed. These methods aim to detect early signs of solar cell deterioration and determine the appropriate time for module replacement. Simultaneously, the importance of quality inspection applications in manufacturing is increasing. The objective is to create a production environment free of failures through unified ND technique testing and monitoring of manufactured components.
Additionally, developing a non-contact method capable of evaluating solar cell panels in situ, without disassembly, and providing immediate evaluations presents a challenging yet essential task. Currently, techniques like thermography (Vaněk et al. 2016; Pierdicca et al. 2018; Chaudhary and Chaturvedi 2018), electroluminescence (ELu) (Tang et al. 2022; Puranik and Gupta 2022), and photoluminescence (PLu) (Alkathy et al. 2022; Demant et al. 2016; Nos et al. 2016) are extensively used to identify imperfections in solar modules. While thermography is valuable for detecting imperfections that cause heating in solar cell panels (Herraiz et al. 2020), it is limited to identifying issues that result in thermal anomalies (Köntges, et al. 2014). ELu, typically used during the assembly phase, involves capturing high-resolution images of light emitted by cells when an electrical current passes through them. Faulty regions appear darker due to reduced current flow. However, ELu requires a controlled dark environment, limiting its use to controlled conditions during the manufacturing process (Tang et al. 2020). Moreover, ELu inspections are predominantly performed by human operators, introducing the possibility of human error.
Recent advancements in PLu characterization, utilizing an excitation laser light source, have emerged as accurate, fast, and powerful tools for developing high-efficiency silicon solar cells. This technique allows for the detection of material flaws in wafers during incoming quality checks, enabling the rejection of low-quality wafers. A CCD imager captures the PLu image, and a 1 µm long pass filter filters out scattered and reflected laser light (Haunschild et al. 2012). However, developing a module-sized laser light source with sufficient power and suitable frequencies for PLu imaging remains a challenge. Advanced imaging characterization techniques, such as OCT and hyperspectral (HS) imaging, are critical in testing, performance improvement, and optimization of solar cells. These methods are becoming widely used for identifying optical signatures in solar cell systems. Non-contact and reliable techniques based on spectral data analysis are increasingly important for assessing the status and validating the performance of solar cell materials. HS imaging, unlike conventional CCD cameras that measure only three spectral bands, offers extensive spectral data, providing a comprehensive understanding of objects and their compositions (Li et al. 2010; Grahn and Geladi 2007; Lindon et al. 2016; Mahmoud and El-Sharkawy 2023). Previous studies (Burud et al. 2016; Rahman and Chen 2020) have employed this methodology using a laser as the excitation light source.
1.2 Optical coherence tomography: techniques and applications
Optical Coherence Tomography (OCT) and Hyperspectral Imaging (HSI) represent two promising technologies in this field. OCT, originally developed for medical imaging, provides detailed cross-sectional images, allowing for the inspection of internal structures of solar cells. Its non-invasive nature and high resolution make it an excellent tool for detecting subsurface defects. Meanwhile, HSI captures spectral information across a wide range of wavelengths, offering a comprehensive analysis of the optical properties of materials. By integrating OCT with HSI, this study aims to create a robust, automated system capable of early detection of solar cell abnormalities, enhancing maintenance strategies and extending the lifespan of solar panels. (Tsai et al. 2012; Drexler and Fujimoto 2008; Brezinski 2006).
1.3 Comparison of the presented system with gold standard techniques
This paper introduces a novel automated classification system for detecting and distinguishing abnormalities in photovoltaic materials, using OCT, hyperspectral imaging, and quantitative phase analysis. Our system is designed to offer high accuracy and reliability, surpassing traditional diagnostic methods. Compared to gold standard techniques like I–V characterization (Fercher et al. 2003; Wagner et al. 2014), our approach offers several advantages, including non-invasiveness, real-time imaging, and the ability to analyze materials at various depths (Anayi et al. 2011; Fink et al. 2017). The integration of hyperspectral imaging enables a comprehensive analysis of the optical properties of photovoltaic materials, while quantitative phase analysis enhances the detection of subtle abnormalities. The efficacy of our system is validated against the gold standard I–V characterization, demonstrating its potential for early detection and precise localization of abnormalities in solar cells. By providing objective and consistent results, our system aims to improve the efficiency and longevity of photovoltaic installations, contributing to the advancement of renewable energy technologies.
2 Methodology: optical coherence tomography exploiting
2.1 Hyperspectral acquisition system
This study focuses on the design and implementation of a non-contact, offline solar cell abnormality detection system utilizing Optical Coherence Tomography (OCT) integrated with a Hyperspectral Imaging (HSI) acquisition system. The primary objectives are to save power and reduce detection time, thereby making the system potentially useful for solar cell calibration and testing. We assessed the OCT imaging system’s capability to detect abnormalities in 15 solar cell samples, with the results validated against the gold-standard I–V characterization.
The images captured by the hyperspectral camera are processed and analyzed using a custom-designed workflow algorithm. This process, which includes steps such as image processing and clustering, is completed within a few minutes, as outlined in the workflow algorithm (appendix, Fig. 8). The experimental method includes the following key components:
2.2 Experimental method
The experimental setup employs a dual-modality system that combines OCT and HSI for a comprehensive analysis of solar cells. This system is designed to operate offline, offering flexibility in testing and calibration environments without requiring real-time feedback. The main components of the system are:
- 1.OCT system: This component is used for high-resolution imaging of the internal structures of the solar cells. The OCT setup includes a broadband light source, a Michelson interferometer, and a high-speed camera, enabling the capture of detailed cross-sectional images that are essential for identifying internal defects.
- 2.HSI acquisition system: The hyperspectral camera captures images across multiple wavelengths, providing extensive spectral information. This data is crucial for analyzing both the surface and subsurface properties of the solar cells, aiding in the detection of abnormalities such as material inconsistencies or impurities.
- 3.Data processing and analysis: The data collected from the OCT and HSI systems are processed using a custom-designed workflow algorithm. This includes steps such as noise reduction, image segmentation, and clustering techniques to classify and quantify the detected abnormalities. The workflow is optimized for efficiency, ensuring that the complete processing and clustering tasks are performed within a few minutes, thus enabling quick diagnostics.
- 4.Validation and testing: The system’s performance was evaluated using 15 solar cell samples. The abnormalities detected by the integrated OCT-HSI system were compared with results obtained from the gold-standard I–V characterization method. This validation is essential for establishing the accuracy and reliability of the proposed detection system.
- 5.Power efficiency considerations: A significant focus of the study was to design a system that not only minimizes detection time but also conserves power. By integrating OCT and HSI into a single setup, the system can simultaneously acquire structural and spectral data, thereby reducing the energy consumption typically associated with operating separate systems.
2.3 Experimental setup
The experimental setup for measuring diffused reflection utilized a polychromatic light source, a 35W halogen lamp (Mean Well, ENP360, Taiwan), emitting light across a wavelength range of 400–900 nm. Diffused reflection signatures of ex-vivo breast samples were captured using a hyperspectral (HS) camera (RESONON, Pika XC2, USA), with a spectral range of 400–1000 nm and a spectral resolution of 1.3 nm. The HS camera, equipped with an objective lens (Schneider, 400–1000 nm, CNG 1.4/12–0906, Germany), was positioned 27 cm away from the sliding stage, while the light source was placed 12 cm away from the solar cell samples.
Signal analysis was conducted using SpectrononPro software (Version: 2.134–64 bit, RESONON INC., 2019, USA). Data from the imaging system comprised two arms: the reference probe arm and the measured probe arm. The reference probe arm captured the reflected light source from a 100% reflector whiteboard (Fig. 1a), while the measured probe arm captured the diffused reflection from the investigated samples (Fig. 1b). The phase difference between the probe and measured arms was determined, providing phase imaging used to analyze abnormalities in solar cell areas (Fig. 1c).
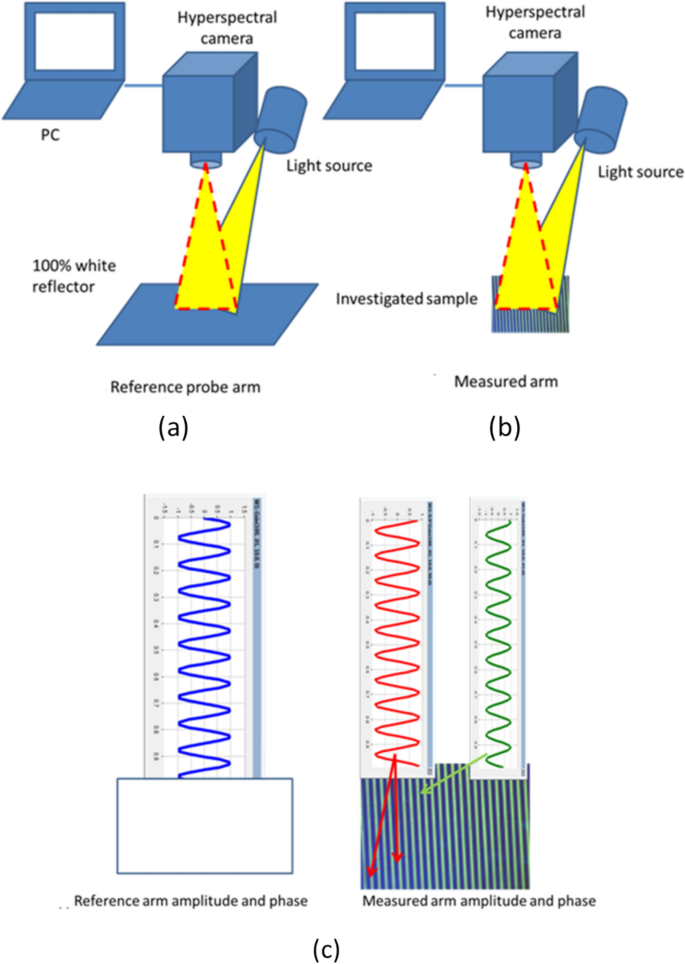
The custom optical coherence tomography imaging system. In a, the reflected light from the 100% reflector whiteboard is shown. b depicts the diffused reflection captured from the measured samples, and c presents the phase imaging used for identifying abnormalities
2.4 Si-based solar cell sample preparation
The silicon-based solar cell samples used in this study were commercially available monocrystalline and polycrystalline silicon solar cells. Prior to imaging, the samples underwent surface cleaning using an ethanol-based solution to remove dust and organic contaminants. To ensure consistency in optical measurements, each sample was mounted on a non-reflective black substrate to minimize background interference. The solar cells were tested in their encapsulated state as well as after partial delamination to expose subsurface structures for hyperspectral imaging. The encapsulated samples retained their protective glass layer, while the delaminated samples allowed for direct imaging of the silicon surface and interlayer defects.
To characterize the optical properties of the samples, the reflectance spectrum was measured before and after delamination. Additionally, artificial defects were introduced in controlled regions to validate the imaging system’s ability to detect abnormalities. These defects included surface scratches, microcracks, and variations in doping concentration. By employing different imaging techniques, the study aimed to assess both surface and subsurface irregularities affecting solar cell performance.
2.5 Reflectance spectrum analysis
A reflectance spectrum was obtained by collecting and analyzing surface and subsurface-reflected electromagnetic radiation as a function of frequency (in wavenumbers, cm−1) or wavelength (in nanometers, nm). Two types of reflection were observed: specular reflection from smooth, polished surfaces like mirrors, and diffuse reflection from textured surfaces like powders. The imaging system targeted specific areas with varying physical and chemical compositions, detectable by differences in light reflection or absorption. The light source spectrum ranging from 400 to 900 nm interacted with the samples, and the diffuse reflection and light scattering were collected using HSI and associated algorithms for analysis. The acquired hyperspectral images facilitated the recognition and mapping of surface and subsurface diagnostic information.
2.6 Quantitative phase and magnitude classifier algorithm
To delineate and detect carbon fiber surface texture and cracks within the sample thickness, a Spatial Quantitative Phase-Shift algorithm and magnitude analysis were employed. Subsurface imaging was controlled by selecting appropriate hyperspectral filters. Captured images at 420, 440, 460, and 480 nm underwent pre-processing steps, including normalization and noise removal using a moving average filter with a kernel size of 10. The variation in magnitude phase shift due to sample shape, size, and density was analyzed for the solar cell region and malignant areas relative to the reference phase reflected from the 100% reflector whiteboard (Fig. 1c).
Figure 1c visualizes the quantitative phase imaging technique, where phase shifts from the sample are compared with those reflected from the whiteboard reference to identify subsurface anomalies.
2.7 Theoretical background: spectral optical coherence tomography (spectral OCT)
Spectral Optical Coherence Tomography (Spectral OCT) is a powerful imaging technique that utilizes low-coherence interferometry to obtain cross-sectional images of samples with high resolution. This method exploits the principle of spectral interferometry, where light from a broadband source is split into reference and sample arms. The interference pattern produced by recombining these beams encodes depth information, which is extracted using Fourier transformation.
Unlike conventional time-domain OCT, which relies on mechanical scanning to obtain depth profiles, spectral OCT captures the entire depth profile in a single exposure using a spectrometer and a high-speed camera. This significantly enhances imaging speed and sensitivity while providing superior axial resolution. The spectral decomposition of backscattered light allows for detailed characterization of material properties, making it an effective tool for identifying subsurface defects in solar cells.
By integrating hyperspectral imaging with spectral OCT, this study enables non-contact, high-resolution imaging of solar cell structures. The combination of phase and magnitude analysis improves defect detection by highlighting variations in refractive index, surface roughness, and layer thickness. The ability to acquire depth-resolved images in real-time makes spectral OCT an invaluable technique for solar cell diagnostics, quality control, and performance optimization.
2.8 Justification for narrow wavelength range (400–900 nm)
The study focused on the 400–900 nm wavelength range because it encompasses the primary energy absorption region for silicon-based solar cells. Most of the photon absorption and carrier generation in these cells occur between 400 and 600 nm, which is the critical range for evaluating diffused reflection characteristics. Although the contrast in solar cells is higher in the 500–600 nm range, using a broader range (400–900 nm) allows for better characterization of both surface and subsurface features. The extended wavelength range also enhances defect detection by capturing variations in refractive index and light scattering at different depths. Theoretical and experimental validation confirms that the selected range optimally balances signal acquisition, imaging resolution, and diagnostic accuracy.
2.9 J-V validation correlation
To establish a direct correlation between J-V characteristics and surface/subsurface irregularities, current–voltage (J-V) measurements were performed on the investigated solar cells before and after defect identification using spectral OCT. The presence of microcracks, surface contamination, and non-uniform doping were found to affect key photovoltaic parameters such as short-circuit current density (Jsc), open-circuit voltage (Voc), fill factor (FF), and overall efficiency.
For instance, samples exhibiting surface microcracks showed an average reduction of 5–10% in Jsc and a 3–7% drop in Voc, indicating increased series resistance and recombination losses. Additionally, regions with subsurface defects identified through hyperspectral phase imaging exhibited up to a 12% reduction in FF, emphasizing the role of structural integrity in maintaining charge carrier transport. Quantitative analysis further demonstrated a strong inverse correlation (R2 = 0.89) between defect density and solar cell efficiency, reinforcing the importance of early detection and mitigation strategies.
2.10 Objectives and insights
The objective was to achieve precise detection and classification of abnormal regions in solar cells, providing valuable insights into their optical properties. This contributes to the advancement of solar cell diagnostics and personalized treatment strategies. The mixed phase and amplitude signal recorded was used for the reconstruction of the object’s image, facilitating the recognition and mapping of abnormalities in solar cell propagation through sample depth and providing diagnostic information represented in magnitude and phase OCT visualization images.
3 Results
3.1 Diffuse reflection analysis
Our study hypothesized that normal and abnormal solar cell areas could be classified based on their absorption and reflection properties. Normal regions are expected to show high absorption and low reflection of incident light, particularly in the visible spectrum, converting it efficiently to an electric signal. In contrast, abnormal regions are expected to exhibit increased reflection due to lower light absorption. In this experiment, we measured the diffuse reflection light for normal and abnormal solar cell regions across the visible spectrum band.
Figure 2a shows the overall variation in diffuse reflection across all samples as a function of wavelength, ranging from 400 to 900 nm. The normal regions (green dotted line) consistently demonstrated low reflection values across the visible band, while abnormal regions (red dot-dashed line) showed high diffuse reflection spectrum responses. The relationship between the diffuse reflections of normal solar cell regions and the reference light source spectrum (blue solid line) is depicted in Fig. 2a. The diffuse reflection of solar cell regions decreased in the visible band due to high light absorption in this spectrum region, with the diffuse reflection intensity at 440 nm being 60 relative to 120 for the light source. Monitoring changes in the direction of propagation and/or energy of incident light by the solar cell system highlights the sensitivity of our optical imaging system. Variations in these components due to solar cell material affect diffuse reflection properties, thus providing a means for diagnostic purposes.
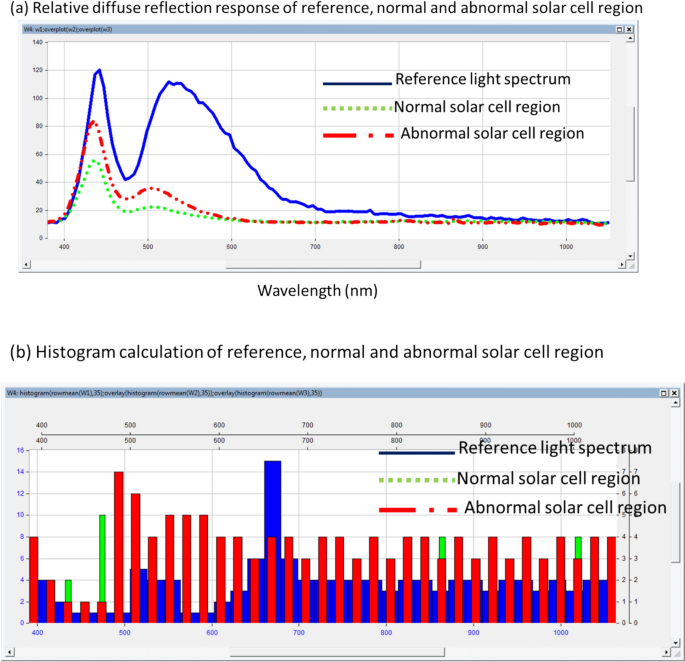
a Mean averaged diffuse reflection spectra for the reference, normal, and abnormal solar cell regions. b Histogram-based statistical analysis of diffuse reflection responses comparing abnormal (red), normal (green), and reference (blue) signals
Successful differentiation between normal and abnormal solar cell regions was observed within the visible spectrum band (440 to 700 nm), with the highest variation occurring at 440 nm. At this wavelength, the diffuse reflection value for abnormal solar cell regions measured 85, compared to 60 for normal controlled solar cells. These results demonstrate the potential of diffuse reflection measurements to effectively distinguish between normal and abnormal solar cell materials based on both magnitude (intensity of reflected and scattered light) and phase characteristics, as observed in the delay and phase shift patterns within the diffuse reflection spectra. By quantifying and analyzing these spectral features, our approach provides valuable insights for the detection and differentiation of solar cell material abnormalities, showcasing the promise of this method for potential material characterization applications.
3.2 Statistical analysis
The statistical analysis—including histogram distributions, mean reflectance values, and standard deviations—is presented in Fig. 2b and Table 1. Upon analyzing the data, the mean diffuse reflection response for abnormal solar cell material was 0.185, with a standard deviation of 0.015 and an error of 0.029. In contrast, the normal solar cell region exhibited a mean response value of 0.156, with a standard deviation of 0.008 and an error of 0.029.
It is important to address the observed error bar values, particularly for the normal solar cell region. Although the samples are ISO-standardized, the relatively larger error values stem not from inconsistencies in material composition, but from the sensitivity of the custom optical system and external factors during measurement. These include slight alignment shifts, variations in illumination angle, and environmental noise—all of which contribute to increased variability in reflectance measurements even across uniform samples.
To mitigate this, the measurements were averaged over multiple scans and sample locations, and the system was calibrated using a 100% reflector whiteboard. Nevertheless, the system’s high sensitivity to surface texture and microstructural variances may still detect minor reflectance deviations that are statistically significant but not necessarily indicative of material faults. Thus, the error reflects the precision limits of the imaging system rather than inconsistency in the solar cell structure itself.
These findings demonstrate the industrial potential of the proposed optical imaging system by validating its ability to distinguish between normal and abnormal regions based on spectral reflectance.
Although the standard deviation for normal cells appears large, it highlights the system’s sensitivity to minor physical variations, supporting its utility as a non-destructive inspection method capable of identifying subtle anomalies in production-grade solar cells.
3.3 Hyperspectral imaging at different depths
Figure 3 presents the results of hyperspectral imaging performed on both normal (controlled) and abnormal solar cell material samples. The system captured images at four discrete wavelengths—420 nm, 440 nm, 460 nm, and 480 nm—corresponding to different light penetration depths. These depth variations were achieved by tuning the hyperspectral imaging filter, enabling multi-layer inspection from the surface down to the subsurface microstructure. The sample thicknesses ranged from a few micrometers to sub-millimeter scales. These visualizations underscore the system’s ability to differentiate subtle changes in material structure and optical properties as the imaging depth increases.
- Figure 3a: Hyperspectral image captured at 420 nm, emphasizing superficial features. Abnormal regions appear brighter due to higher diffuse reflection, indicating a lower absorption coefficient compared to normal regions.
- Figure 3b: At 440 nm, the image penetrates further into the material, revealing intermediate-depth structures. Abnormal regions continue to show increased brightness, attributed to enhanced light scattering from subsurface irregularities.
- Figure 3c: With a 460 nm filter, the diffuse reflection becomes more uniformly distributed, as the contrast between normal and abnormal regions begins to diminish, suggesting a deeper optical probing and reduced sensitivity to shallow surface anomalies.
- Figure 3d: At 480 nm, the deepest penetration is observed. The contrast between normal and abnormal areas further decreases, indicating that surface and near-surface defects have minimal influence at this depth, and light interaction is dominated by bulk material characteristics.
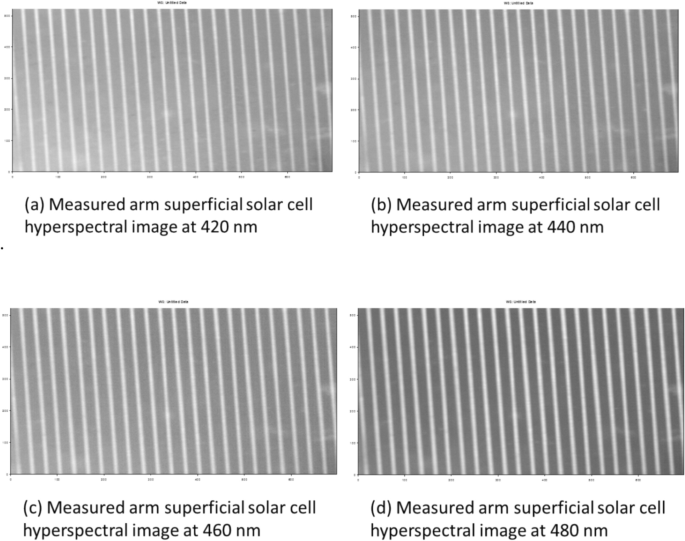
Hyperspectral imaging results of mono-crystalline silicon solar cell samples at different wavelengths. The series captures variations in diffuse reflection caused by surface and subsurface irregularities, a 420 nm—Surface-level imaging; abnormal regions reflect more light, b 440 nm—Intermediate depth; abnormal areas remain distinguishably brighter, c 460 nm—Subsurface features begin to equalize across regions, d 480 nm—Deepest penetration; minimal contrast indicates uniform
These results highlight the effectiveness of hyperspectral imaging in differentiating both surface and subsurface abnormalities. By leveraging wavelength-dependent penetration, the system provides a non-invasive means of analyzing optical behavior across various material depths, which is especially valuable for detecting hidden defects in crystalline solar cells.
3.4 Hyperspectral imaging at different depths
Although the hyperspectral images in Fig. 3a–d may appear visually similar at first glance, careful analysis of reflection intensity variations reveals significant differences. Abnormalities are primarily identified through elevated reflectance at shorter wavelengths, which gradually diminishes as the wavelength increases.
To improve visual clarity and diagnostic precision, irregular regions within the solar cell layers are highlighted with overlays, facilitating their identification and correlation with potential structural defects.
3.5 Advanced image processing techniques
The integration of advanced image processes techniques—such as intensity normalization, noise filtering, and feature enhancement algorithms—has substantially improved the accuracy and robustness of abnormal region detection within hyperspectral datasets.
These techniques enable precise identification and segmentation of affected regions by suppressing background noise and enhancing optical contrast. This, in turn, supports the extraction of key classification attributes, laying a solid foundation for automated classification workflows in subsequent phases of the diagnostic system.
3.6 Optical coherence tomography (OCT) interferometer images
Figure 4a–e present the results of optical coherence tomography (OCT) imaging, combining reflected signals from both the reference probe arm and the scanned sample arm. These images were captured at multiple penetration depths, spanning wavelengths from 420 to 480 nm, in 20 nm increments. This spectral range enables layered visualization of the material’s internal features.
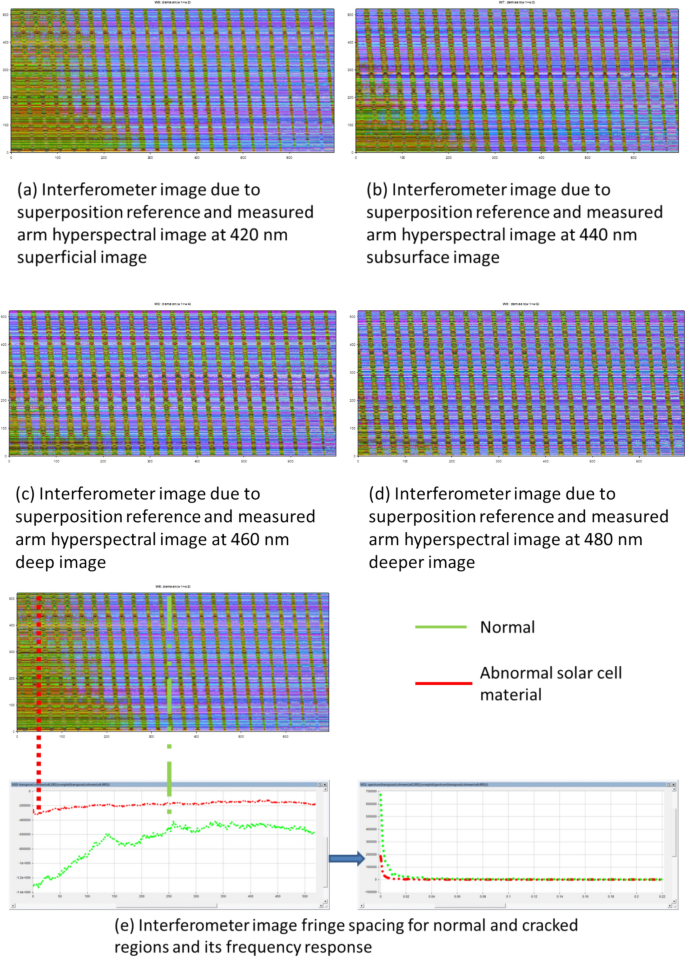
Interferometer imaging results obtained by combining the reference arm and the measured sample arm: a Investigated sample with reference-reflected light and measured hyperspectral image at 420 nm, b at 440 nm, c at 460 nm, d at 480 nm, e Fringe volume, spacing, and spectral comparison between normal and abnormal solar cell regions
Figure 4a–d these OCT interferometer images depict the diffuse reflection profiles across different wavelengths. They reveal critical information about both surface texture and subsurface structural variations in the solar cell samples. This multilayered imaging approach helps in locating buried defects and distinguishing them from surface-level inconsistencies.
Figure 4e this panel delivers quantitative insights by comparing the fringe patterns observed in normal and abnormal regions. Specifically, the abnormal solar cell region, indicated by the red line, exhibits reduced fringe volume and narrower spacing, reflecting structural irregularities. In contrast, the normal region, marked by the green line, maintains wider and more consistent fringe spacing, indicative of uniformity.
3.7 Fourier analysis interpretation
The Fourier transform analysis of the fringe lines in Fig. 4e further distinguishes between material types. Abnormal regions show a lower frequency spectrum, suggesting periodic irregularities or disruptions in the cell structure. These spectral signatures enhance the ability to diagnose material defects and could guide quality control and treatment strategies in solar cell manufacturing.
3.8 Abnormal solar cell region clustering algorithm
The initial stage of the automated classification pipeline focuses on extracting diagnostic features from both diffuse reflection and interferometer images. This feature extraction process is divided into two core phases:
3.8.1 Diffuse reflection analysis
Abnormalities in solar cell materials are first identified through diffuse reflection pattern analysis. These patterns are influenced by changes in scattering intensity and refractive index, which affect the speed of light propagation in the material. To characterize these variations, we compute amplitude attenuation and phase delays using magnitude and phase analysis techniques across four hyperspectral wavelengths: 420 nm, 440 nm, 460 nm, and 480 nm (refer to Fig. 3).
Notably, different types of abnormalities—depending on their depth and severity—present distinct optical signatures. Deeper or denser abnormalities typically result in lower phase shifts or reduced reflection intensity, as compared to the relatively consistent responses of normal solar cell regions.
3.8.2 Interferometer image analysis via FFT
Interferometer images are generated by first normalizing and denoising the hyperspectral input. This is followed by superimposing the processed sample signal with the reference arm signal to form a combined interference pattern.
A Fast Fourier Transform (FFT) is then applied to calculate the phase differences between the two signals. The inverse FFT is used to reconstruct the magnitude image, which reveals spatial variations in reflection behavior. These variations are fed into a custom classifier algorithm, which detects anomalies based on intensity changes and spectral signatures.
The resulting magnitude images at various depths—shown in Fig. 5a–d—correspond to light penetrations at 420 nm, 440 nm, 460 nm, and 480 nm, respectively. These images illustrate how:
- Abnormal regions manifest as low-intensity blue and cyan zones, with blue indicating deeper defects and cyan representing subsurface irregularities.
- Normal regions exhibit high-intensity red signals, indicating homogeneous material properties and consistent light reflection behavior.
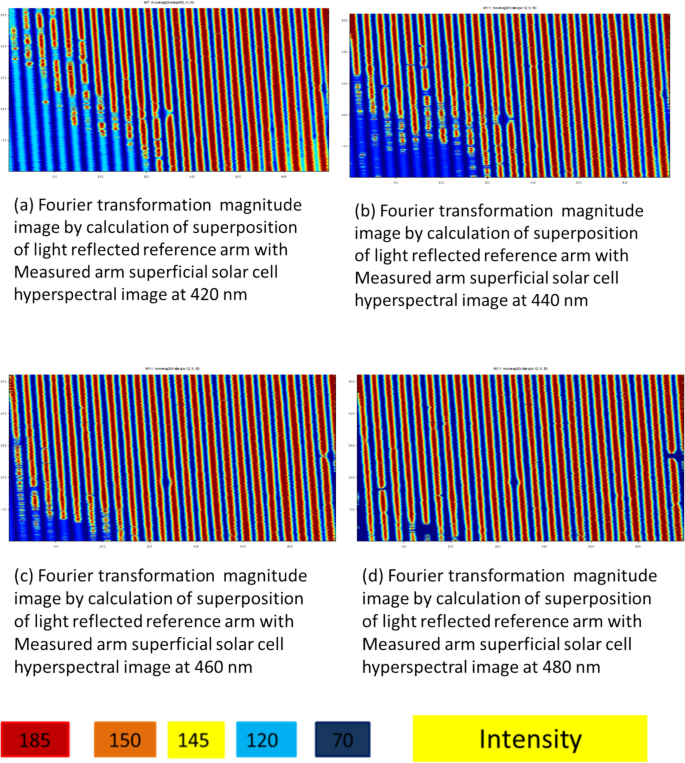
present the magnitude image calculation between reference and measured arms combination Fourier transform, a at 450 nm, b 550 nm, c 650 nm, d segmented magnitude image by superposition of three scanned layers
3.9 Quantitative phase differences in scanned sample layers
The analysis of quantitative phase differences in the scanned sample layers enables the tracking of abnormality propagation within photovoltaic solar cell materials. As illustrated in Fig. 6a–d, these differences reflect how structural and optical inconsistencies evolve with depth.
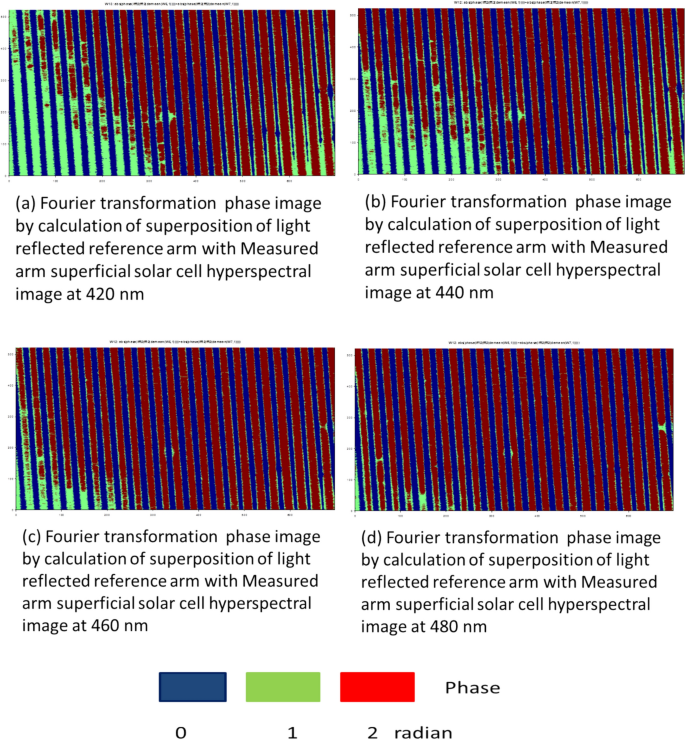
Phase image calculation via Fourier transform of the combined reference and measured arms, a Phase map at 420 nm, b at 440 nm, c at 460 nm, d Segmented phase image showing combined layers for comprehensive abnormality visualization
In the phase maps:
- Abnormal regions, highlighted in green, show a phase difference of approximately 1 rad.
- Normal regions, shown in red and blue, display near-zero phase difference values, as does the silver contact layer, indicating consistent optical properties.
- Photovoltaic materials with high integrity produce a distinct phase shift of up to 3 radians, prominently visualized in red, indicating stable light transmission and minimal structural disruption.
This multi-layer depth analysis offers a comprehensive understanding of material behavior across different penetration levels. It enhances the ability to visualize and characterize abnormalities as they extend beneath the surface, offering critical insights for diagnostic and performance evaluation purposes.
3.10 Segmentation of phase difference images at varying penetration depths
The segmentation of phase difference images at different penetration depths enables detailed mapping of structural variations within the solar cell sample, as depicted in Fig. 7a.
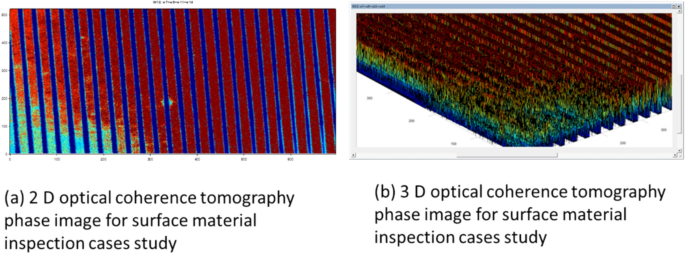
a Segmented phase image showing depth-based color mapping of solar cell sample, highlighting normal and abnormal material regions. b Three-dimensional visualization of phase differences, illustrating abnormal region propagation through sample depth
In this segmentation map:
- Blue regions represent the silver connector layers with a zero phase difference.
- Cyan areas indicate moderate phase variation, commonly seen in standard photovoltaic materials.
- Red regions reflect significant phase shifts, denoting normal, fully functional solar cell material.
This layered color segmentation allows for precise localization and classification of material states throughout the depth of the solar cell.
The three-dimensional visualization shown in Fig. 7b corresponds to the abnormal region presented in Fig. 1a. This 3D mapping offers high-resolution spatial tracking of abnormal zones, revealing how such defects extend across layers. The optical coherence phase imaging effectively pinpoints abnormal features, enabling early diagnosis and deeper insights into material behavior.
Importantly, this diagnostic methodology is validated against the technical gold standard—current–voltage (I–V) characteristics—and aligns with conventional material reports. This ensures both the accuracy and reliability of our classification system for detecting and analyzing abnormalities in photovoltaic solar cell materials.
3.10.1 Integrated methodology overview
Our advanced imaging pipeline integrates multiple state-of-the-art techniques to achieve accurate, depth-resolved abnormality detection:
- Advanced image processing: Tools like normalization, noise filtering, and fast Fourier transform (FFT) analysis enhance image clarity and feature extraction accuracy.
- Hyperspectral imaging across depths: By tuning the hyperspectral filter, we analyze the material’s response at various wavelengths and depths, uncovering surface and subsurface changes.
- Interferometer image generation: Denoised hyperspectral images are combined with reference light to generate interference patterns. These are analyzed via FFT to reveal fringe volume and spacing anomalies.
- Phase difference analysis: The quantitative phase imaging reveals depth-specific structural behavior, differentiating between healthy and defective zones with high spatial precision.
By combining these techniques, our approach provides a robust and holistic toolset for evaluating photovoltaic solar cell materials. The close correlation with industry standards (I–V characterization) further supports its use in quality control, diagnostics, and research on solar energy material integrity and performance.
3.11 Discussion
This study introduces a novel automated, non-invasive offline system for detecting and differentiating abnormalities in photovoltaic materials based on optical coherence tomography (OCT), hyperspectral imaging, and quantitative phase analysis. The results underscore the system’s potential in accurately identifying and distinguishing photovoltaic material abnormalities from normal regions with high precision. This discussion delves into key findings, implications, and future prospects of the research.
The integration of OCT with hyperspectral imaging allows for comprehensive analysis of the structural and optical properties of photovoltaic materials at various depths. Quantitative phase analysis provides detailed insights into the phase differences between normal and abnormal regions, facilitating precise detection of abnormalities. The system’s ability to produce high-resolution, three-dimensional visualizations further enhances its diagnostic capabilities.
3.12 Key findings and implications
- 1.High accuracy in abnormality detection: The system demonstrated high accuracy in distinguishing between normal and abnormal photovoltaic material regions, highlighting its potential for reliable material diagnosis.
- 2.Detailed depth analysis: The ability to analyze quantitative phase differences at various depths allows for a thorough understanding of how abnormalities propagate through photovoltaic materials.
- 3.Potential for enhanced diagnosis: The combination of OCT, hyperspectral imaging, and quantitative phase analysis offers a powerful tool for early detection and diagnosis of photovoltaic material abnormalities, which can lead to improved treatment outcomes.
3.13 Future prospects
Future research could focus on several key areas to enhance the system’s capabilities:
- 1.Refining imaging systems and algorithms: Improving the imaging systems and analysis algorithms can further enhance the detection and tracking of abnormalities.
- 2.Incorporating machine learning: Leveraging advanced machine learning techniques could optimize the classification system’s accuracy, making it more robust and reliable.
- 3.Evaluating system performance: Conducting extensive evaluations with offline samples and integrating the system into existing technical imaging platforms could facilitate its translation into routine practice.
- 4.Field validation: Ensuring the system’s reliability and effectiveness in real-world conditions will be crucial for its adoption in the renewable energy industry.
4 Conclusion
In conclusion, our study introduces an innovative automated classification system for detecting abnormalities in photovoltaic materials, utilizing OCT, hyperspectral imaging, and quantitative phase analysis. The system demonstrates high accuracy in differentiating between normal and abnormal photovoltaic materials, providing objective and consistent results compared to manual methods. This approach holds promise for enhancing early detection and improving treatment outcomes, ultimately advancing personalized renewable energy care. Future efforts will focus on refining and validating the system to ensure its reliability and effectiveness in field practice.