Article Content
Abstract
Forest degradation has gained global attention for its role in exacerbating biodiversity loss and climate change, yet indicators, baselines, and thresholds of degradation remain under debate. Maintaining key forest characteristics within bounds of natural variability offers a strategy to sustain ecological integrity and to provide potential measures of degradation. We used forest inventories, satellite-derived information, and government planning guidelines to evaluate five potential indicators of forest degradation during 2012–2021 for public forests in boreal northeastern Ontario, Canada. We tested two contrasting hypotheses (natural disturbance emulation vs. timber maximization) by comparing observed values against those from two reference landscapes: one shaped by empirical estimates of natural fire disturbance regimes and one by forest management aimed at maximizing timber volumes. All indicators fell outside bounds of natural variability from natural landscapes and were more consistent with timber maximization. Specifically, compared to natural landscapes, some forest types were disturbed at substantially higher rates; the proportion of forest >100 years old was significantly lower (22.4% on average vs. 53.5% in a natural landscape); and modelled boreal caribou and American marten habitats were highly fragmented and substantially reduced (12% for boreal caribou and 36% for American marten vs. corresponding percentages of 73% vs. 76% in a natural landscape). Government planning targets for natural variability targets also were lower than, and did not overlap with, empirical estimates. Continued degradation of biodiversity and ecological services is likely unless management approaches are altered.
Explore related subjects
Discover the latest articles and news from researchers in related subjects, suggested using machine learning.
- Applied Ecology
- Forestry
- Forest Ecology
- Forestry Management
- Restoration Ecology
- Boreal Ecology
Introduction
Forest degradation has gained widespread global attention due to its role in exacerbating both biodiversity loss and climate change. Recent national and international commitments highlight this growing recognition, including the Kunming-Montreal Global Biodiversity Framework (GBF 2022), the Conference of the Parties 28 Global Stocktake (UNFCCC 2023), and marketplace standards implemented by the European Union (EC 2023). With many countries having committed to halting and reversing forest degradation, a wide range of indicators of degradation have been proposed. Some authors have suggested that sustainable forest management can serve as reference condition against which degradation can be assessed (e.g., Thompson et al. 2013; Vásquez-Grandón et al. 2018); however, the ecological sustainability of forest management is itself a hypothesis that requires ongoing monitoring and testing (Noss 1999).
While forest degradation in tropical and subtropical forests has received significant attention (e.g., Bourgoin et al. 2024), recognition is growing that other forest types have also been degraded and face ongoing risks. Boreal forests are globally and regionally significant, providing habitats for numerous wildlife species, cultural and traditional products, recreational and esthetic values, water filtration, and significant carbon storage and sequestration (Bradshaw and Warkentin 2015; Harris et al. 2021; Pohjanmies et al. 2017). They are also a major wood fiber resource, accounting for ~33% of sawn wood and 26% of paper and paperboard exports globally (Burton et al. 2010). However, prioritizing their use for wood resources has the potential to lead to forest degradation. For instance, in Finland Triviño et al. (2017) found that management to maximize timber values retained only 39–64% of biodiversity values and 65% of carbon values. Over time, forest harvesting can alter natural stand-age distributions, particularly in the oldest age classes, due to differences between timber harvesting and natural fire disturbance patterns (Cyr et al. 2009). To illustrate, stand-replacing fires in Canada occur in the range of every 20 to 500 years, whereas harvest frequencies typically range from 40 to 100 years (McRae et al. 2001).
In Canada, which contains approximately 28% of the world’s boreal zone, industrial logging now occurs in much of the southern boreal region, which has resulted in decreases in the amounts of mature and old forests. In Quebec for example, Bouchard and Pothier (2011) observed declines in the amounts of forest >60 years old throughout the 20th century; Cyr et al. (2009) found that forest >100 years old now covered <15% of their study area compared to historic estimates of 30–79%; Imbeau et al. (2015) found in 88% of land districts that the percent area covered with tall, dense forest habitats was 51% in 2001 compared to 65% in historical estimates; and Bergeron et al. (2017) found in 2010 that forest >100 years old covered 21–28% of their study area compared to natural (fire only) estimates of 40–58%. Most recently in Quebec and Ontario, Mackey et al. (2024) reported that 28% (14.0 M ha) of the managed forest had been logged recently (1976–2020) and that the remaining relatively old forest (>100 years old) was highly fragmented. The loss of mature and old forests, especially coniferous ones, and associated increases in early-successional forests and road networks, have been key drivers of declines of boreal caribou (Rangifer tarandus caribou) populations, which are now Threatened under the Canadian Species at Risk Act (ECCC 2020; Johnson et al. 2020; Kittle et al. 2017). Although less well documented, this loss of old and mature forests also has led to reductions in abundances of a key furbearer, American marten (Martes americana; e.g., Bridger et al. 2016). It also has important implications for global climate change: landscape-level models of boreal forest management from a timber perspective indicated 30–50% declines in carbon stocks relative to fire-dominated, natural disturbance regimes (Kurz et al. 1998; Malcolm et al. 2020).
These findings raise important questions about whether forest management policies being implemented by governments are sustaining biodiversity and ecological services, thereby preventing forest degradation. A common strategy is to design forest management so that forest ecosystems remain within “bounds of natural variability” (e.g., Bergeron et al. 2007; Landres et al. 1999). The premise here is that because the biota is adapted to avoid or take advantage of natural disturbances, it will persist if anthropogenic disturbances emulate natural disturbances (Hunter 1993). The boreal forests of Ontario serve as an important case study, where 22.5 M ha of forests on public (Crown) lands are managed for fiber resources under the authority of the provincial government. In this region, forest harvesting (primarily clearcutting) is explicitly designed to emulate disturbance regimes from stand-replacing fires, the primary non-anthropogenic disturbances in these forests (OMNR 2014). In fact, emulation is required by law, with the second principle of Ontario’s Crown Forest Sustainability Act (CFSA 1994) stating that “The long term health and vigor of Crown forests should be provided for by using forest practices that, within the limits of silvicultural requirements, emulate natural disturbances and landscape patterns…”. Boreal forest planning policies use this “coarse-filter” approach for biodiversity conservation (Elkie et al. 2019); additional “fine-filter” approaches are used for species of conservation concern, such as boreal caribou (Armstrong et al. 2003; Elkie et al. 2018). Provincial management guides, including policies at both local (stand and site scale [OMNR 2010]) and landscape scales (OMNR 2014; see also Elkie et al. 2018, 2019), hypothesize that the prescribed forest management—designed to remain within the bounds of natural variability as defined by these policies—will successfully emulate key characteristics of natural disturbances. To our knowledge, however, this hypothesis has been insufficiently tested to date.
Here, our objective is to examine whether forest management in northeastern Ontario, Canada, is sustaining ecological integrity or contributing to forest degradation. We do this by testing two contrasting hypotheses. The first, the emulation hypothesis, reflects the intent of Ontario’s policy framework: that forest management practices are successfully emulating natural disturbance regimes, keeping anthropogenic effects within empirically derived bounds of natural variability. The alternative hypothesis, the timber-maximization hypothesis, is that management outcomes are consistent with a strategy of maximizing fiber volumes; that is, forest management is prioritizing fiber yield over ecological emulation. Although forest policy in Ontario mandates the emulation of natural disturbance, in practice, outcomes may diverge due to a variety of factors, such as the prioritization of economic objectives, practical limitations in implementation, and/or inconsistencies between policy intent and operationalization in practice.
To evaluate these hypotheses, we compared five ecological indicators measured during the period 2012–2021 with levels of the indicators in two reference landscapes: (1) those under natural fire regimes and (2) those focused on maximizing timber volumes and thereby transforming natural forests into regulated (normalized) forests (see details in section “Evaluating the hypotheses”). The five indicators were: (1) annual rates of forest disturbance; (2) forest age distributions, with a focus on forests >100 years old; modeled habitat supply for (3) boreal caribou and (4) American marten, which specialize on mature and old forests and have been characterized as umbrella species (e.g., Bichet et al. 2016; Mortelliti et al. 2022); and (5) landscape-scale policy targets based on emulation of natural variability as defined by the government (OMNR 2014). We use two reference natural landscapes: one derived from mapping of historic forest ages near the study area and another from a statistical model of natural fire regimes.
If the emulation hypothesis holds, we expect current levels of disturbance, old forest, species habitat, and policy targets to fall within bounds of natural variability. In contrast, if outcomes align with the timber maximization hypothesis, we expect to see a shift toward younger, more regulated forest conditions, with reduced old forest and habitat for mature-forest species. Even though industrial clearcutting in the region began only about 60 years ago, signs of this transition should already be evident. Consistent deviations from natural variability would suggest the emulation hypothesis does not hold. However, if observed conditions also diverge from what would be expected under a timber maximization strategy, this would suggest a mixed or inconsistently applied management approach.
Methods
Study Area
The 7.9 M ha study area was comprised of eight Forest Management Units (FMUs) in boreal northeastern Ontario, Canada: Gordon Cosens Forest, Hearst Forest, Magpie Forest, Martel Forest, Nagagami Forest, Pineland Forest, Romeo Malette Forest, and Spanish Forest (Fig. 1). Most of the area overlaps with Ontario’s Lake Abitibi ecoregion (Region 3E; Crins et al. 2009) characterized in the north by lacustrine and water-worked deposits from glacial Lake Ojibway with large areas of black spruce interspersed with hardwood, mixedwood, and jack pine stands on drier sites. It also extended further south into the Lake Temagami ecoregion (Region 4E), where shallow tills overlaying Precambrian bedrock are typical and several tree species of the more southerly Great Lakes-St. Lawrence forests occur as scattered individuals or patches (Rowe 1972). Mean annual temperatures for ecoregion 3E were 0–2 °C and annual precipitation was 726–1149 mm (Mackey et al. 1996).
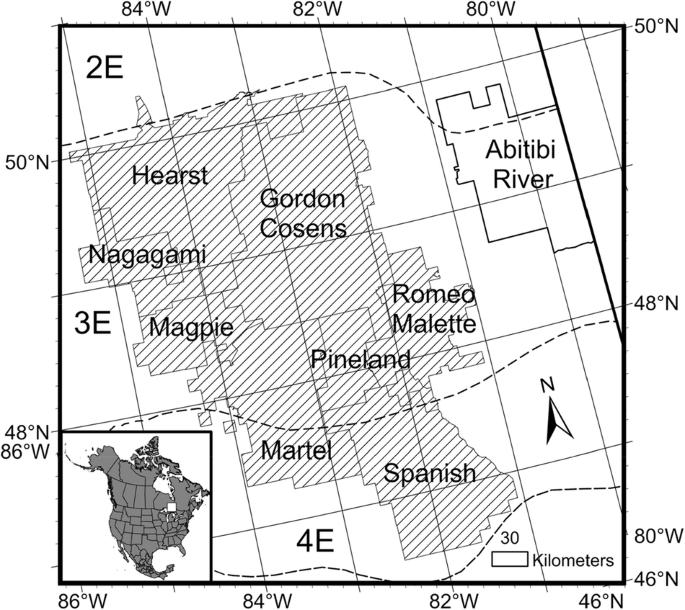
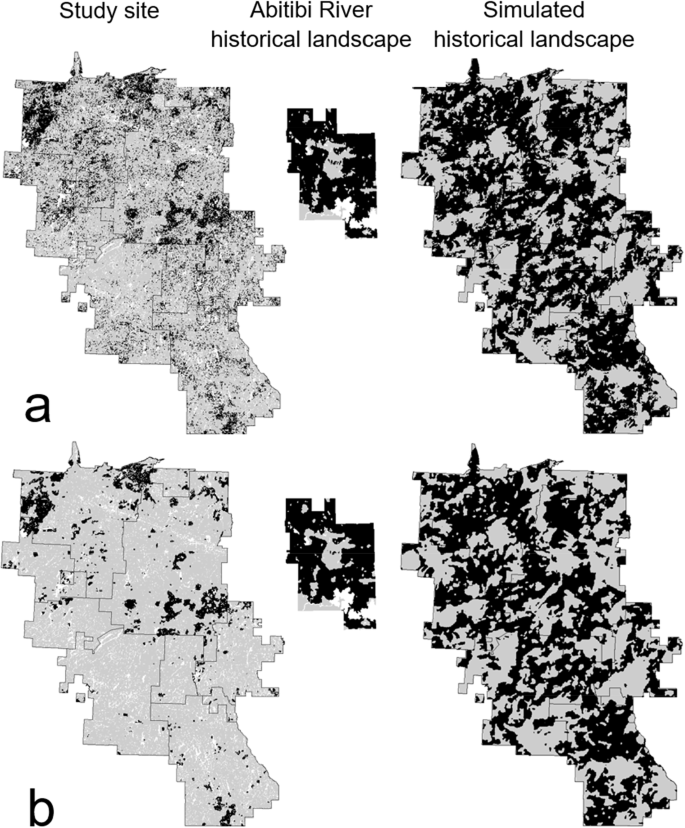
Map of northeastern Ontario, Canada, showing the eight forest management units of the study area (cross-hatched) and the Abitibi River historical landscape. Also shown are Ontario’s ecoregions (dashed lines; 2E, 3E, and 4E) and portions of the provincial boundary (thick black line). The inset of North America and Mexico at lower left shows the map location (white square)
The region has been the site of large-scale forest harvesting since the early 1900s. Clearcutting using horses for extraction occurred near towns and mills up to approximately the early 1960s, at which point industrial, mechanized-based clearcutting started and continues to the present. The most important historic, stand-replacing disturbance in the region was fire, but has now been replaced by clearcutting (Venier et al. 2018).
Evaluating the Hypotheses
We compared observed levels of our indicators against those from two “reference” landscapes: 1) those under natural fire regimes and 2) those under management regimes in which clearcutting is the dominant forestry practice and results in regulated (or normalized) forests (Bergeron et al. 2007; Gauthier et al. 2009; Van Wagner 1978). The latter is a well-known management scheme focussed on maximizing sustained yields of timber. We characterized the two regimes in standard ways (Van Wagner 1978). In natural landscapes where fires occur stochastically and independently of forest age, stand ages follow a geometric distribution (Van Wagner 1978). Here, the average proportion of the forest burned per year is the reciprocal of the fire return interval C (the average interval between fires at the same location; Van Wagner 1978). This natural age distribution contrasts strongly with that from the simple, area-based strategy to maximize wood volumes via clearcutting (Gauthier et al. 2009; Van Wagner 1978). As a single stand ages following a stand-replacing disturbance, we expect stand volume as a function of time to be sigmoidal, starting at zero at time zero, increasing exponentially for a time, and then flattening out to an asymptote. To maximize harvest volume over time, the stand is harvested where the steepest line through the origin intersects the curve (i.e., where volume/time, the slope of the line, is maximized). The intersection point is the rotation age (R), which is typically thought to be 80–100 years in boreal forests, depending on species composition. A simple approach to provide a continuous supply of such maximized volumes is to divide the forest into R blocks, harvest one block per year for R years, and then harvest them again in the same order. At the end of R years, all blocks will have been harvested once and all will be R years old when subsequently re-harvested. This forest after R years is termed a “regulated” forest. Every forest age is equally represented up to the maximum age of R. If one wants to maximize harvest volume during the transition from a natural to a regulated forest, a simple approach is to harvest the oldest forests first (Cyr et al. 2009; Malcolm et al. 2020).
The effects of this transition from a natural to a timber-maximized forest, both from forest age and wildlife habitat perspectives, are dramatic. First, if the fire return interval, C, is greater than the rotation age, R, then the amount of forest disturbed per year on average is lower in natural forests compared to normalized ones. An empirical estimate of the average natural fire return interval in the study area was 160 years, meaning that 1/160 or 0.625% of the forest will be disturbed per year on average (see section “Historical landscapes” below for derivation of 160 years). By contrast, under a rotation age of 100 years, 1% is disturbed per year. Second, during the transition period, there will be a steady loss of old growth forest and its eventual liquidation by R years (Bergeron et al. 2007). In a landscape with a 160-year fire return interval, we would expect 53.5% of the forest to be older than 100 years, whereas in a normalized forest with a rotation age of 100 years, we expect no forest older than 100 years (Cyr et al. 2009; Van Wagner 1978). Cyr et al. (2009) estimated bounds of natural variability to the east of the study area for a fire return interval of 166 years (see section “Historical landscapes”) and found that such a regulated forest had no parallels in nature: even under their most liberal (“extended”) range of variability in natural landscapes, they found 30% of the forest to be older than 100 years. Because of the loss of old forests, the transition from a natural to a regulated forest can be expected to have strong effects on species that specialize on mature and old growth forests.
Historical Landscapes
The study area covered a relatively large geographical area, raising the possibility that it encompassed significant variation in historical fire regimes. A common approach in characterizing fire regimes has been to make use of ecoregions, with the idea that features used to define ecoregions are important in driving fire regimes, such as climate, topography, and tree species composition (e.g., Wotton et al. 2010). The study area included parts of ecoregions 3E and 4E (Fig. 1; LIO 2012), hence we investigated the possibility that the two ecoregions had different historic fire regimes. A small part of the study area (<1%) also extended further north into ecoregion 2E; for simplicity, it was assumed to be within ecoregion 3E.
For ecoregion 3E, several studies of historical fire regimes have been undertaken just to the east of the study area. Bergeron et al. (2001) used fire scars, ages of oldest trees, and historical fire records to estimate natural stand age distributions (and hence average fire return intervals) for four FMUs close to the provincial border between Ontario and Quebec (one in Ontario and three in Quebec) and Cyr et al. (2009) used dated charcoal deposits over a 6800-year period in sediments from three lakes 110 km east of our study area. The average fire return interval was the same in both studies (166 years; see Malcolm et al. 2020), hence we used it as our estimate for ecoregion 3E. The corresponding average annual depletion rate is 0.60%.
Because we were unable to find similar studies in southerly boreal forests in the vicinity of ecoregion 4E, we used an indirect approach for that ecoregion. The nearest study that we could find in similar forests was Heinselman (1973), who used fire scars, historical records, and estimated stand origin dates to map historical fires in the Boundary Waters Canoe Area (BWCA) of northern Minnesota, west of Lake Superior and bordering Ontario to the south. Tree species composition in BWCA was similar to that in ecoregion 4E; for example, Great Lakes—St. Lawrence species such as red maple (Acer rubrum), sugar maple (Acer saccharum), and eastern hemlock (Tsuga canadensis) were rare or absent and typical boreal species were common (Online Resource Appendix A). Annual areas of burns for the pre-fire-suppression period in BWCA deemed to have “good” records (1727–1910; Table 2 in Heinselman [1973]) indicated a fire return interval of 113 years. Our approach to estimate the 4E fire return interval was to use this estimate (113 years) as one point and the estimate for 3E (166 years) as another and then use “fire hazard” variables to linearly interpolate between the two. Fire hazard variables were fire weather variables from the Canadian Forest Fire Weather Index System (Van Wagner 1987), fuel hazard ratings, lightning flash densities, conifer composition, percent wetland area, and topographic roughness (Table 1; see Boulanger et al. [2013] for use of a similar set of variables). As an example of the interpolation, if the mean value for a fire hazard variable in region 4E was higher than in BWCA, say 10% of the difference between BWCA and 3E, then the interpolated fire return interval in 4E also would be 10% of the difference between 113 and 166 (i.e., 118 years). Based on data availability and sample size considerations, in some cases instead of calculating means for BWCA, we calculated means for Quetico Provincial Park (which bounded BWCA to the north) or Ontario ecoregion 4W (which included Quetico Provincial Park; Table 1).
Using the R library cffdrs (Wang et al. 2017), we calculated six fire weather variables annually (Fire Weather Index (FWI), Fire Fuel Moisture Code (FFMC), Duff Moisture Code (DMC), Drought Code (DC), Initial Spread Index (ISI), and Build-up Index (BUI) for weather stations available in ECCC (2025). We reduced the effects of climate change by using weather information only for 1990 or before. To calculate the variables, both hourly and daily measurements were required; however, stations with hourly data were rare (only 8 stations in 3E, 4E, and 4W). We wished to make use of the more abundant daily information if possible (36, 20, and 20 stations in 3E, 4E, and 4W, respectively), hence we tested if we could use the daily data to estimate the hourly data. Specifically, for stations that included both hourly and daily data, we calculated the yearly, station-specific fire weather variables by using either: 1) the daily and required hourly information or 2) the daily information and hourly variables estimated by use of multiple regressions on the daily data. Results from the two calculations were usually highly correlated (R2 values were 80.1 [FWI], 90.9 [FFMC], 97.8 [DMC], 99.2 [DC], 75.3 [DSR], 36.9 [ISI], and 98.1% [BUI]), hence we used all daily stations (in addition to the multiple regression parameters) to calculate the mean values of the fire variables in the three ecoregions. Fuel hazard ratings were downloaded from LIO (2023a). Average lightning flash densities for the three ecoregions for 1999–2018 were calculated from Kochtubajda and Burrows (2020; their Fig. 4). We derived two measurements of conifer composition. First, we calculated the percent of “treed conifer” land classes relative to (“treed conifer” + “treed deciduous”) land cover classes in LIO (2022a) for 3E, 4E, and Quetico Provincial Park. Secondly, because treed coniferous areas might also include bogs, which unlike increasing conifer cover might act to reduce fire hazard, we also calculated the percentage of conifer forests for just upland forests in 3E, 4E, and BWCA. Specifically, for the study area ecoregions, we used tree species composition from the Forest Resource Inventories (see section “Indicators” below), excluding lowland forest types (lowland hardwood, lowland conifer, bogs, and black spruce 1; see section “Boreal caribou” for information on these forest types), and calculated the average percent of the canopy that was coniferous. For BWCA, we used Ohmann and Ream (1971), Heinselman (1973), and Grigal and Ohmann (1975) to calculate percent coniferous basal area of upland forests. Percent areas of wetlands for 3E, 4E, and Quetico Provincial Park was calculated from LIO (2022a); specifically, the total area of marshes, swamps, fens, and bogs relative to the total land area. Finally, as a measure of topographic roughness, for 3E, 4E, and Quetico Provincial Park we calculated the ratio of topographic surface area to land area from the provincial digital elevation model (LIO 2023b).
The net results of these calculations were 12 fire hazard variables (Table 1). Two (fuel hazard and topographic roughness) could not be used for interpolation because they suggested that the fire hazard was higher in 3E than BWCA, which we knew to be incorrect. Among the remaining variables, fire weather variables were most numerous (6 of 10 variables); however, we thought that this was reasonable given that weather is arguably the most important factor determining regional fire activity for monthly time periods or longer (Coogan et al. 2021). The resulting interpolated fire return intervals for ecoregion 4E ranged from 112 to 164 years (Table 1). The average fire return interval was 140 years, which we used for ecoregion 4E (and the corresponding average annual depletion rate of 0.71%). Ecoregion 3E accounted for 80.3% of the study area, hence the average fire interval for the entire study area (weighted by the areas of the two ecoregions) was 160 years (with a corresponding average annual depletion rate of 0.625%).
For a fire return interval of 166 years, based on a 6,800-year record of charcoal deposits, Cyr et al. (2009) calculated two bounds of natural variability: 1) a “conservative range” (111–267 years) based on the distribution of mean fire return intervals over extended stable periods in the temporal record and 2) an “extended range” (82–419 years) based on 95% confidence intervals of the means. Cyr et al. (2009) considered modern-day disturbance regimes outside of these bounds to be “unacceptable” because similar natural regimes had existed in the past only for short periods of time. Although we were unable to calculate similar bounds for the fire interval of 160 years, we used an approximate method by calculating the differences of their upper and lower bounds from 166 and applying these same differences to 160. The resulting conservative bounds for the study area were 105–261 years and the extended bounds were 76–413 years. For comparison, conservative and extended bounds calculated in the same way for a 140-year fire interval (ecoregion 4E) were 85–241 years and 56–393 years.
To create spatially explicit models of forests under natural fire regimes, which was important for indicator assessment (see section “Indicators”), we used two methods. First, we used a historic fire map from Gauthier et al. (2002) for part of the Abitibi River Forest FMU located east of the study area (Fig. 1). Second, we modeled the natural fire regime for an area that extended 30-km beyond the study area extent (377 by 490 km; 18.5 Mha). In the model, we set the fire return interval and initial forest age in ecoregion 3E to 166 years and in ecoregion 4E to 140 years. We picked a fire polygon at random (with replacement) from Ontario in the spatially-explicit Canada fire database (NRCan 2024), placed its center at a random location in the study area, burned the forest in the polygon (i.e., re-set the forest to age zero), and continued this until the total area burned for the year in ecoregion 3E first exceeded 0.60% of the total area. We then continued to pick fires at random and placed them at random within ecoregion 4E until the total area burned for ecoregion 4E first exceeded 0.71% of the ecoregion area. We then increased the age of all the forest by 1 year and continued the annual burning in the same way for 1000 years. To ensure that the area burned after 1000 years was as intended (given the slight overshoot each year), we kept track of the total area burned in each ecoregion over time and adjusted each year’s ecoregion target to the amount expected for all years to that point. Our approach thus captured two key aspects of the fire regime: the fire return interval and the fire size distribution (Bouchard and Pothier 2011).
We further refined the model by varying the annual burn percentage. Specifically, from the fire database we calculated the coefficient of variation of annual percentages for five large ecoregions in Ontario’s boreal forest (LIO 2023c) and then used the average (1.59) to estimate the variance for our mean annual burn rates of 0.60% in ecoregion 3E (estimated variance = 0.91) and 0.71% in ecoregion 4E (estimated variance = 1.27). The five ecoregions were: Big Trout Lake (2W), Lake Abitibi (3E), Lake Nipigon (3W), Lake St. Joseph (3S), and Lake Wabigoon (4S). A two-parameter Weibull distribution provided a good fit to the variation in annual percentages within ecoregions, so we used it to model the distribution of annual percent burned (estimates of the Weibull shape and scale parameters for a burn rate of 0.60% were 0.652 and 0.440 and for a burn rate of 0.71% were 0.653 and 0.522, respectively, from the weibullpar function in the R mixdist package [Macdonald and Du 2018]). To construct 95 and 99% bounds of natural variability (based on confidence intervals for individual simulation results), we repeated the simulation 60 times. Bounds for the study area were constructed by considering only those parts of the simulated landscapes within the study area boundary; similarly, bounds for individual FMUs considered only those parts within individual FMU boundaries.
Indicators
We used the five landscape-level indicators to test the hypotheses outlined above in section “Evaluating the hypotheses”. Ontario also has stand level targets, but they were beyond the scope of this study. Bounds of natural variability for relatively old forests (i.e., >100 years olds) were available from our approximations of the “conservative” and “extended” bounds from Cyr et al. (2009) and the simulation model and several of the indicators also could be calculated in the historical landscape. It was important to examine both rates of disturbance and old forest amounts because disproportionate harvesting of old, high-volume forests could disproportionately reduce quantities of old forests even under a relatively low rate of harvesting.
We calculated levels of indicators for the 10-year period 2012–2021 using: 1) Forest Resource Inventories (FRIs), which provided information on harvesting and fire up to 2003–2007 and are publicly available, and 2) additional spatially explicit datasets that provided more recent information (until 2021) on harvesting and fire (see below). The relatively old FRI information was used because it provided information on stand ages prior to more recent disturbances, which allowed us to calculate indicators over the 10-year period. In the FRIs, which the Ontario government and FMU licensees use to plan forestry operations both tactically and strategically, each forested stand is mapped, and attributes of the corresponding polygon provide information such as tree species composition, year of origin, and disturbance types. These datasets provided complete coverage of forests in the FMUs, including forests within protected areas. When forests are disturbed through harvesting or fire, the database is updated accordingly. We downloaded FRIs for FMUs in the study area (LIO 2022b; v. 2), except for the Romeo Malette Forest (RMF), which was not available for download and was obtained from the licensee. RMF had disturbance information (harvest only) up to 2003; the other FRIs had disturbance information (harvest and fire) up to 2006 or 2007. The result was 643,917 polygons of which 415,041 were forest. We took several steps to harmonize the FRIs and correct errors in them (see Online Resource Appendix B).
More recent datasets used were: government-issued FMU Annual Reports that mapped harvests for the period 2002–2021; National annual harvesting and fires at 30-m resolution for 1985–2020 (NTEMS 2024; see Hermosilla et al. 2016); year of gross forest canopy loss at 30-m resolution for 2002–2021 (GFW 2024; see Hansen et al. 2013); and annual fire polygons in the Canada National Fire Database for 1970–2020 (NRCan 2024). Because the GFW (2024) dataset did not distinguish between harvesting and fire, prior to using it we excluded any burned cells by overlaying fire information from the other datasets. When overlaying the datasets, if a cell had conflicting disturbance years, we used the most recent year and disturbance type. Additional details are provided in Online Resource Appendix B.
Rates of disturbance
We compared yearly disturbance rates, both for all forest and for specific forest types, against the forest area-weighted rates expected under natural fire regimes and the 1% rate expected for a 100-year normalized forest. Forest types were the same ones used in boreal caribou and marten habitat models (see section “Boreal caribou”).
Old forest
Following Cyr et al. (2009), we quantified the amount of relatively old forest (i.e., >100 years old), which could be reliably identified in the FRIs. For computational convenience, we aggregated the 30-m cells to 90 m resolution. If five or more of the underlying nine cells were relatively old forest, then the entire cell was set to be relatively old forest. We set cells to non-forest if five or more of the nine 30-m cells were not forest (as defined in the FRI). In addition to comparisons of the amount of relatively old forest, we also compared two thresholds of old forest occurrence between the study area and historical landscapes. First, for movement across the entire landscape, we used ≥59% retention as a critical threshold based on percolation theory (e.g., Desmet 2018). Second, for maintenance of ecological integrity, following Andrén (1994) we assumed that integrity loss was likely at old forest retentions of <10%, uncertain between 10 and 30%, and unlikely at ≥30%. Thresholds were calculated in moving circular windows at two spatial scales (500 and 20,000 ha) representing home range- and population-level scales for medium-sized mammals such as marten. The smallest scale could also be considered a population-level scale for small organisms.
We could statistically compare observed values against those from the simulated historical landscapes by calculating individual prediction probabilities for the study area and individual FMUs from the 60 simulations. We also compared observed old forest amounts against “conservative” and “extended” bounds of natural variability approximated from Cyr et al. (2009).
Boreal caribou
Boreal caribou formerly ranged throughout the entire study area (Schaefer 2003), but at present are extirpated from all but the northern and northeastern 19% of the study area, including parts of the Pagwachuan and the Kesagami boreal caribou population ranges (LIO 2019; OMECP 2024). They were a featured indicator in the landscape guide (OMNR 2014) and were one of five indicators of sustainability chosen by Drapeau et al. (2009) because of their responsiveness to losses of forest continuity at large spatial scales (hundreds to thousands of km2). We used the government models to define “used” and “preferred” habitat (specifically, Boreal Northeast parameters in the landscape planning guide [Elkie et al. 2018, see Online Resource Appendix C]). “Used” habitats were defined as stands of several coniferous forest types of at least a certain age. They were (with the age cutoff in parentheses): lowland conifer 1 (51 years), jack pine 1 (41), jack pine 2 (41), spruce 1 (61), black spruce 1 (41), and bogs (41). “Preferred” habitats were similarly defined based on a smaller set of coniferous forest types: jack pine 1 (61 years), jack pine 2 (61), black spruce 1 (101), and bogs (101). Forest types were calculated from Holloway et al. (2004; see Online Resource Appendix D). Following the approach in Environment Canada (2011), we additionally calculated habitat by excluding disturbed habitats, which included buffers around recent harvests, infrastructure, and roads. We defined “recent harvests” as those that were below the age cutoffs used in the caribou model. Buffers were 500 m, except for unsurfaced roads, where we used a more conservative buffer of 100 m (see Online Resource Appendix E). As described previously, we rasterized habitat amounts to 90-m resolution. We compared modeled habitat amounts and disturbances in the study area against those in the historical landscape. Gauthier et al. (2002) estimated historic stand ages, but did not provide overstory composition. As an approximate procedure, we used stand ages from Gauthier et al. (2002) and forest types from the Abitibi River FRI. In general, boreal forests are expected to become more coniferous as they age (e.g., Yemshanov and Perera 2002), hence this procedure likely underestimated habitat for species such as boreal caribou that use older, coniferous forests, because it assumed that present-day young, more deciduous forests were equally deciduous in the past.
Meta-analyses by Environment Canada (2011) and Johnson et al. (2020) indicated that increasing cumulative disturbances within boreal caribou ranges gradually and linearly decreased the probability of maintaining a self-sustaining population. Specifically, disturbances comprising less than 35% of caribou ranges were likely to be sustainable for boreal caribou, 35–45% were as likely as not to be sustainable, and disturbances of more than 45% were likely unsustainable. We used these levels for illustrative purposes to compare disturbance amounts between the study area and the historical landscape. Following recommendations in the landscape guide (OMNR 2014), we also quantified caribou habitat in 6000 and 30,000-ha moving windows.
American marten
American marten, which historically ranged across the entire study area, were a featured indicator in the landscape guide (OMNR 2014) and were chosen as one of five indicators of boreal management sustainability by Drapeau et al. (2009) based on scientific knowledge and their responsiveness to medium-scale forest fragmentation (several hundred hectares). We used the government model to define “suitable” habitat (specifically, the “NE marten models” link in Elkie et al. 2019; see Online Resource Appendix F). “Suitable” habitat was defined as coniferous (lowland conifer 1, jack pine 1, jack pine 2, white pine 1, mixed red and white pine, black spruce 1, spruce fir 1, and spruce pine1) and mixedwood (mixedwood 1 and 2) stands that were in a mature or old stage. Forest types were as described previously for boreal caribou and forest development stages, which varied as a function of forest age and forest type, were defined as in Online Resource Appendix G. Again, we aggregated 30-m cells to 90 m. The model also defined: 1) “suitable” habitat at individual home range scales (500 ha) based on a threshold of 80% or more suitable habitat and 2) “core” productive habitat at subpopulation scales (5000 ha) based on a threshold of 60% or more suitable habitat. Accordingly, we passed 500- and 5000-ha circular moving windows over the study area and determined those window centers that had at least 80% or 60% suitable habitat, respectively, in the surrounding window. We also calculated historical habitat amounts for the historical Abitibi River landscape (Gauthier et al. 2002) using the same habitat model and using the same definitions of forest types and forest development stages.
Policy directions in the government landscape guide
The landscape guide (OMNR 2014) provided management direction in the form of standards (mandatory direction), guidelines (mandatory direction allowing professional judgment), and best management practices (suggestions). It also provided explicit targets for “bounds of natural variability” based on the results of a simulation model. For region 3E, which included seven of the eight FMUs in the study area (all but Spanish Forest), it provided habitat amounts as of 2006 (“simulation Year 0”) and estimates of bounds of natural variability for three of the indicators used here (old forest and modeled habitat for boreal caribou and marten). These included ranges, 25th and 75th percentiles, and medians. The government definition of old forest was not a simple age-based cutoff, but instead varied with forest type (see Holloway et al. 2004). To permit comparison, we therefore used the government definition (hereafter termed “old-growth forest”) when comparing their natural variability estimates against our approximations from Cyr et al. (2009) and the Abitibi River historical forest. Specifically, the stand area-weighted average age of onset of the old-growth development stage in the seven FMUs was 109.4 years; hence, we calculated conservative and extended ranges of variability for forests >109 years old. We did this using the same method used by Cyr et al. (2009); that is, for a given fire return interval, the expected amount of forest >109 years old was calculated from Van Wagner (1978). In the landscape guide, habitat amounts and estimates of natural variability were given in absolute amounts (ha), but the total area of all forest was not provided. We could nonetheless compare estimates of natural variability in the guide against our historical estimates by expressing both relative to respective current habitat amounts. For example, we could calculate estimates of natural variability in the guide as percent differences relative to habitat levels in the guide from 2006; similarly, we could calculate estimates of natural variability and for the Abitibi River historical landscape as percentage differences relative to habitat levels that we calculated for 2006. This comparison was somewhat approximate because visual examination of figures in the guide showed that their land base excluded a few forest areas that were included in the FRI maps. As a result, we undertook the comparison only at the study area scale.
The landscape guide also laid out a suite of approaches aimed at ensuring the persistence of boreal caribou populations. In the context of our hypotheses of natural emulation and timber maximization, we evaluated the guide’s standards, guidelines, best management practices, and fine-filter policy directions termed “Dynamic Caribou Habitat Schedules” (Elkie et al. 2018; OMNR 2014). All data processing and modeling were undertaken in R (v. 4.3.2; R Core Team 2023).
Results
Rates of Disturbance
For 1986 through 2006, annual disturbances (including harvests and fire) in the study area exceeded the natural fire disturbance rates (0.60% for ecoregion 3E, 0.71 for ecoregion 4E, and the forest-weighted average of c. 0.625 for the study area). For a few years, they exceeded 1% (6 of 21 years; Fig. 2a). Disturbance rates were at or below natural disturbance rates before 1986 and after 2006. The exception was in 2012, when relatively extensive fires led to a disturbance rate of >1% per year. For coniferous forests, a similar pattern was evident, except that the annual disturbances for 1986 through 2006 approximated the 1% level and often exceeded it (12 of 21 years; Fig. 2b). Annual disturbances in deciduous forest approximated natural disturbance rates and only exceeded 1% once (Fig. 2c). During 1985 through 2006, harvests of the two jack pine forest types usually considerably exceeded the 1% rate, and the 1% rate was often exceeded for black spruce 1, spruce fir 1, and mixedwood 1 forests (respectively, 10, 13, and 11 of 22 years; Fig. 3). For the remaining forest types, natural disturbance rates were often exceeded, although white birch 1 annual disturbances were usually below them (31 of 42 years).
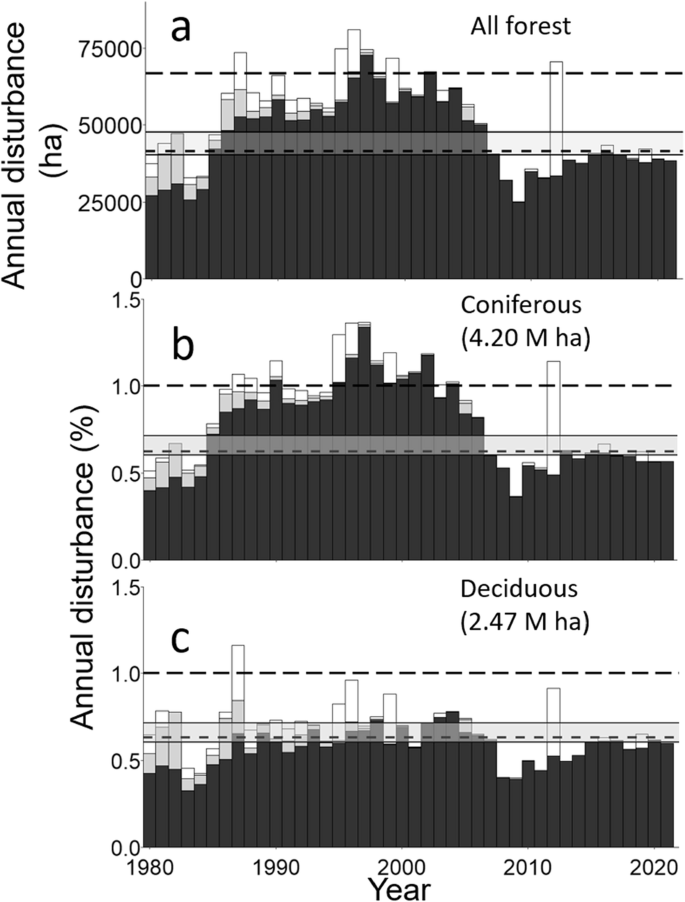
Annual areas disturbed by forest harvesting (dark gray), fire (white), and uncertain disturbances (light gray) for the study area in northeastern Ontario, Canada, excluding bogs. Disturbances are shown for all forest types (part a), coniferous forests (part b), and deciduous forests (part c). Horizontal lines indicate average annual disturbance rates for a 100-year harvest rotation (long dash), natural fire return intervals of 166 and 140 (solid lines), and a weighted average fire return interval for the study area (short dash) based on areas of forest in ecoregions 3E (166 year fire return interval) and 4E (140 year fire return interval)
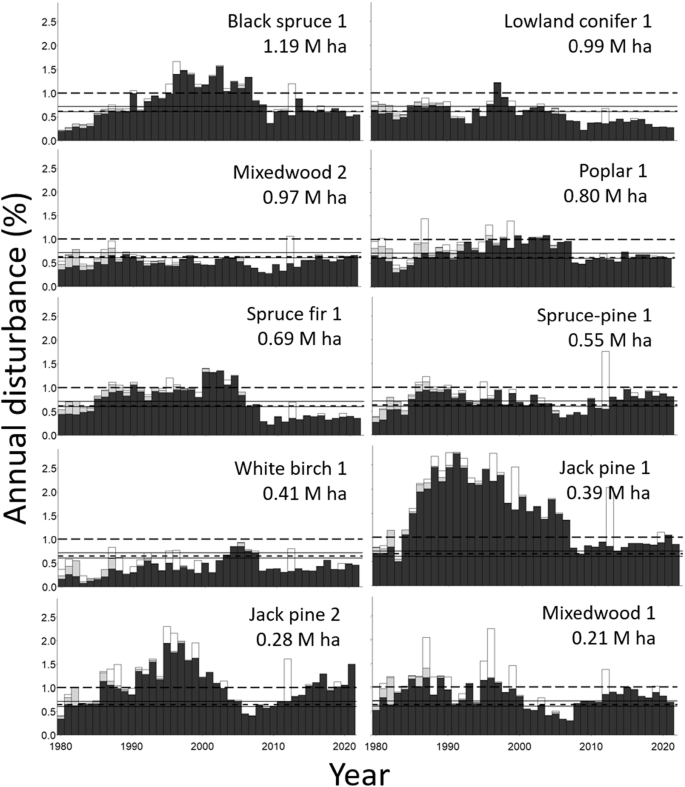
As Fig. 2 except that annual percent of areas disturbed by harvesting, fire, and uncertain disturbances is shown for the most common forest types
Old Forests
Forest >100 years old averaged 22.4% of the study area forests during 2012–2021 (range: 20.7–24.8%). This was below the lower extended limits of variability approximated from Cyr et al. (2009) and lower than the 99% confidence interval from the fire simulation model (Fig. 4a). For 2019–2021, the percent of forests >100 years old approximated the lower extended limit for the fire return interval in ecoregion 3E (140 years; Fig. 4a). At the individual FMU scale, confidence limits from the simulation model were broader (because of the relatively small areas), but all FMUs except Hearst Forest had amounts below the average 99% lower limits (Fig. 4b). However, even Hearst Forest was below the 99% limit when its FMU-specific confidence limit was used (not shown). The Abitibi River historical landscape had much more old forest (79%) than the FMUs and was close to the average upper 99% confidence limit from the simulation model (Fig. 4b). A map of old forest in the study area in 2016 showed strong contrasts with the historical Abitibi River and the simulated landscape (Fig. 5a). Both the historical landscape and the simulation model contained abundant, contiguous blocks of old forest, whereas the study area had concentrations only in the central-east and northern regions and these were highly fragmented.
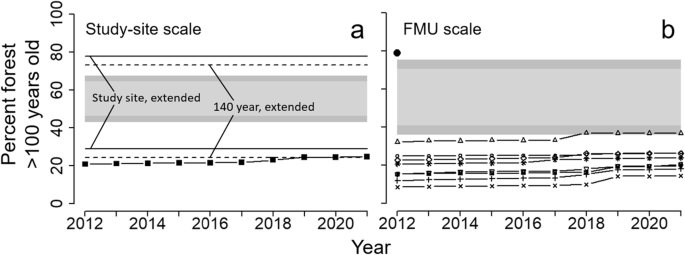
Percent of forest >100 years old in the study area over the 10-year period 2012–2021 compared to bounds of natural variability. In part (a), black squares = study area; horizontal solid lines = extended range of variability for a fire return interval of 160 years; horizontal dashed lines = extended range of variability for a fire return interval of 140 years; light gray bands = 95% confidence limits from fire simulation model; and dark gray band = 99% confidence limits from fire simulation model. In part (b), gray bands again are confidence limits from fire simulation model, the various symbols represent individual FMUs, and the black dot is the Abitibi River historical landscape
In part (a), a map of forests >100 years old (black) and ≤100 years old (gray) is shown in the study area as of 2016, in the Abitibi River historical landscape, and in a simulated historical landscape (to scale). In part (b), the same three landscapes are shown, but results are for a percolation threshold in 500-ha moving circular windows (black = surrounding window ≥59% forests >100 years old; gray = surrounding window <59% forests >100 years old). The simulated landscape was chosen at random (in this case, the mean and variation in annual burn rates in region 3E, respectively, were 0.59 and 0.82 and in region 4E were 0.70 and 1.15; see section “Historical landscapes” for details). Black lines indicate boundaries of individual forest management units. Lakes and other non-forested areas are shown in white
At the study area scale, moving window analyses indicated that amounts of old forest in the study area were much lower (P < 0.01) than in the simulation model for both window sizes (500 and 20,000 ha) and for both thresholds (30 and 59%; Fig. 6; see also Fig. 5). At the FMU scale, FMUs other than Hearst Forest had significantly lower amounts than the average 99% lower limits (Fig. 6). Again, even Hearst forest was below the 99% limit when its FMU-specific confidence limits were used (not shown). Old forest amounts in the Abitibi River historical landscape far exceeded those in the FMUs and for the 59% percolation threshold exceeded the upper amounts from the simulation model (Fig. 6).
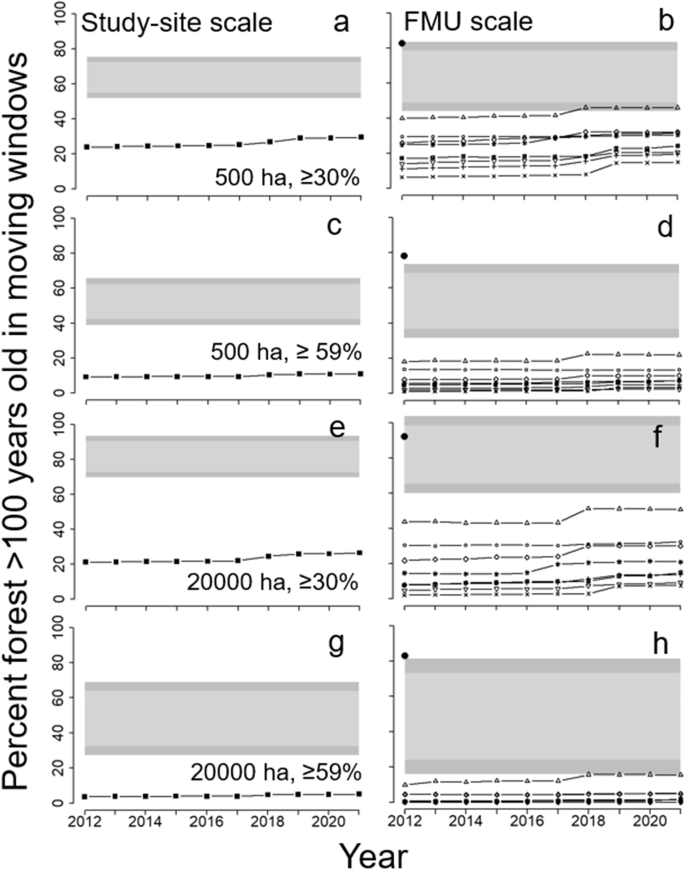
As Fig. 4 except that the percent of forest >100 years old in moving window analyses for two window sizes and two forest amount thresholds is shown. a, b = 500-ha window, threshold ≥30%; c, d = 500-ha window, ≥59% threshold; e, f = 20,000-ha window, threshold ≥30%; g, h = 20,000-ha window, ≥59% threshold. See section “Old forest” for details
Boreal Caribou
Across the 10 years, the yearly average of disturbed habitat from a “used” habitat perspective was 75% of the study area (range: 71–78%) and from a “preferred” habitat perspective was 79% (range: 76–82%; Fig. 8). Even at the scale of individual FMUs, disturbance always was extensive: the range in FMU-specific annual amounts across all years was 62–86% from a used habitat perspective and 66–88% from a preferred habitat perspective (Fig. 7). These numbers fell well within the range of disturbance levels considered by Environment Canada (2011) as highly unlikely to sustain caribou populations. By contrast, disturbances in the Abitibi River historical landscape (in this case, recent fires) were rare (<3% of the area).
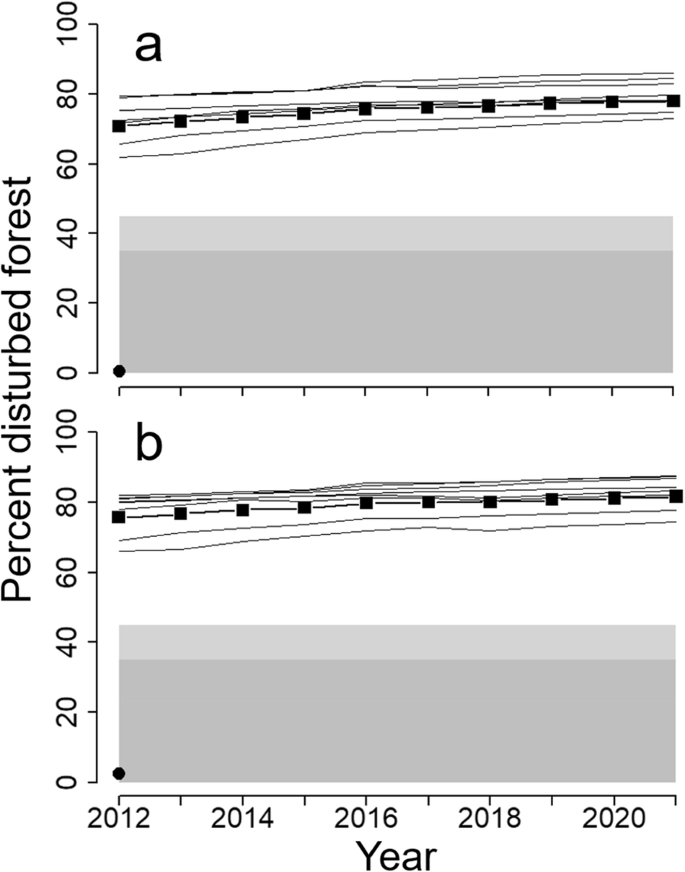
Percent disturbed forest in the study area from a boreal caribou perspective (black squares = study area; continuous black lines = individual FMUs) compared against estimated range-level thresholds from Environment Canada (2011; 35–45% = sustainability of populations unlikely; <35% sustainability of populations likely). In part (a), disturbance is from a used-habitat perspective; in part (b), from a preferred-habitat perspective. The black dot represents the Abitibi River historical landscape. See section “Boreal caribou” for details
Boreal caribou habitat was much less common in the study area than in the Abitibi River historical landscape (Table 2, Fig. 8). The difference was especially pronounced when disturbed areas were excluded as habitat (Fig. 8) and in moving window analyses. Averaged over the 10 years, “used” habitat in the study area covered 33% of the study area, but only 12% when disturbances were factored in, whereas it covered 73% of the habitat in the Abitibi River historical landscape (Table 2). Corresponding amounts for “preferred” habitat were 13%, 5%, and 53%. Moving windows with >28% “used” habitat covered 53–56% of the study area and 8–11% when disturbances were factored in, but 95–97% of the Abitibi River landscape (Table 2). We used 28% here because it was a window threshold used in the landscape guide. The contrast between the study area and the historical landscape was especially marked in moving window analyses of “preferred” habitat that took disturbances into account: moving windows with >28% habitat covered 2–3% of the study area, but 80–87% of the historical landscape (Table 2). At both the 6000-ha and 30,000-ha scales, five of the eight FMUs had no windows with >28% habitat.
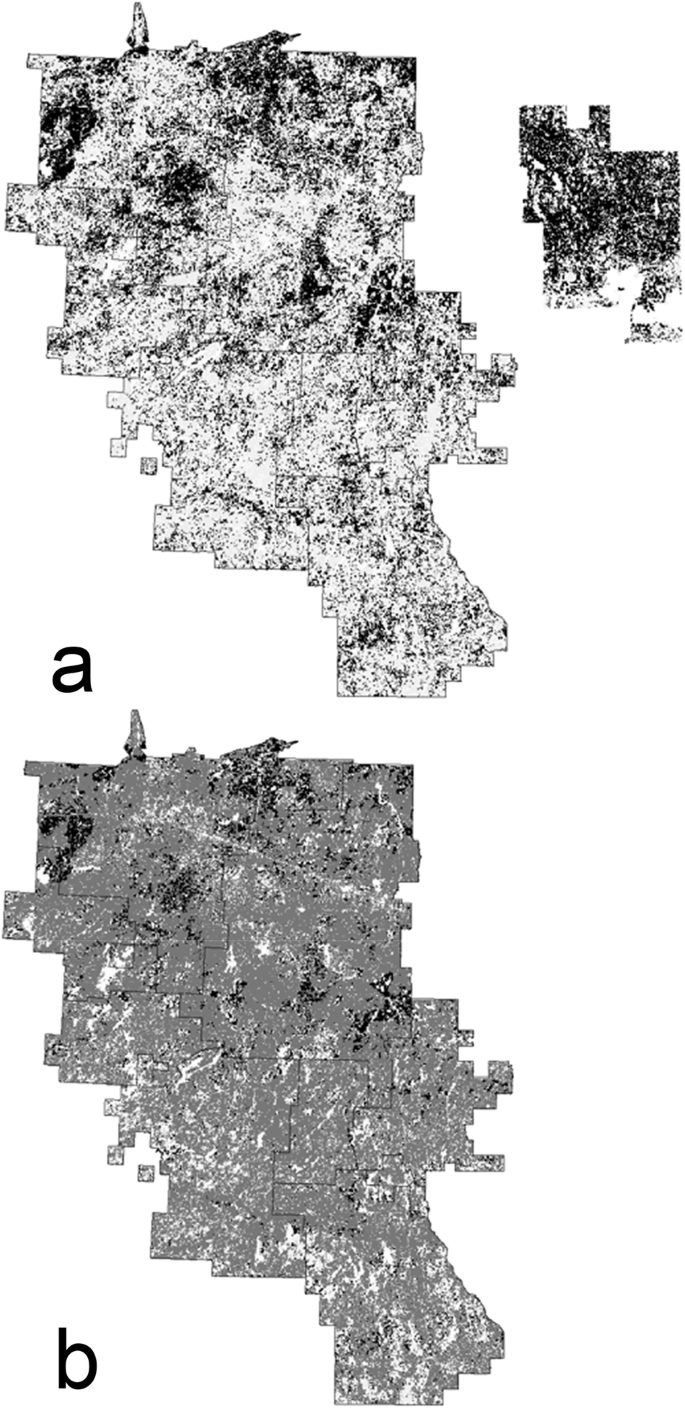
Modeled used boreal caribou winter habitat in 2016 ignoring disturbances is shown in part (a) (black = used habitat ignoring disturbances, light gray = non-used habitat) and with disturbances factored in part (b) (black = used habitat with disturbances factored in, dark gray = disturbances from a used-habitat perspective, light gray = non-used habitat). Used winter habitat in the Abitibi River historical landscape also is shown in part a (disturbances are implicitly factored in because fires <40 years old are excluded as habitat). Black lines indicate boundaries of individual forest management units. Lakes and other non-forested areas are shown in white. See section “Boreal caribou” for details
American Marten
Suitable American marten habitat over the 10-year period averaged 36% of the study area compared to 76% in the Abitibi River historical landscape (Table 3). Habitat in the study area also was more fragmented than in the historical landscape, resulting in even more pronounced differences between the two landscapes for home range and core habitats (Table 3, Fig. 9). These habitats on average covered 6% and 11% of the study area, respectively, compared to 64 and 78% for the Abitibi River historical landscape. Both habitat types were relatively rare and heavily fragmented in the study area, but were extensive and broadly contiguous in the Abitibi River historical landscape (Fig. 9).
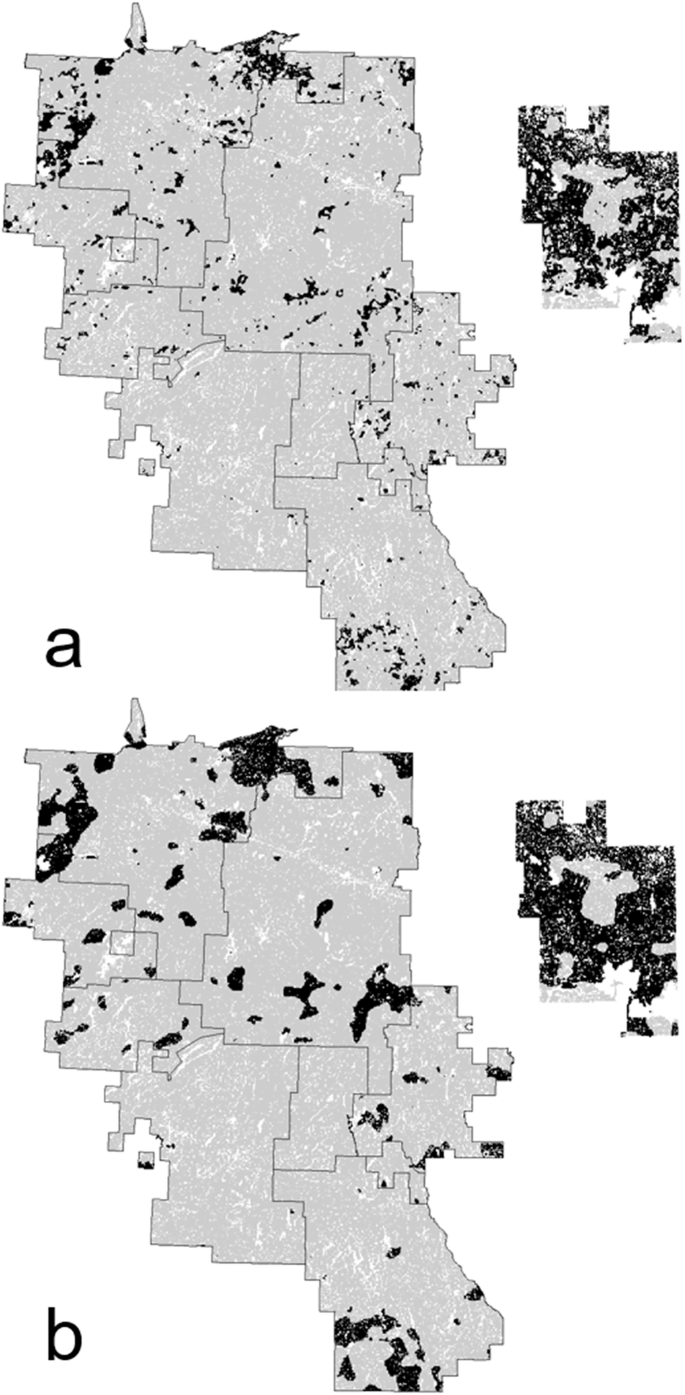
As Fig. 8 excepted that modeled suitable habitat in 2016 for American marten at the home-range scale (500 ha, part a) and at the population “core” scale (5000 ha, part b) are shown. Shown at left is the study area; at right is the Abitibi River historical landscape (black = suitable habitat; gray = unsuitable habitat)
Policy directions in the government landscape guide
Summed across the seven FMUs in region 3E, the landscape guide (OMNR 2014) reported 1,110,883 ha of old-growth forest in 2006. The desired median target amount of old-growth according to the guide’s estimated “bounds of natural variation” was 1,195,273 ha; that is, an increase of 7.6%. Applying this difference to the 11.8% old-growth forest >109 years old that we calculated in these seven FMUs in 2006, the desired amount of old-growth forest according to the guide would be 12.7%. This is less than the 50.9% for a fire return interval of 160 years for forest >109 years of age and considerably lower than the approximated lowest range of extended variability of 23.7% (76 year fire return interval). Bounds of natural variability as estimated by OMNR (2014) also were very low (Fig. 10): the minimum, 25th percentile, 75th percentile, and maximum were respectively 5.4%, 11.0%, 14.6%, and 18.0% old-growth (calculated in the same way), which all were lower than the lowest extended bound approximated from Cyr et al. (2009). Target median habitat amounts calculated for boreal caribou and American marten indicated larger percent increases compared to old-growth forest (respectively, 35.0% and 32.6% increases), but were still much less than the percent increases that would be required to attain habitat levels estimated in the Abitibi River historical landscape (which would require 133.4% and 110.0% increases, respectively). For these species, even the maximum upper bounds from the landscape guide were lower than habitat amounts in the historical landscape (Fig. 10).
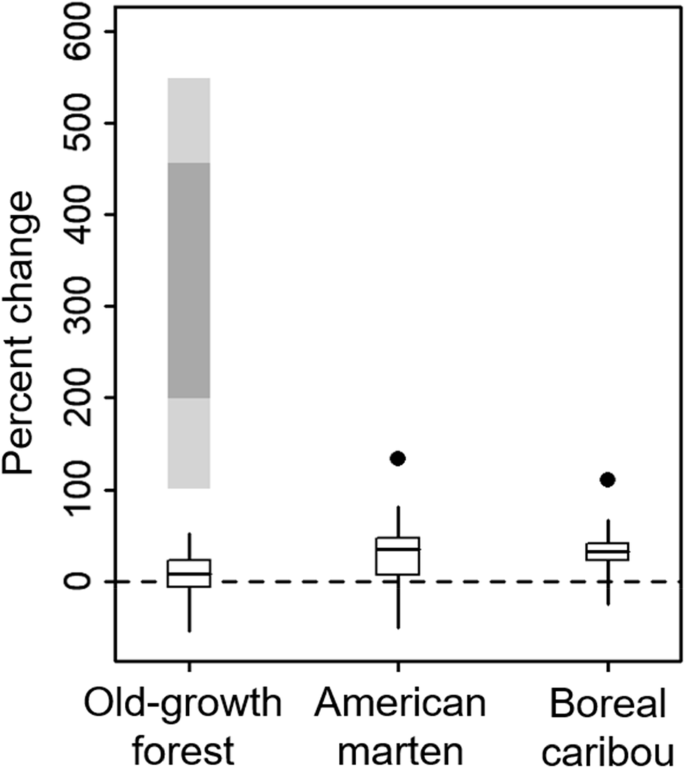
Ranges of natural variability used by the Ontario Ministry of Natural Resources and Forestry in region 3E as targets for areas of old-growth forest, used habitat for boreal caribou, and suitable habitat for American marten averaged for seven FMUs in the study area. Values are expressed as percentages relative to current amounts (dashed line). Vertical black lines indicate ranges, black bars indicate 25th and 75th percentiles, and horizontal black lines indicate medians. For old-growth forest (>109 years of age), ranges of natural variability approximated from Cyr et al. (2009) for a fire return interval of 160 years are shown (light gray = extended range of natural variability, dark gray = conservative range of natural variability). For caribou and marten, habitat amounts in the Abitibi River historical landscape are shown (black dots)
Fine-filter policy directions for boreal caribou in the landscape guide were termed “Dynamic Caribou Habitat Schedules” (DCHS; Elkie et al. 2018; OMNR 2014). The six most southerly FMUs in the study area were exempt from such directions because caribou had already been extirpated from them. Example DCHS designs for the Lac Seul FMU in the western part of the province (Elkie et al. 2018) and the Gordon Cosens Forest (Del Guidice and Ethier 2020 [their Fig. 17]) showed a regulated forest, albeit with a rotation age of 120 vs. 100 years. That is, the DCHS landscape was divided into six units (each with multiple blocks of forest), and one unit was set to be harvested every 20 years. After 120 years, the result would be a regulated forest with 17% of the forest >100 years of age (i.e., 1/6th of the forest) and a maximum forest age of 120 years. We calculated the approximate amount of “used” and “preferred” caribou habitat in such regulated landscapes by assuming that: 1) the FRI-based proportion of each forest type (SFU) also was true in the regulated landscape and 2) the regulated forest age distribution was true for each forest type. For example, if a certain forest type comprised 20% of the forest in the FRIs and the used habitat model required that it be >60 years old, then, for that forest type, we would expect 10% “used” habitat in the regulated landscape (because 50% of the regulated landscape would be >60 years of age). The two most northerly FMUs (Gordon Cosens and Hearst Forest) had the greatest proportion of “used” and “preferred” SFUs; we took a relatively conservative approach and used them to calculate the FRI-based proportions. These calculations indicated that projected habitat amounts in such regulated landscapes were less than those found at present. The amount of “used” habitat in the regulated landscape was 38%, which was less than the currently observed percentage in the two FMUs (40% averaged over the 10 years). The percent of “preferred” habitat was 7%, which also was less than observed average in the two (17% averaged over the 10 years). Factoring in disturbed forests (road buffers, for example) would further decrease these percentages. In managing caribou, however, the landscape guide did not require consideration of disturbed forests, including buffers around roads and harvested areas.
Discussion
Despite Ontario’s legislated mandate to ensure that forest management is ecologically sustainable and to limit forest degradation by maintaining forests within bounds of natural variability (CFSA 1994), we found no evidence of this outcome. Harvesting rates often exceed the natural-fire disturbance rate of 0.625% per year and, for jack pine forest types, often exceeded 1% per year. Forests >100 years old averaged only 22.4% of the study area for 2012–2021 compared to average estimates for natural landscapes of 53.5% and for the Abitibi historical landscape of 79%. Existing old forests were heavily fragmented; for example, 20,000-ha windows with at least 30% old forest comprised only 23% of the study area as compared to 70–94% in simulated natural landscapes. Habitat amounts for boreal caribou and American marten similarly were much lower in the study area than in the Abitibi River historical landscape. High amounts of disturbed boreal caribou habitat suggested that the study area would be unlikely to support self-sustaining local boreal caribou populations (ECCC 2020). We also found that achieving the policy targets laid out by the government would do little to ameliorate the current situation. For example, their maximum target for old-growth forest was less than our minimum extended range approximated from Cyr et al. (2009).
At the same time, we rejected the hypothesis of a timber-maximized forest (as exemplified by a 100-year regulated forest), or a transition to one. Contrary to a 100-year regulated forest, the landscape guide required that old-growth forests be maintained in the study area, albeit at low levels. The most explicit support for the timber maximization hypothesis came from plans to ensure sustainability of caribou populations (Dynamic Caribou Habitat Schedules). Examples from the landscape guide and the Gordon Cosens Forest Management Plan showed regulated forests, albeit with a rotation age of 120 years. Such forests would have 17% forest >100 years old (i.e., 1/6th) and no forest older than 120 years. Of course, this assumes that all timber in harvest blocks would be harvested. A small proportion of harvested areas can be expected to be inoperable, which would result in a small amount of highly fragmented forest older than 120 years. The net result of our tests of the natural emulation vs. timber optimization hypotheses was that we found evidence of a mixed or inconsistently applied management approach.
The mismatch that we found between empirical bounds of natural variability and management outcomes and targets was also true in a 12.6 M-ha area in western Quebec just east of our study area, indicating that this problem is not restricted to Ontario. In four regions, Bergeron et al. (2017) reported that historical amounts of forest >100 years old ranged from 40 to 60%. Observed amounts in 2010 were considerably less, ranging from 21 to 28%. Management targets were even lower, ranging from 12 to 16% (Bergeron et al. 2017).
Given the Ontario Crown Forest Sustainability Act requirement to emulate natural disturbances (CFSA 1994), one must ask how it is that such large deviations from literature-based estimates of bounds of natural variability have been justified? The answer is that the Ontario government uses what it terms “virtual reality” (Elkie et al. 2019, p. 4) to define bounds of natural variability; specifically, rather than relying upon empirical estimates of fire return intervals, it uses results from a mechanistic simulation model (the “Boreal Forest Landscape Dynamics Simulator” [BFOLDS]; Perera et al. 2008; Perera et al. 2014). However, this spatially-explicit, complex model of fire ignition and spread and forest succession is in some cases parameterized such that fire intervals are much shorter than natural fire intervals reported in the literature. In BFOLDS, recent parameterization resulted in “extreme burning” (Elkie et al. 2019; “Fire cycles” link, p. 1). For ecoregion 3 W just west of the study area, initial model runs gave a median fire return interval of 129 years, but subsequent runs with revised drought moisture codes resulted in a fire return interval of 87 years (p. 2, 3, and 10 in the “Fire cycles” link). Relatively low old forest amounts from BFOLDS also are illustrated in Perera et al. (2003) for an area straddling the western border of our study area. After multiple decades of industrial clearcut harvesting in the region, the amount of forest >100 years old observed from FRI data was 21.9%. The expectation from the simulation model was 13.5% old forest.
In addition to potentially unrealistic short fire return intervals, another characteristic of the government model contributed to low modeled old forest amounts. In the model’s successional model (Vasiliauskas et al. 2004), which modeled forest succession in the absence of stand-replacing disturbances, past a certain age many forest types were transitioned to younger forests. For example, after 200 years, jack pine 2 stands were assumed to transition to younger forests, including 40% to 30-year-old forests and 55% to 50-year-old forests. Thus, according to the model, 40% of this old forest had become equivalent to 30-year-old forests resulting from clearcutting. We ran a simplified version of the model to illustrate this aspect. In our version: 1) we set transition start and end ages to two single values for a given forest type (based on the average start and end ages for that forest type, weighted by the percentages of the forest as it transitioned to new forests) and 2) assumed that one-half of the transition occurred at 30% of the difference between the start and end ages and the remainder at 70% of the difference (see Fig. 2 in Vasiliauskas et al. 2004). We initialized the model with the same percentages of forest types observed in the study area, but set all forest ages to 100 years. After 200 years, the succession model produced a forest with an average age of 182 years (rather than 300 years) and 26% of the forest was <100 years old.
We found little evidence that BFOLDS predictions were calibrated against either empirical data on fire return intervals or on historical forest-age distributions. Perera and Cui (2010) compared model predictions against observed fire sizes for the period 1920–1976 and reported in two ecoregions that simulated fires were larger than the largest observed fires. The only other calibration attempt that we found was based on the amount of “burned forest” noted in Ontario Crown land surveys from the late 1800s and early 1900s (OMNR 2014). Unfortunately, the age cut off used by surveyors for defining a forest as “burned” was unknown, making this test approximate. The problem of relying on a mechanistic model to model complex phenomena such as wildfire and forest succession appeared to be evident to the model’s developers. For example, the BFOLDS manual (Perera et al. 2014) noted that “fire regimes…constructed using BFOLDS-FRM over large spatial extents and long time periods are not predictions of past, present, or future, but potential outcomes based on what-if scenarios” (p. 3). Despite these reservations, the model is used by the Government of Ontario to set forest management targets for millions of hectares of boreal forest.
The policy direction offered by the landscape guide is intended to follow a precautionary approach, emphasizing that “our understanding of the way the natural world works and how our actions affect it is often incomplete and we should exercise caution and special concern for natural values in the face of this uncertainty” (OMNR 2014, p. 10). However, in addition to the use of the BFOLDS model as described above, at least three other aspects of the planning process seemed to lack appropriate precautions.
The first related to planning for caribou habitat. As described earlier, rather than emulating natural disturbances, DCHS examples showed regulated forests with a rotation age of 120 years. Notably, in preparing the Gordon Cosens Forest Management Plan for 2020–2030, the planning team was directed to implement the DCHS even though the attendant loss of mature conifer caribou habitat meant that they would be unable to meet targets for caribou habitat retention during the planning period (Del Guidice and Ethier 2020, p. 74). In regulated landscapes with a 120-year rotation, forests harvested 40–120 years previously would have to sustain caribou populations; but it is not known if this is possible. Elkie et al. (2018, p. 6 in the embedded document “Ontario’s Woodland Caribou Conservation Plan”) noted that “there has not yet been full demonstration that caribou will successfully re-inhabit areas impacted by modern logging”. The assumption that young anthropogenic forests provide the same habitat as young post-fire forests is unlikely; for example, Johnson et al. (2020) found that the negative effect of anthropogenic disturbances on cow:calf ratios was 3–4 times larger than effects from fires (see also Environment Canada 2011). Likewise, in a northern Ontario study, Fryxell et al. (2020) provided evidence that boreal caribou adult survival was substantially less in ranges that were commercially logged, where predation risk due to gray wolves (Canis lupus) was higher than in ranges situated in unlogged landscapes. An additional lack of precaution for boreal caribou in the landscape guide was the absence of any requirements to limit cumulative disturbance levels, despite their importance underpinning the definition of critical habitat (ECCC 2020). The guide makes recommendations for various factors to be considered in caribou management, including reduced road-related fragmentation of winter habitats, reduced durations of roads, and reduced industrial, recreational and commercial developments, but these are offered as “best management practices” rather than legally-mandated “standards”.
A second concerned the spatial configuration of remaining habitats; in particular, provisions for large blocks of contiguous habitat. The high value of “intact” forest areas and their increasing global rarity have been noted by numerous authors (e.g., Grantham et al. 2020; Venier et al. 2018; Watson et al. 2018). The only direction offered by the landscape guide were best management practices to identify “large landscape patches” during the development of DCHSs; however, planning teams were directed to “practice judicious use” of such patches and to set a harvest schedule for each.
A final aspect of the landscape guide that appeared to lack appropriate precaution was the decision to combine mature and old-growth forests together for the purposes of spatial targets. This meant that forests >60 or >80 years old were mapped rather than forests >90 or >130 years old (see Table 5 in OMNR 2014). The guide justified this decision by stating that no boreal wildlife species depend entirely on old forests and that many use mature and old forests interchangeably. However, this statement, which in part is based on expert judgment (e.g., Holloway et al. 2004; see also Malcolm et al. 2004), did not consider habitat requirements for the great majority of boreal species, including thousands of insect, fungi, and bryophyte species. European research has provided evidence that insects and fungi are the groups most strongly impacted by boreal forestry practices. For example, hundreds of species that rely upon dead wood at some point in their life cycle are threatened and endangered by forestry practices in Europe and the few remaining patches of high-quality habitat show an extinction debt as biodiversity continues to decline (Berglund and Jonsson 2008). Forest management has contributed to the decline of an estimated 692 red-listed species of conservation concern in Finland (Rassi et al. 1992 cited by Siitonen 2001). However, research and monitoring of the conservation status of insect and fungi species in boreal Canada remains limited. Consequently, it is unknown to what extent the coarse-filter approach of “mature plus old forest” used in the landscape guide will protect such species, particularly given the lack of measurements for key indicators such as standing and downed woody debris.
At the same time, it is important to note that there is considerable uncertainty concerning historical fire return intervals in the study area. The paucity of studies in Ontario has been noted by others (e.g., Ter-Mikaelian et al. 2009; see also Chavardès et al. 2022). We were forced to take an indirect approach to estimate the fire return interval for the southern part of the study site and our “conservative” and “extended” bounds of variability are approximations. As has been done for modern-day fire regimes (e.g., Boulanger et al. 2014), it may be possible to improve upon the ecoregion approach that we used in characterizing areas with relatively homogeneous fire regimes. Additional studies are needed.
Management Implications and Solutions
Failure to maintain disturbances within bounds of natural variability may also signal declines in other ecosystem services. For example, declines in specific wildlife habitats and old forests signal a reduction in the overall diversity of habitats and biota available to support diverse traditional activities dependent on technological, food-related, and medicinal resources (e.g., Turner and Cocksedge, 2001). Moreover, the landscape-scale transformation documented here from relatively old to young forests is indicative of a “carbon debt” that could take many decades or more to repay, exacerbating anthropogenic build up of greenhouse gases in the atmosphere and hence worsening global climate change (Malcolm et al. 2020).
Numerous management options exist to increase the representation of older forests in managed boreal landscapes. Cyr et al. (2009) suggested that 40% of boreal landscapes should be devoted to strategies that ensure greater representation of old forests, including longer rotations, silvicultural strategies that emulate small-scale disturbance dynamics, and conservation measures such as set-asides and protected areas. In a Finnish example, Triviño et al. (2017) reported that by diversifying management practices, especially through less pre-commercial thinning and extending rotations by 30 years, they could maintain 80% of net present value from timber harvests and increase carbon and biodiversity values to >90% and nearly 80%, respectively. In the Gordon Cosens FMU, Etheridge and Kayahara (2013) found that the “multicohort” forest management system developed by Bergeron and Harvey (1997; see also Bergeron et al. 2007) was capable of meeting targets based on a 170-year fire return interval, whereas status quo harvesting was not. Didion et al. (2007) found that they could maintain amounts of mature and old forest within bounds of natural variability for a 162-year fire return interval by harvesting 35% of forest to maintain a linearly declining age structure of forest stands up to just older than 200 years (see also Burton et al. 1999).
This case study highlights the potential limitations of exclusively relying upon extensively applied forestry practices to manage biodiversity at the landscape scale. Preventing forest degradation and proactively avoiding the loss of forest integrity at landscape or regional scales (Grantham et al. 2020) may require the protection of areas large enough to sustain ecosystem functions, along with meaningful limits on the overall forest harvest footprint. St-Laurent et al. (2022) emphasized that we are currently in a critical bottleneck period for sustaining boreal caribou populations in managed forests, arguing that timber harvesting within caribou habitats must be reduced.
In conclusion, a key challenge of recent international commitments to halt forest degradation lies in defining clear indicators and thresholds. The alignment of harvesting rates, forest age structure, and habitat amounts for key species within bounds of natural variability may be a relevant and measurable indicator that is generally already accepted by governments and the forestry sector. To that end, our analyses reveal that forest management outcomes and landscape-level policy directions in north-eastern boreal Ontario currently are outside of these bounds, indicating that forest degradation is already underway. Without changes to the current management approach, continued forest degradation and resulting loss of biodiversity and ecosystem services can be expected.
Data Availability
All data used in the study are available from public sources cited in the manuscript. Definitions of secondarily derived variables, including forest types, forest development stages, and modelled habitat suitability for boreal caribou and American marten are available from public sources and are provided in the Online Resources.
References
-
Andrén H (1994) Effects of habitat fragmentation on birds and mammals in landscapes with different proportions of suitable habitat—a review. Oikos 71:355–366. https://doi.org/10.2307/3545823.
-
Armstrong GW, Adamowicz WL, Beck JA, Cumming SG, Schmiegelow FKA (2003) Coarse filter ecosystem management in a nonequilibrating forest. Science 49:209–223. https://doi.org/10.1093/forestscience/49.2.209.
-
Bergeron Y, Harvey B (1997) Basing silviculture on natural ecosystem dynamics: an approach applied to the southern boreal mixedwood forest of Quebec. Ecol Manag 92:235–242. https://doi.org/10.1016/S0378-1127(96)03924-2.
-
Bergeron Y, Gauthier S, Kafka V, Lefort P, Lesieur D (2001) Natural fire frequency for the eastern Canadian boreal forest: consequences for sustainable forestry. Can J Res 31:384–391. https://doi.org/10.1139/cjfr-31-3-384.
-
Bergeron Y, Drapeau P, Gauthier S, Lecomte N (2007) Using knowledge of natural disturbances to support sustainable forest management in the northern Clay Belt. Chron 83:326–337. https://doi.org/10.5558/tfc83326-3.
-
Bergeron Y, Vijayakumar DBIP, Ouzennou H, Raulier F, Leduc A, Gauthier S (2017) Projections of future forest age class structure under the influence of fire and harvesting: implications for forest management in the boreal forest of eastern Canada. Forestry 90:485–495. https://doi.org/10.1093/forestry/cpx022.
-
Berglund H, Jonsson BG (2008) Assessing the extinction vulnerability of wood-inhabiting fungal species in fragmented northern Swedish boreal forests. Biol Conserv 141:3029–3039. https://doi.org/10.1016/j.biocon.2008.09.007.
-
Bichet O, Dupuch A, Hébert C, Le Borgne H, Fortin D (2016) Maintaining animal assemblages through single-species management: the case of threatened caribou in boreal forest. Ecol Appl 26:612–623. https://doi.org/10.1890/15-0525.
-
Bouchard M, Pothier D (2011) Long-term influence of fire and harvesting on boreal forest age structure and forest composition in eastern Québec. Ecol Manag 261:811–820. https://doi.org/10.1016/j.foreco.2010.11.020.
-
Boulanger Y, Gauthier S, Gray DR, Le Goff H, Lefort P, Morissette J (2013) Fire regime zonation under current and future climate over eastern Canada. Ecol Appl 23:904–923. https://doi.org/10.1890/12-0698.1.
-
Boulanger Y, Gauthier S, Burton PJ (2014) A refinement of models projecting future Canadian fire regimes using homogeneous fire regime zones. Can J Res 44:365–376. https://doi.org/10.1139/cjfr-2013-0372.
-
Bourgoin C, Ceccherini G, Girardello M, Vancutsem C, Avitabile V, Beck PSA, Beuchle R, Blanc L, Duveiller G, Migliavacca M, Vieilledent G, Cescatti A, Achard F (2024) Human degradation of tropical moist forests is greater than previously estimated. Nature 631:570–576. https://doi.org/10.1038/s41586-024-07629-0.
-
Bradshaw CJA, Warkentin IG (2015) Global estimates of boreal forest carbon stocks and flux. Glob Planet Change 128:24–30. https://doi.org/10.1016/j.gloplacha.2015.02.004.
-
Bridger MC, Johnson CJ, Gillingham MP (2016) Assessing cumulative impacts of forest development on the distribution of furbearers using expert-based habitat modeling. Ecol Appl 26:499–514. https://doi.org/10.1890/15-0555.
-
Burton PJ, Kneeshaw D, Coates KD (1999) Managing forest harvesting to maintain old growth in boreal and sub-boreal forests. Chron 75:623–631. https://doi.org/10.5558/TFC75623-4.
-
Burton PJ, Bergeron Y, Bogdanski B, Juday G (2010) Sustainability of boreal forests and forestry in a changing environment. In: Mery G, Katila P, Galloway G, Alfaro RI, Kanninen M, Lobovikov M, Varjo J (eds) Forests and society – responding to global drivers of change. International Union of Forest Research Organizations, Vienna, IUFRO World Series, pp 249–282
-
CFSA (Crown Forest Sustainability Act) (1994) S.O. 1994, Chapter 25. Toronto, ON. https://www.ontario.ca/laws/statute/94c25
-
Chavardès RD, Danneyrolles V, Portier J, Girardin MP, Gaboriau DM, Gauthier S, Drobyshev I, Cyr D, Wallenius T, Bergeron Y (2022) Converging and diverging burn rates in North American boreal forests from the Little Ice Age to the present. Int J Wildland Fire 31:1184–1193. https://doi.org/10.1071/WF22090.
-
Coogan SCP, Daniels LD, Boychuk D, Burton PJ, Flannigan MD, Gauthier S, Kafka V, Park JS, Wotton BM (2021) Fifty years of wildland fire science in Canada. Can J Res 51:283–302. https://doi.org/10.1139/cjfr-2020-0314.
-
Crins WJ, Gray PA, Uhlig PWC, Wester MC (2009) The ecosystems of Ontario, part 1: ecozones and ecoregions. Technical Report SIB TER IMA TR-01, Ontario Ministry of Natural Resources, Peterborough, Ontario
-
Cyr D, Gauthier S, Bergeron Y, Carcaillet C (2009) Forest management is driving the eastern North American boreal forest outside its natural range of variability. Front Ecol Environ 7:519–524. https://doi.org/10.1890/080088.
-
Del Guidice K, Ethier D (2020) Forest management plan for the Gordon Cosens Forest. Approved by Ontario Ministry of Natural Resource and Forestry Hearst District Office. 258 p. https://nrip.mnr.gov.on.ca/s/published-submission?language=en_US&recordId=a0z3g000000CdrKAAS
-
Desmet PG (2018) Using landscape fragmentation thresholds to determine ecological process targets in systematic conservation plans. Biol Conserv 221:257–260. https://doi.org/10.1016/j.biocon.2018.03.025.
-
Didion M, Fortin MJ, Fall A (2007) Forest age structure as indicator of boreal forest sustainability under alternative management and fire regimes: a landscape level sensitivity analysis. Ecol Model 200:45–58. https://doi.org/10.1016/j.ecolmodel.2006.07.011.
-
Drapeau P, Leduc A, Kneeshaw D, Gauthier S (2009) An adaptive framework for monitoring ecosystem management in the boreal black spruce forest. In: Gauthier S, Vaillancourt M, Leduc A, De Grandpré L, Kneeshaw D, Morin H, Drapeau P, Bergeron Y (eds) Ecosystem management in the boreal forest. Presses de l’Université du Québec, Canada, pp 343–371
-
EC (European Commission) (2023) Regulation on deforestation-free products https://environment.ec.europa.eu/topics/forests/deforestation/regulation-deforestation-free-products_en. Accessed November 2024
-
ECCC (Environment and Climate Change Canada) (2020). Amended recovery strategy for the woodland caribou (Rangifer tarandus caribou), Boreal population, in Canada. Species at risk act recovery strategy series. Environment and Climate Change Canada, Ottawa.
-
ECCC (Environment and Climate Change Canada) (2025) https://dd.weather.gc.ca/climate/observations. Accessed March 2025
-
Elkie P, Green K, Racey G, Gluck M, Elliott J, Hooper G, Kushneriuk R, Rempel R (2018) Science and information in support of policies that address the conservation of woodland caribou in Ontario: occupancy, habitat and disturbance models, estimates of natural variation and range level summaries. Electronic Document. Version 2018. Ontario Ministry of Natural Resources, Forests Branch
-
Elkie P, Gluck M, Boos J, Bowman J, Daniel C, Elliott J, Etheridge D, Heaman D, Hooper G, Kushneriuk R, Lucking G, Mills S, Naylor B, Pinto F, Pond B, Rempel R, Ride K, Smiegielski A, Watt G, Woods M (2019) Science and information in support of the forest management guide for boreal landscapes: simulations, rationale and inputs. Version 2019. Ontario Ministry of Natural Resources and Forestry. Cown Lands and Forestry Branch, Forest Guides and Silviculture Section
-
Environment Canada (2011) Scientific assessment to inform the identification of critical habitat for woodland caribou (Rangifer tarandus caribou), boreal population, in Canada: 2011 update. Ottawa
-
Etheridge DA, Kayahara GJ (2013) Challenges and implications of incorporating multi-cohort management in northeastern Ontario, Canada: a case study. Chron 89:315–326. https://doi.org/10.5558/tfc2013-062.
-
Fryxell JM, Avgar T, Liu B, Baker JA, Rodgers AR, Shuter J, Thompson ID, Reid DEB, Kittle AM, Mosser A, Newmaster SG, Nudds TD, Street GM, Brown GS, Patterson B (2020) Anthropogenic disturbance and population viability of woodland Caribou in Ontario. J Wildl Manag 84:636–650. https://doi.org/10.1002/jwmg.21829.
-
Gauthier S, Lefort P, Bergeron Y, Drapeau P (2002) Time since fire map, age-class distribution and forest dynamics in the Lake Abitibi Model Forest. Natural Resources Canada, Canadian Forest Service, Laurentian Forestry Centre, Sainte-Foy, QC, Information Report LAU-X-125
-
Gauthier S, Leduc A, Bergeron Y, Le Goff H (2009) Fire frequency and forest management based on natural disturbances. In: Gauthier S, Vaillancourt M, Leduc A, De Grandpré L, Kneeshaw D, Morin H, Drapeau P, Bergeron Y (eds) Ecosystem management in the boreal forest. Presses de l’Université du Québec, Canada, pp 57–74
-
GBF (Global Biodiversity Framework) (2022) https://www.cbd.int/gbf. Accessed November 2024
-
GFW (Global Forest Watch) (2024) https://data.globalforestwatch.org/documents/gfw::tree-cover-loss/explore. Accessed January 2024
-
Grantham HS, Duncan A, Evans TD et al. (2020) Anthropogenic modification of forests means only 40% of remaining forests have high ecosystem integrity. Nat Commun 11: 5978. https://doi.org/10.1038/s41467-020-19493-3.
-
Grigal DF, Ohmann LF (1975) Classification, description, and dynamics of upland plant communities within a Minnesota wilderness area. Ecol Monogr 45:389–407. https://doi.org/10.2307/1942413.
-
Hansen MC, Potapov PV, Moore R, Hancher M, Turubanova SA, Tyukavina A, Thau D, Stehman SV, Goetz SJ, Loveland TR, Kommareddy A, Egorov A, Chini L, Justice CO, Townshend JRG (2013) High-resolution global maps of 21st-century forest cover change. Science 342:850–853. https://doi.org/10.1126/science.1244693.
-
Harris LI, Richardson K, Bona KA, Davidson SJ, Finkelstein SA, Garneau M, McLaughlin J, Nwaishi F, Olefeldt D, Packalen M, Roulet NT, Southee FM, Strack M, Webster KL, Wilkinson SL, Ray JC (2021) The essential carbon service provided by northern peatlands. Front Ecol Environ https://doi.org/10.1002/fee.2437
-
Heinselman ML (1973) Fire in the virgin forests of the Boundary Waters Canoe Area, Minnesota. Quat Res 3:329–382. https://doi.org/10.1016/0033-5894(73)90003-3.
-
Hermosilla T, Wulder MA, White JC, Coops NC, Hobart GW, Campbell LB (2016) Mass data processing of time series Landsat imagery: pixels to data products for forest monitoring. Int J Digit Earth 9:1035–1054. https://doi.org/10.1080/17538947.2016.1187673.
-
Holloway GL, Naylor BJ, Watt WR eds (2004) Habitat relationships of wildlife in Ontario: revised habitat suitability models for the Great Lakes-St. Lawrence and boreal east forests. Ontario Ministry of Natural Resources, Science and Information Branch, Southern Science and Information and Northeast Science and Information Joint Technical, Report #1
-
Hunter ML (1993) Natural fire regimes as spatial models for managing boreal forests. Biol Conserv 65:115–120.
-
Imbeau L, St-Laurent MH, Marzell L, Brodeur V (2015) Current capacity to conduct ecologically sustainable forest management in northeastern Canada reveals challenges for conservation of biodiversity. Can J Res 45:567–578. https://doi.org/10.1139/cjfr-2014-0123.
-
Johnson CA, Sutherland GD, Neave E, Leblond M, Kirby P, Superbie C, McLoughlin PD (2020) Science to inform policy: linking population dynamics to habitat for a threatened species in Canada. J Appl Ecol 57:1314–1327. https://doi.org/10.1111/1365-2664.13637.
-
Kittle AM, Anderson M, Avgar T, Baker JA, Brown GS, Hagens J, Iwachewski E, Moffatt S, Mosser A, Patterson BR, Reid DEB, Rodgers AR, Shuter J, Street GM, Thompson ID, Vennen LMV, Fryxell JM (2017) Landscape-level wolf space use is correlated with prey abundance, ease of mobility, and the distribution of prey habitat. Ecosphere 8: e01783. https://doi.org/10.1002/ecs2.1783.
-
Kochtubajda B, Burrows WR (2020) Cloud-to-ground lightning in Canada: 20 years of CLDN data. Atmos -Ocean 58:316–332. https://doi.org/10.1080/07055900.2020.1845117.
-
Kurz W, Beukema S, Apps M (1998) Carbon budget implications of the transition from natural to managed disturbance regimes in forest landscapes. Mitig Adapt Strateg Glob Chang 2:405–421.
-
Landres PB, Morgan P, Swanson FJ (1999) Overview of the use of natural variability concepts in managing ecological systems. Ecol Appl 9:1179–1188. https://doi.org/10.2307/2641389.
-
LIO (Land Information Ontario) (2012) https://geohub.lio.gov.on.ca/datasets/site-region-/about. Accessed March 2023
-
LIO (Land Information Ontario) (2019) https://geohub.lio.gov.on.ca/datasets/lio::caribou-range-boundary/about. Accessed January 2023
-
LIO (Land Information Ontario) (2022a) https://geohub.lio.gov.on.ca/documents/7aa998fdf100434da27a41f1c637382c/about. Accessed December 2021
-
LIO (Land Information Ontario) (2022b) https://geohub.lio.gov.on.ca/maps/lio::forest-resources-inventory-packaged-products-version-2/about. Accessed September 2022
-
LIO (Land Information Ontario) (2023a) https://geohub.lio.gov.on.ca/documents/f52f092ee6744e0687ead57f78b5d88a/about. Accessed April 2025
-
LIO (Land Information Ontario) (2023b) https://geohub.lio.gov.on.ca/maps/mnrf::provincial-digital-elevation-model-pdem/about. Accessed March 2025
-
LIO (Land Information Ontario) (2023c) https://ontariogeohub-lio.opendata.arcgis.com/datasets/lio::ecoregion/about. Accessed January 2023
-
Macdonald P, Du J (2018) mixdist: finite mixture distribution models. R package version 0:5–5.
-
Mackey BG, McKenney DW, Yang Y, McMahon JP, Hutchinson F (1996) Site regions revisited: a climatic analysis of Hills’ site regions for the province of Ontario using a parametric method. Can J Res 26:333–354. https://doi.org/10.1139/x26-038.
-
Mackey B, Campbell C, Norman P, Hugh S, DellaSala DA, Malcolm JR, Desrochers M, Drapeau P (2024) Assessing the cumulative impacts of forest management on forest age structure development and woodland caribou habitat in boreal landscapes: a case study from two Canadian provinces. Land 13:6. https://doi.org/10.3390/land13010006.
-
Malcolm JR, Campbel BD, Kuttner BG, Sugar A, Malcolm JR, Kuttner BG (2004) Potential indicators of the impacts of forest management on wildlife habitat in northeastern Ontario: a multivariate application of wildlife habitat suitability matrices. Chron 80:91–106. https://doi.org/10.5558/tfc80091-1.
-
Malcolm JR, Holtsmark B, Piascik PW (2020) Forest harvesting and the carbon debt in boreal east-central. Canada. Clim Change 161:433–449. https://doi.org/10.1007/s10584-020-02711-8.
-
McRae DJ, Duchesne LC, Freedman B, Lynham TJ, Woodley S (2001) Comparisons between wildfire and forest harvesting and their implications in forest management. Environ Rev 9:223–260. https://doi.org/10.1139/er-9-4-223.
-
Mortelliti A, Brehm AM, Evans BE (2022) Umbrella effect of monitoring protocols for mammals in the Northeast US. Sci Rep. 12: 1893. https://doi.org/10.1038/s41598-022-05791-x.
-
Noss RF (1999) Assessing and monitoring forest biodiversity: a suggested framework and indicators. Ecol Manag 115:135–146. https://doi.org/10.1016/S0378-1127(98)00394-6.
-
NRCan (Natural Resources Canada) (2024) https://cwfis.cfs.nrcan.gc.ca/downloads/nfdb/fire_poly/current_version/NFDB_poly.zip. Accessed January 2024
-
NTEMS (National Terrestrial Ecosystem Monitoring System for Canada) (2024) https://opendata.nfis.org/mapserver/nfis-change_eng.html. Accessed January 2024
-
Ohmann LF, Ream RR (1971) Wilderness ecology: virgin plant communities of the Boundary Waters Canoe Area. USDA Forest Service, Research Paper NC-63, St. Paul, Minnesota
-
OMECP (Ontario Ministry of the Environment, Conservation, and Parks) (2024) Ontario boreal caribou monitoring program 2023 aerial survey results. https://www.ontario.ca/files/2024-05/mecp-ontario-boreal-caribou-monitoring-program-en-2024-05-14.pdf
-
OMNR (Ontario Ministry of Natural Resources) (2010) Forest management guide for conserving biodiversity at the stand and site Scales. Queen’s Printer for Ontario, Toronto
-
OMNR (Ontario Ministry of Natural Resources) (2014) Forest management guide for boreal landscapes. Queen’s Printer for Ontario, Toronto
-
Perera AH, Cui W (2010) Emulating natural disturbances as a forest management goal: lessons from fire regime simulations. Ecol Manag 259:1328–1337. https://doi.org/10.1016/j.foreco.2009.03.018.
-
Perera AH, Baldwin DJB, Yemshanov DG, Schnekenburger F, Weaver K, Boychuk D (2003) Predicting the potential for old-growth forests by spatial simulation of landscape ageing patterns. Chron 79:621–631. https://doi.org/10.5558/tfc79621-3.
-
Perera AH, Ouellette M, Cui W, Drescher M, Boychuk D (2008) BFOLDS 1.0: a spatial simulation model for exploring large scale fire regimes and succession in boreal forest landscapes. Forest Research Report 152. Ontario Forest Research Institute, Ontario Ministry of Natural Resources, Sault Ste. Marie
-
Perera AH, Ouellette MR, Boychuk D (2014) BFOLDS fire regime module v2.0: user guide for LANDIS-II extension. https://www.fire-regime-model.com/BFOLDS%20Fire%20Regime%20Module%20v2.0%20-User%20Guide.pdf. Accessed December 2022
-
Pohjanmies T, Triviño M, Le Tortorec E, Mazziotta A, Snäll T, Mönkkönen M (2017) Impacts of forestry on boreal forests: an ecosystem services perspective. Ambio 46:743–755. https://doi.org/10.1007/s13280-017-0919-5.
-
R Core Team (2023) R: a language and environment for statistical computing. R Foundation for Statistical Computing, Vienna, Austria. https://www.R-project.org/
-
Rowe JS (1972) Forest Regions of Canada. Publication No. 1300, Canadian Forest Service, Ottawa
-
Schaefer JA (2003) Long-term range recession and the persistence of caribou in the taiga. Conserv Biol 17:1435–1439. https://doi.org/10.1046/j.1523-1739.2003.02288.x.
-
Siitonen J (2001) Forest management, coarse woody debris and saproxylic organisms: Fennoscandian boreal forests as an example. Ecol Bull 49:11–41. https://doi.org/10.2307/20113262.
-
St-Laurent MH, Boulanger Y, Cyr D, Manka F, Drapeau P, Gauthier S (2022) Lowering the rate of timber harvesting to mitigate impacts of climate change on boreal caribou habitat quality in eastern Canada. Sci Total Environ 838: 156244. https://doi.org/10.1016/j.scitotenv.2022.156244.
-
Ter-Mikaelian MT, Colombo SJ, Chen J (2009) Estimating natural forest fire return interval in northeastern Ontario, Canada. Ecol Manag 258:2037–2045. https://doi.org/10.1016/j.foreco.2009.07.056.
-
Thompson ID, Guariguata MR, Okabe K, Bahamondez C, Nasi R, Heymell V, Sabogal C (2013) An operational framework for defining and monitoring forest degradation. Ecol Soc 18:20.
-
Triviño M, Pohjanmies T, Mazziotta A, Juutinen A, Podkopaev D, Le Tortorec E, Mönkkönen M (2017) Optimizing management to enhance multifunctionality in a boreal forest landscape. J Appl Ecol 54:61–70. https://doi.org/10.1111/1365-2664.12790.
-
Turner NJ, Cocksedge W (2001) Aboriginal use of nontimber forest products in northwestern North America. J Sustain 13:31–58. https://doi.org/10.1300/J091v13n03_04.
-
UNFCCC (United Nations Framework Convention on Climate Change) (2023) Report of the Conference of the Parties serving as the meeting of the Parties to the Paris Agreement on its fifth session, held in the United Arab Emirates from 30 November to 13 December 2023. Addendum. Part two: Action taken by the Conference of the Parties serving as the meeting of the Parties to the Paris Agreement at its fifth session. https://unfccc.int/documents/637073. Accessed November 2024
-
Vasiliauskas S, Chen HYH, Parton J, Henry P, Lucking G, Brienesse M, Osawa S, Arnup R (2004) Successional pathways – proposed SFMM rules for northeast regional standard forest units. Version 2. Ont. Min. of Nat. Resour., Northeast Science & Information, South Porcupine, Ontario. Queen’s Printer for Ontario. NESI TN–020
-
Van Wagner CE (1978) Age-class distribution and the forest fire cycle. Can J Restor 8:220–227. https://doi.org/10.1007/s13398-014-0173-7.2.
-
Van Wagner CE (1987) Development and structure of the Canadian forest fire weather index system. Forest Technology Report 35, Canadian Forestry Service, Ottawa
-
Vásquez-Grandón A, Donoso PJ, Gerding V (2018) Forest degradation: when is a forest degraded?. Forests 9:726. https://doi.org/10.3390/f9110726.
-
Venier LA, Walton R, Thompson ID, Arsenault A, Titus BD (2018) A review of the intact forest landscape concept in the Canadian boreal forest: its history, value, and measurement. Environ Rev 26:369–377. https://doi.org/10.1139/er-2018-0041.
-
Wang X, Wotton BM, Cantin AS, Parisien M-A, Anderson K, Moore B, Flannigan MD (2017) cffdrs: an R package for the Canadian Forest Fire Danger Rating System. Ecol Process 6: 5. https://doi.org/10.1186/s13717-017-0070-z.
-
Watson JE, Evans T, Venter O, Williams B, Tulloch A, Stewart C, Thompson I, Ray JC, Murray K, Salazar A, McAlpine C (2018) The exceptional value of intact forest ecosystems. Nat Ecol Evol 2:99–610. https://doi.org/10.1038/s41559-018-0490-x.
-
Wotton BM, Nock CA, Flannigan MD (2010) Forest fire occurrence and climate change in Canada. Int J Wildland Fire 19:253–271. https://doi.org/10.1071/WF09002.
-
Yemshanov DG, Perera AH (2002) A spatially explicit stochastic model to simulate forest cover transitions: general structure and properties. Ecol Model 150:189–209. https://doi.org/10.1016/S0304-3800(01)00480-X.
Acknowledgements
The research was funded by the Natural Sciences and Engineering Research Council of Canada (Discovery Grant to lead author) and Wahkohtowin Development GP Inc. (WDGP). It also benefited from research on American marten habitat funded by Mitacs and WDGP. WDGP played a role in defining the study area, but otherwise funders were not involved in the study design; in the collection, analysis, and interpretation of data; in the writing of the manuscript; or in the decision to submit the article for publication. We would like to thank S. Gauthier, who provided forest age information in the Lake Abitibi historical landscape, and A. Chanda, D. Flood, P. James, G. Kayahara, and D. Martell. We also are indebted to T. Clark, S. Gauthier, M. Scrafford, I. Thompson, C. Wedeles, and an anonymous reviewer for comments on an earlier version of the manuscript.
Funding
The research was funded by the Natural Sciences and Engineering Research Council of Canada (Discovery Grant to lead author) and Wahkohtowin Development GP Inc. (WDGP). It also benefited from research on American marten habitat funded by Mitacs and WDGP. WDGP played a role in defining the study area, but otherwise funders were not involved in the study design; in the collection, analysis, and interpretation of data; in the writing of the manuscript; or in the decision to submit the article for publication.
Ethics declarations
Conflict of interest
The authors declare no competing interests.
Additional information
Supplementary information
Rights and permissions
Open Access This article is licensed under a Creative Commons Attribution-NonCommercial-NoDerivatives 4.0 International License, which permits any non-commercial use, sharing, distribution and reproduction in any medium or format, as long as you give appropriate credit to the original author(s) and the source, provide a link to the Creative Commons licence, and indicate if you modified the licensed material. You do not have permission under this licence to share adapted material derived from this article or parts of it. The images or other third party material in this article are included in the article’s Creative Commons licence, unless indicated otherwise in a credit line to the material. If material is not included in the article’s Creative Commons licence and your intended use is not permitted by statutory regulation or exceeds the permitted use, you will need to obtain permission directly from the copyright holder. To view a copy of this licence, visit http://creativecommons.org/licenses/by-nc-nd/4.0/.
Reprints and permissions
About this article
Cite this article
Malcolm, J.R., Boan, J.J. & Ray, J.C. Emulation or Degradation? Evaluating Forest Management Outcomes in Boreal Northeastern Ontario. Environmental Management 75, 1901–1922 (2025). https://doi.org/10.1007/s00267-025-02191-5
- Received
- Accepted
- Published
- Issue Date
- DOI https://doi.org/10.1007/s00267-025-02191-5
Keywords
- Forest management
- Bounds of natural variability
- Forest degradation
- Boreal forest
- Boreal caribou
- American marten