Article Content
1 Introduction
Hydroxypropyl methylcellulose (HPMC) is a derivative of cellulose, a natural polysaccharide, belonging to the cellulose ether family, in which some of the hydroxyl groups in cellulose are replaced by hydroxypropyl or methyl groups [1,2,3,4]. HPMC is expected to have wider uses, especially regarding formulation technologies and product performance enhancement [5].
Chitosan (Cs) is a biopolymer obtained from a methylation synthesis. The second most available biopolymer after cellulose, chitosan, contains rather special properties that give it high importance and utility in many spheres [5,6,7,8]. In pharmaceuticals, chitosan also provides new opportunities as a drug delivery system to enhance the bioavailability of drugs by improving their absorption [9,10,11]. It is widely used in food industries as a packaging material to preserve antimicrobial properties.
As in the literature on HPMC and Cs, their potential and relevance are evident in different fields, particularly pharmaceuticals and biomedicine technology. The other properties are excellent for many applications, individually or in their combined forms. Further ongoing research seeks to develop new formulations and applications of these biopolymers, underscoring their value in creating new and efficient, environmentally friendly materials. Considering the trend of eliminating non-renewable components, coupling HPMC with chitosan in the future will be key in improving the technology and performance of products in various fields.
Graphene oxide (GO) is a two-dimensional nanomaterial derived from graphite, characterized by its unique structure and exceptional properties. The oxidation process introduces oxygen-containing functional groups to the graphene layers, disrupting the sp² hybridized carbon network and imparting hydrophilic properties and the potential for intercalation with other molecular groups within the polymer network [12,13,14].
Gowtham et al. [2] studied the enhancement of biodegradable polymer composites based on HPMC using carbon particles added at varying concentrations. This research evaluated the physical properties and performance of plasticized biodegradable polymers produced by a simple solution casting technique. The reason for this was to seek an understanding of the content and proportion of carbon particles for the HPMC-based composites. Abdu Saeed et al. focused on structural, optical, electrical, and dielectric properties of iodine pentoxide (I₂O₅) doped HPMC) [15]. The study was designed to answer how the presence of I₂O₅ in the composite contributes to the overall properties of these materials and the possible application of the composites in different fields. It was shown that the introduction of I₂O₅ in the matrix of HPMC/PVA significantly changes the structural characteristics of the composite films. Yassin et al. [5] incorporated Au/Se nanoparticles in the HPMC/CMC blend to enhance hybrid nanocomposites’ structural, optical, and morphological properties [16].
This work aims to fabricate novel nanocomposites by incorporating graphene oxide (GO) into HPMC and Cs polymer blend. This study seeks to evaluate the structural, optical, and electrical properties of the resulting HPMC/Cs-GO nanocomposites, leveraging advanced characterization techniques such as FT-IR, UV-visible, and AC electrical analysis. By exploring the impact of varying GO concentrations on the polymer matrix, the research aims to optimize the material’s electronic transitions, optical absorption, dielectric properties, and charge transport mechanisms. The ultimate goal is to develop nanocomposites with enhanced functionality for applications in optoelectronics, flexible devices, and energy storage systems.
2 Experimental
2.1 Materials
HPMC with a molecular weight of approximately 86,000 g/mol and a hydrolysis degree of 99%, as well as chitosan (Cs) with a molecular weight ≈ 150,000 g/mol and a deacetylation degree of 75–85%, were procured from Sigma-Aldrich. Graphene oxide (GO) nanopowders with a thickness in the range of 6–8 nm and a surface area of approximately 130 m²/g. Sigma-Aldrich supplied the GO nanoplatelets used in this study.
2.2 Preparation of HPMC/Chitosan polymer blend
The HPMC/Cs polymer blend was fabricated using the solution casting technique. Predefined ratios of HPMC and chitosan were dissolved in distilled water at 80 °C with continuous stirring. Subsequently, GO nanopowders were incorporated into the HPMC/Cs blend at concentrations of 0, 0.01, 0.02, 0.04, and 0.06 wt%. GO selected concentrations ranging from 0.01 to 0.06 wt% were chosen doped in the HPMC/Cs blend while avoiding aggregation or phase separation. The HPMC/Cs-GO mixture solution was stirred for 2 h to ensure uniform dispersion of GO within the polymeric matrix. The prepared solutions were cast into Petri dishes and left to dry under ambient conditions, forming thin HPMC/Cs-GO nanocomposite films. The ratio between HPMC: Cs was 3:2 by weight. The average thickness of the prepared samples is nearly 20 μm.
2.3 Characterization techniques
The IR spectra were recorded using an FT-IR spectrophotometer (Nicolet iS10, USA) within the wavenumber range of 4000–400 cm⁻¹. The IR measurement accuracy was set to 4 cm−1. The baseline correction was applied to all FT-IR spectra using the FT-IR software, and spectra were normalized to the same functional group to enable direct comparison. The optical properties were analyzed using a UV–visible spectrophotometer (Shimadzu UV-2600). The samples were measured in the wavelength range of 200–800 nm. The absorption spectra were recorded to evaluate the UV-blocking capabilities and to determine the optical parameters of the HPMC/Cs-GO nanocomposite films. The surface morphology of the samples was analyzed using scanning electron microscopy (SEM) with a Quanta FEG 250 instrument (USA). AC electrical measurements were performed using a Hioki 3531Z Hi-Tester LCR meter (Japan) employing the two-probe method. The instrument operated across a frequency range of 42 Hz to 1 MHz, with an impedance accuracy varying between 0.15% and 4%. For these measurements, the films were cut into circular pieces with a diameter of 1 cm. The LCR meter was interfaced with a computer via an RS-232 C connection, enabling dielectric and conductivity measurements to be conducted.
3 Results and discussion
3.1 FT-IR analysis
Figure 1 shows the FT-IR spectra of the HPMC/Cs polymer blend incorporated with graphene oxide (GO) in the wavenumber range of 4000–400 cm−1. The absorption band is observed at 3400 cm−1 due to the stretching bond of the hydroxyl (-OH) group. Another band appearing at 1381 cm−1 is due to the bending (-OH) group. Other bands observed are due to C-H and C-O stretching vibration at 2890 cm−1 and 1046 cm−1, respectively. As a result of the nanocomposite films, an asymmetric bending vibration of the methyl group is observed at 1656 and 1411 cm−1 in the pure HPMC/Cs polymer film, while in the composite films, it appears at 1661 cm−1 and 1417 cm−1, respectively. The band at 846 cm−1 is attributed to the CH2 rocking in HPMC polymer [17]. Generally, the changes in the FT-IR spectra show a complexation between the HPMC/Cs polymer blend and graphene oxide. Some bands disappear upon adding the amount of graphene oxide, which can be seen from the spectral data of pure HPMC. Besides the changes observed in the shifting of bands, it is rather interesting to note the alteration in the shape of the peaks. The bands in region 893–567 cm−1 are for the C-O symmetric stretching mode in C-O-C linkage, and the trans-C-H wagging mode of polymer appears at 1311 cm−1. In these spectral regions, the changes are expected to be in the stretching and deformation of C-O-C linkages [18]. The new bands appearing, the changes in the existing bands, and their disappearance in the IR spectra can be taken as evidence of the complexation of polymer blend systems with the GO. The nanocomposites are formed between the GO and hydroxypropyl methylcellulose with the aid of hydrogen bonds. The low-frequency additional bands can also be attributed to GO, which is inside the coordination sphere. Increasing the concentration of GO ions in the HPMC/Cs polymer blend decreases the width of the band, which is caused by reducing the amount of the HPMC/Cs blend. This alteration is related to IR active vibrational bands, which suggest the existence of an electrically excited molecular complex of GO-contained HPMC/Cs polymer.
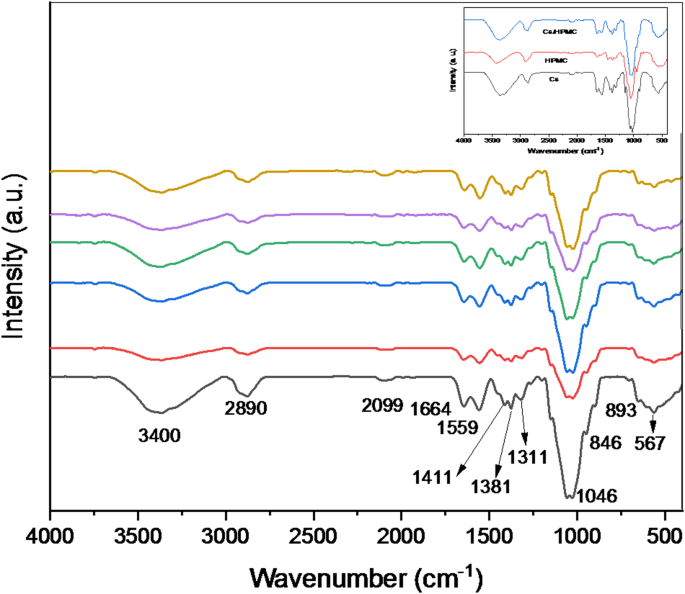
The FT-IR spectra of pure HPMC/chitosan blend doped with various contents of GO nanopowder
Cations and anions are essential for forming bonds, which also leads to creating a complicated polymer film containing doped GO ions. The broadband in the spectrum results in an increase in oxidation with an increase in the doping level of the polymer blend. The study has confirmed that this is the reason for the increase in the conductivity of doped polymer film, since the electronic transition is higher as the concentration of the doping agent increases.
In addition, the correlation between amide I (C = O) stretching, amide II (N-H) bending, amide III (C-N) stretching, and absorption band positions has been assessed as predictors of conformation. The bands positioned at 1664 cm−1 for amide I, 1559 cm−1 for amide II, and 1311 cm−1 for amide III are obtained from the HPMC/Cs blend films. It is apparent from the study that shifts of amide I, amide II, and amide III characterization bands of the blend films occurred towards the lower wavenumbers with an increase in GO contents in the blend films [19].
3.2 UV–Visible spectroscopy
The UV–visible absorption spectra of pure HPMC/chitosan blends incorporated with various contents of GO are presented in Fig. 2 in the frequency range of 210–1100 Hz. The spectra reveal significant changes in the absorption characteristics with increasing GO content. The pure HPMC/chitosan blend exhibits an absorption edge in the UV region starting from 233 nm, attributed to the π-π* transitions of the conjugated structures in the polymer chains. Observed. Introducing a small amount of GO slightly increases absorbance in the UV region, shifting the absorption edge towards longer wavelengths (redshift). This indicates enhanced light absorption capabilities due to the presence of GO. Further increases in GO concentration result in the most substantial increase in absorbance, with a clear shift in the absorption edge towards longer wavelengths. The absorption spectrum suggests a saturation effect, indicating that the polymer matrix can no longer accommodate additional GO without dispersion or phase separation changes. The maximum absorbance values observed for each concentration of GO in the HPMC/chitosan blend are recorded in Table 1.
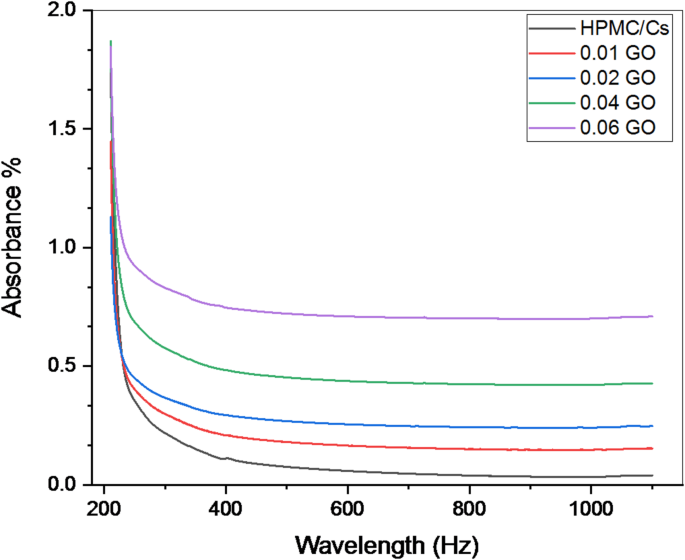
The UV–visible absorption spectra of pure HPMC/chitosan blend incorporated by various contents of GO nanopowder
The UV-visible transmittance spectra of prepared samples is shown in Fig. 3. It is also to be noted that based on the transmission spectra results, the positive effects of the added GO contents may help reduce the transmittance level from 91.85% for pure HPMC/Cs blend to 31.23%. This reduction in transmittance demonstrates the enhanced UV-blocking capability of the blends as GO concentration increases. The maximum transmittance data (at 1100 nm) is summarized in Table 1.
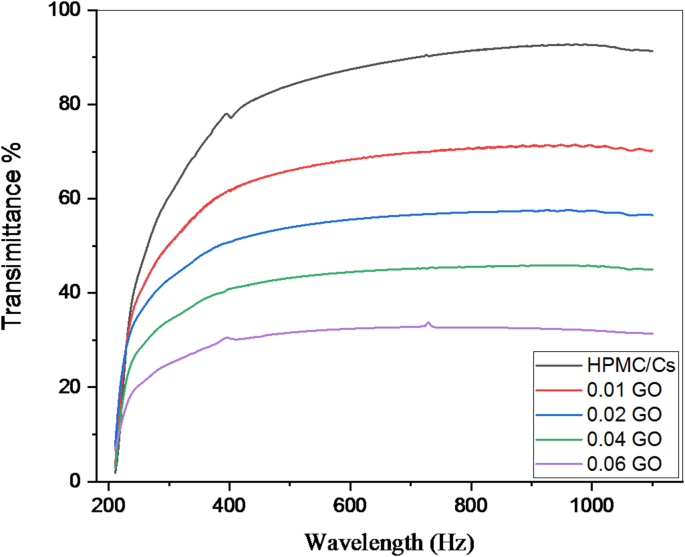
The UV–visible transmittance spectra of pure HPMC/chitosan blend doped by various contents of GO nanopowder
The estimation of the absorption coefficient () is calculated from the absorbance data using the relation [20,21,22]:
where A is the absorbance and t is the thickness of each sample. The Tauc equation is employed to derive the band gap energy (Eg) as [23,24,25,26]:
where h is Planck’s constant, ν is the frequency of the incident light, B is a constant, and n is a factor that depends on the nature of the transition (n= for direct transitions). The optical band gap is calculated from the plot of (αhν)1/2 versus hν as shown in Fig. 4. The band gap energy is extracted by plotting (αhν)1/2 versus hν, extrapolating the linear portion to intersect the energy axis. The optical band gap energies for the HPMC/chitosan blends at different GO concentrations are summarized in Table 1. The pure HPMC/chitosan blend exhibits an optical band gap of 6.20 eV. This relatively high band gap value indicates a wide energy separation between the valence and conduction bands, which is characteristic of insulating polymers. The band gap is influenced by the polymer’s molecular structure, degree of crystallinity, and the presence of functional groups that can participate in electronic transitions.
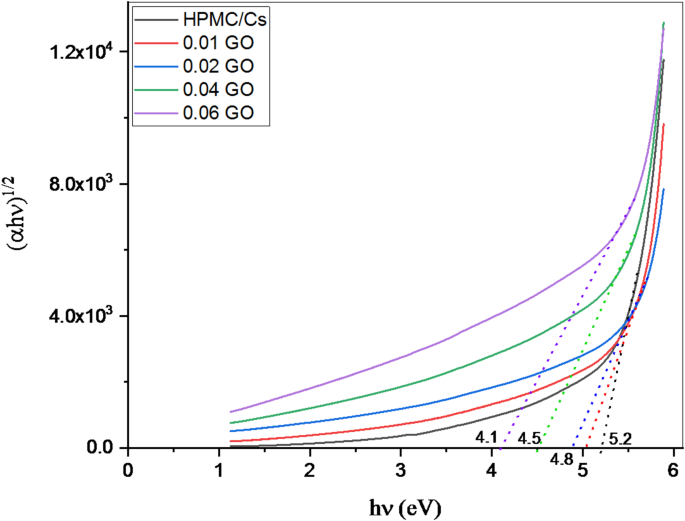
The relation between and () for pure HPMC/chitosan blend doped with various concentrations of GO nanopowder
As shown in Table 1, incorporating GO into the HPMC/chitosan matrix leads to a progressive decrease in the optical band gap energy. This trend can be explained by several factors, such as the introduction of GO, which has a distinct electronic structure due to its sp² hybridized carbon network, which modifies the electronic properties of the polymer blend. The presence of GO enhances charge carriers’ availability, promoting electronic transitions. This increase in charge carrier density is responsible for the observed reduction in band gap energy, as it lowers the energy required for electronic transitions. The interactions between GO and the polymer chains can lead to changes in the local electronic environment. The functional groups on GO can form hydrogen bonds or other interactions with the polymer matrix, altering the energy levels and facilitating transitions that would otherwise require higher energy. The band gap decreases, indicating the onset of electronic interactions between the polymer blend and GO. The slight reduction signifies that even minimal GO doping enhances electronic transitions.
The extinction coefficient (𝑘) is calculated using the following Eqs. [26,27,28,29]:
Figure 5 shows the extinction coefficient (k) spectra of the HPMC/Cs-GO nanocomposite films as a function of light wavelengths. The absorbance is proportional to the extinction coefficient, which is observed to increase as the amount of GO increases. This behavior in the UV region is associated with the transfer of electrons between states due to high photon energy.
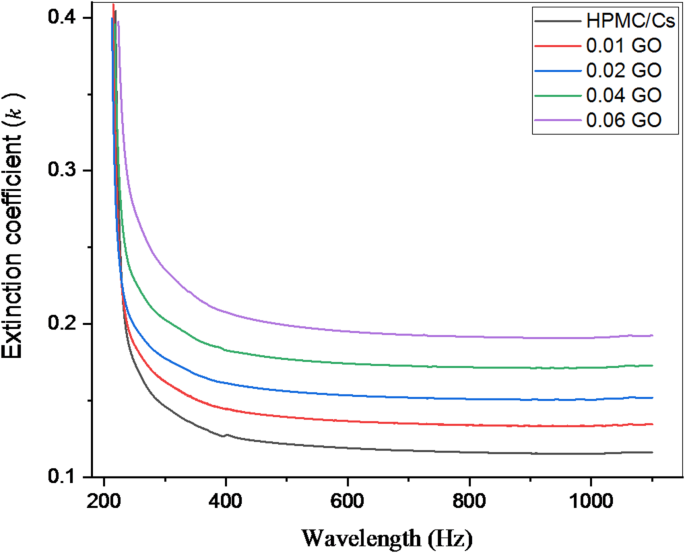
The relation between coefficient (k) and wavelength for pure HPMC/chitosan blend doped with various concentrations of GO nanopowder
3.3 X-ray and TEM
The crystallinity and layered structure of graphene oxide (GO) are systematically characterized using X-ray diffraction (XRD) to evaluate the structural order of GO and interlayer spacing. Figure 6 presents the XRD patterns of the synthesized GO sample. In the GO spectrum, a prominent 002 diffraction peak was observed at 2θ = 17.2°, corresponding to an interlayer spacing of approximately 0.52 nm (calculated using Bragg’s law: λθ. This significant increase in interlayer distance compared to pristine graphite (~ 0.34 nm) confirms the introduction of oxygen-containing functional groups (e.g., epoxide, hydroxyl, and carbonyl) during the oxidation process, which disrupts the graphitic stacking and creates structural disorder.
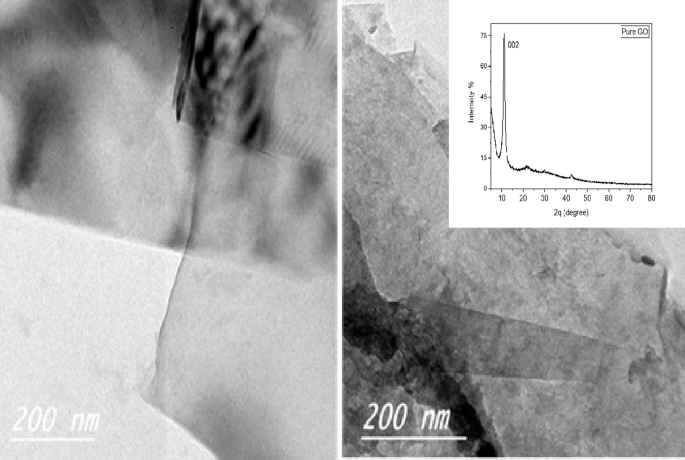
X-ray diffraction (insert) and TEM images of pure GO nanopowder
The broadening and reduced intensity of the 002 peak further indicate a loss of long-range crystallinity in GO, consistent with the transformation of sp²-hybridized carbon domains into sp³ regions due to oxidation. Complementary evidence from Fourier-transform infrared (FTIR) spectroscopy corroborates these findings, revealing distinct absorption bands at ~ 1720 cm⁻¹ (C = O stretching of carbonyl groups) and ~ 3400 cm⁻¹ (O-H stretching of hydroxyl groups). Together, these results demonstrate how oxidative functionalization alters the atomic arrangement of graphene-based materials, providing critical insights into their physicochemical properties for applications in energy storage, catalysis, and nanocomposites.
Transmission electron microscopy (TEM) analysis of GO was conducted in this study. As illustrated in Fig. 7, the TEM images clearly show that the GO nanosheets exhibit high transparency, which is indicative of their ultrathin nature. Additionally, the presence of distinct folds and ripples along the sheet edges further confirms the minimal thickness of the GO layers. These features are attributed to the highly efficient oxidation and exfoliation process employed during GO synthesis, resulting in well-separated, thin nanosheets. Such morphological characteristics are expected to promote better dispersion stability and enhance the lubricating properties of the GO additives in lubricant systems. As observed, the images reveal their signature layered sheet-like structures with overlapped areas. The dark lines and borders that can be seen in both photos match the margins of the Graphene oxide sheets and the spacing between them.
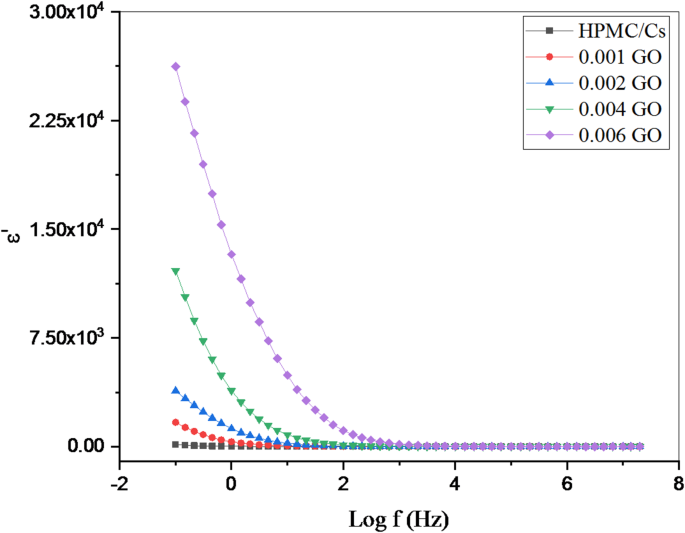
The variation of the dielectric constant (ε’) with frequency (Log f) of HPMC/Cs-GO nanocomposites
3.4 Dielectric, impedance, and AC electrical analysis
Figures 8 and 9 show the variation of the dielectric constant (ε’) and dielectric loss (ε’’) as functions of frequency (log f) over a range of 0.1 Hz to 10⁶ Hz for pure HPMC/CS polymer blends and the same blend doped with low concentrations of graphene oxide (GO) nanopowders at room temperature. In the low-frequency region and at low graphene oxide concentrations, the dielectric loss (ε’’) exhibits relatively higher values. This behavior is primarily attributed to the effective alignment of the dipolar species with the externally applied electric field, which leads to enhanced polarization effects.
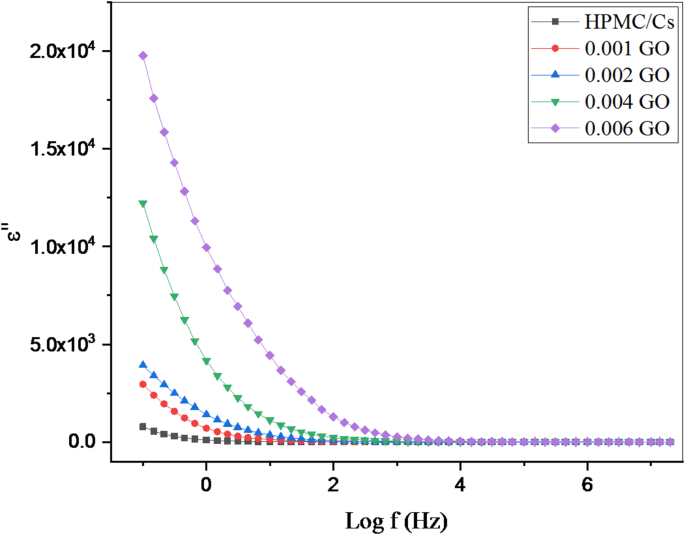
The variation of the dielectric loss () with frequency (Log f) of HPMC/Cs doped with GO nanopowders
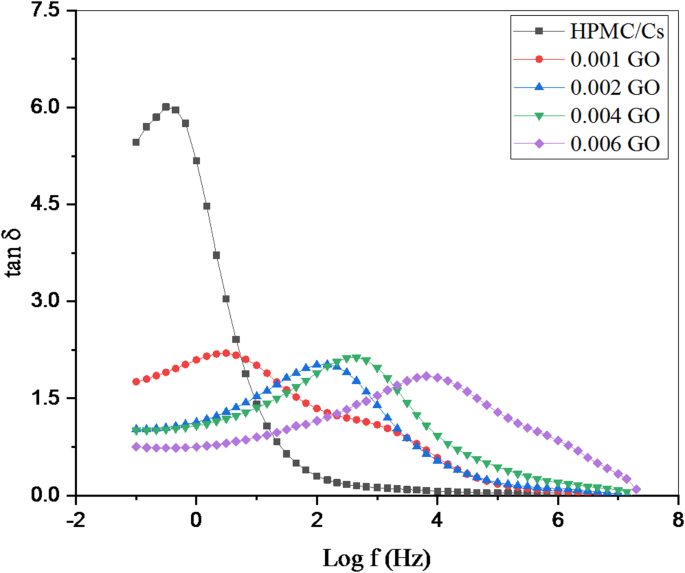
The variation of loss tangent (tan d) with frequency (Log f) of HPMC/Cs incorporated by GO nanopowders
With increasing frequency, a gradual decrease in ε’’ is observed in all samples. This decrease can be attributed to the limited response time of the dipoles, which limits their ability to reorient in synchronization with the rapidly alternating electric field, or to the reduced number of dipoles that effectively contribute to polarization at higher frequencies. In the high-frequency regions, the dielectric constant (ε’) decreases, indicating the dominant influence of internal conductive grains with low resistance. During the fabrication of nanocomposite samples, the inclusion of conductive graphene oxide nanopowders, surrounded by thin, less conductive polymer grain boundaries, produces an inhomogeneous dielectric structure. Interfaces between regions of different conductivity and permittivity lead to interfacial polarization and space-charge effects. These interfacial phenomena, along with the strong nanoscale interactions between the dispersed graphene oxide nanoparticles and the polymer matrix, collectively contribute to the enhanced dielectric response observed in graphene oxide-doped composites.
When the frequency of the electric field is increased, the field starts alternating rapidly in the last few cycles. This transition occurs for the electric charges in the material whose frequencies are much lower than this field. This process uses almost all materials’ dielectric constant, lowering the electrical permittivity. The reduction in ε′ and ε′′, which was observed, can be accounted for by a decrease in a phenomenon referred to as ‘polarization’. This process makes it possible for a material to retain an electric charge [30]. The circumstances of having more zinc nanorods (increasing the concentration) bring about remarkable changes in the two properties (ε′ and ε′′), which relate to the engagement of the enhanced material with the electric field potential. Also, the reason for increasing the values of ε′ and ε′′ for the HPMC/Cs-GO nanocomposites is the increased permittivity of the additional nanofillers over that of the polymer blend. In addition, the interfacing between two or more materials offers the possibility of targeting the accumulation of electric charges within the material’s interface layer. This build-up may influence the orientation of the microparticles in the matrix, such that there could be improved alignment effects.
The dielectric and modulus properties of the developed materials offer valuable insights into their performance and potential applications. The dielectric constant measures the material’s capacity to store electrical energy, while the dielectric loss reveals how much energy is dissipated as heat—both are critical factors for capacitors, energy storage systems, and various electronic devices. Meanwhile, the storage modulus indicates the material’s stiffness, and the loss modulus reflects its ability to dissipate mechanical energy. These characteristics are essential for ensuring structural integrity, effective damping, and vibration control in engineering applications.
The loss tangent (tan δ) is defined as the ratio of mobile dipoles to stored charge dipoles in a system, expressed by the following equation [31]:
Figure 9 illustrates the variation of the loss tangent (tan δ) against the frequency (Log f) for all HPMC/Cs-GO nanocomposite samples. The observed peaks in the tan δ signify maximum electrical energy absorption, which results from the interaction between the oscillating electric field and the oscillating charge. The samples exhibit clearly defined tangential peaks within the frequency range linked to the relaxation processes of dipoles generated by surface polarization at higher frequencies. These findings align with the dispersion observed in the dielectric constant versus frequency figure presented earlier. The tangential loss peak at lower frequencies is less distinct, likely because the relaxation frequencies of the involved charge types are too closely spaced to be resolved separately or may fall outside the measurement frequency range of this study. The doped samples demonstrate the highest values of dielectric loss within the observed frequency range, which could be attributed to the number of dipoles available for relaxation and the significant heterogeneity of the samples due to interface effects.
The complex electric modulus () is given by the relation [22, 32, 33]:
where:
The frequency dependence of the real () and imaginary () components of the electric impedance of the studied samples is shown in Figs. 10 and 11. From the figures, as the frequency (f) increases, M′ values initially rise. These lower values also neglect the effects of electrodes, showing their insignificant effect on inducing electrode-activated polarizability of the surface polarization. At high frequencies (> 20 kHz), this increased rate increases gradually increasing, and approaches the steady state. There is a clear relaxation peak in the graph of M″ in all samples.
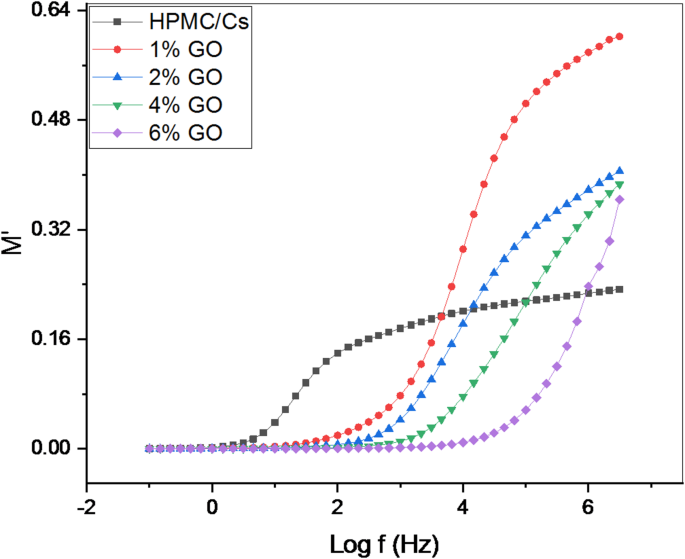
The variation of the real part () with frequency (Log f) of HPMC/Cs doped with GO nanopowders
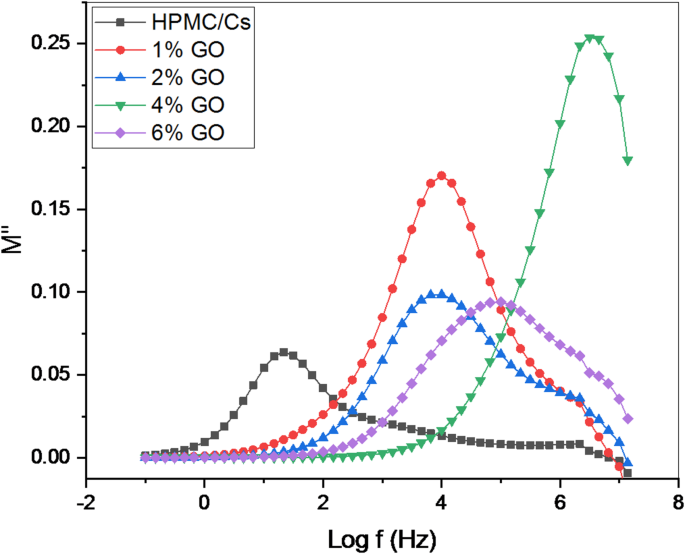
The variation of the imaginary part () with frequency (Log f) of HPMC/Cs incorporated by GO nanopowders at room temperature
All samples generally exhibit a pronounced tail at low frequencies, characterized by a rapid increase in M′ at higher frequencies. This behavior indicates a significant electrode polarization effect associated with higher capacitance values at lower frequencies, as depicted in Fig. 10. At higher frequencies, the inhibition of electrode polarization becomes evident, as reflected in the increased modulus values and the presence of relaxation bands, which confirm the diminishing influence of polarization effects.
As shown in Fig. 11, the pure HPMC/Cs sample exhibits the highest intensity of M″, while the nanocomposite containing the highest concentration of GO nanopowders demonstrates the lowest M″ values. This trend correlates with the observation that the AC conductivity is maximized in the nanocomposite with the highest nanoparticle concentration compared to other samples. The imaginary part of the electrical modulus (M″) reveals that at higher frequencies, the intensity of the maximum bands decreases progressively as the concentration of GO. Additionally, M″ shows a distinct shift in the peak position toward higher frequencies with increasing nanofiller concentration. This peak frequency corresponds to the relaxation frequency, which determines the associated relaxation time () according to the relationship [26]:
where () represents the time required for ions to move between sites during the conduction process. A reduction in relaxation time is evident as the peak frequency shifts to higher values with increased nanofiller content. This phenomenon is attributed to charge carrier segments’ enhanced mobility and movement. The incorporation of GO enhances the chain flexibility of the polymeric matrix by reducing its crystallinity, thereby facilitating more significant segmental motion. This increased chain flexibility, reduced relaxation time, streamlined ion transport, and improved AC conductivity. The reduction in crystallinity and enhancement of segmental mobility due to the nanoparticles are well-documented phenomena. Consequently, the relaxation time decreases while ionic fluency and segmental motion increase, leading to more efficient charge transfer and higher AC conductivity in the nanocomposites.
Figure 12 illustrates the variation in AC electrical conductivity (σ) as a function of frequency (log f) for HPMC/Cs nanocomposites incorporated with GO nanopowders. This variation provides insights into the relaxation processes of the HPMC/Cs-GO nanocomposite system. The frequency-dependent difference in AC electrical conductivity is observed across the prepared nanocomposite samples, influenced by the external electric field and the concentration of GO. At lower frequencies, the behavior is dominated by the impedance arising from space charge accumulation at the electrode-electrolyte interface. The AC conductivity measurement is a critical technique for analyzing ionic transport properties in materials, particularly for distinguishing bulk and interfacial effects. The AC conductivity () is calculated using the relationship:
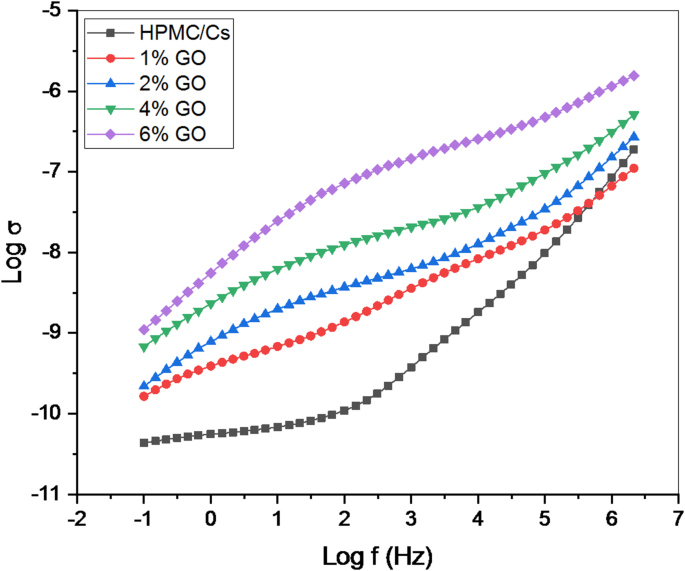
The variation of the AC electrical conductivity (s) with frequency (Log f) of HPMC/Cs incorporated by GO nanopowders at room temperature
where ω = 2πf is the angular frequency, F/m is the permittivity of free space, is the imaginary part (dielectric loss) of the complex dielectric permittivity. At low frequencies, ions remain localized for longer periods, resulting in significant charge accumulation at the electrode/electrolyte interface. This phenomenon impedes ion mobility, leading to a reduction in conductivity. Conversely, at higher frequencies, AC conductivity exhibits scattering, which can be attributed to the rapid back-hopping of ions, indicative of bulk relaxation mechanisms. An increase in ionic conductivity at higher frequencies is associated with enhanced ion mobility, particularly in the HPMC/Cs-GO composites. The AC conductivity reaching 10−5−10−4 S/cm at high frequencies for the 0.06 wt% GO composite align well with previous reports on chitosan/PVA (σ ~ 10−6−10−5 S/cm) and HPMC/PVA-I₂O₅ (σ ~ 10−5 S/cm) systems [10, 11]. The improvement in conductivity with increasing GO concentrations is likely due to interactions between GO nanoparticles and anions/cations. The smaller size of GO nanopowders compared to the host HPMC/Cs particles allows them to penetrate the [11]polymeric matrix of HPMC/Cs. This interaction facilitates the catalysis of plasticizer ions, which interact with HPMC/Cs chain molecules, thereby reducing cohesive forces between the polymer chains. This reduction enhances segmental motion flexibility. Also, the diminished cohesion between the polymeric chains promotes chain-cutting movements and establishes GO-conducting pathways on the surfaces of the GO nanopowders, contributing to the observed increase in ionic conductivity.
4 Conclusion
This study demonstrates the significant effects of incorporating graphene oxide (GO) into the HPMC/Cs polymer blend. FT-IR analysis reveals that adding GO alters pure HPMC/Cs spectral characteristics, indicating complexation through hydrogen bonding and changes in vibrational modes. The shifting, disappearance, and emergence of new bands confirm interactions between the polymer blend and GO, enhancing the material’s structural and electronic properties. UV–visible spectroscopy reveals that increasing GO concentration enhances the optical properties, notably reducing transmittance and shifting absorption edges towards longer wavelengths. The reduction in optical band gap energy, from 5.20 eV to 4.50 eV, occurs as the GO concentration increases. The ٍُSEM images showed the presence of graphene oxide sheets with sizes ranging from 35.31–57.23 nm, and the average size of the sheets was about 46.26 nm. AC electrical analyses, including dielectric and impedance measurements, show that GO significantly enhances the polymer’s electrical properties. Increased GO concentration leads to higher dielectric constants and lower relaxation times, suggesting improved charge carrier mobility and reduced crystallinity in the polymer matrix. The formation of GO-conducting pathways and decreased interchain cohesion further augment these effects. AC conductivity analysis indicates that higher GO content facilitates ion mobility, particularly at higher frequencies, due to interactions between GO nanoparticles and polymer chains. The improved segmental motion and flexibility of the polymer chains enhance conductivity, confirming the role of GO as a dopant that optimizes both structural and electronic characteristics. The tunable band gap of HPMC/Cs-GO nanocomposites (4.10–5.20 eV), enhanced dielectric response (ε’ ~10⁴), and improved AC conductivity (~ 10⁻⁵−10⁻⁴ S/cm) enable diverse applications. Its UV absorption and low transmittance (31–92%) make it suitable for flexible UV photodetectors/optical filters. Its dielectric properties are compatible with those of thin-film organic transistor gate insulators or supercapacitor separators. Combined with interfacial polarization effects and flexibility, these materials are promising for wearable dielectric capacitors in low-frequency electronics, enhancing mechanical adaptability and energy storage efficiency.