Article Content
1 Introduction
Pumps and turbo pumps are widely used in many engineering sectors such as thermal power generation, propulsion systems, nuclear power, marine power, and water supply systems [1]. Pumps are generally categorized as dynamic and displacement types. In the former category, the energy is continuously added to the pumping medium, like a centrifugal pump, and the medium is not confined in a fixed volume. In displacement type of pumping, such as a diaphragm pump, on the other hand, the pumping medium is held inside a predetermined volume, while the energy is regularly added to it. An electric motor or engine can be used to drive pumps. A centrifugal pump consists of rotating vanes within a casing, which through the centrifugal force impart energy to the fluid. A mechanical energy from motor is transformed by centrifugal pumps into the energy of a moving fluid. While a part of this energy is transformed into the fluid kinetic energy, the rest is transformed into potential energy. The fluid pressure or the height of fluid above gravity represents the potential energy [2, 3]. Centrifugal pumps are used in diverse applications such as chemical and steam power plants, sewage, water supply, oil refineries, food processing, and mines. Pumps convert mechanical energy into hydraulic energy [4]. Centrifugal pumps can also be categorized as a single stage and multi-stage. While a single stage pump develops the head by a single impeller, multi-stage pump often develops the total head using several impellers in series, each taking suction from the discharge of the previous.
The pump shaft represents the main rotating element in a centrifugal pump. It is a very critical component for the transfer of power from drive unit to the other rotating elements. Furthermore, it supports rotating parts or transmits motion or power through axial or rotational movement. Moreover, it serves as a connection element between the driver unit and the impeller, which is mostly a gas turbine or an electric motor. The pump shaft is mainly subjected to axial force resulting from the difference in pressure at front and backside of the impeller and radial force from the unbalanced pressure forces in the spiral casing [5]. Either a mechanical component’s strength declines or the increase in load on the component causes mechanical components to fail. A pump’s performance is affected when a pump part fails, leading to either efficiency drop or the pump’s total failure. The high loads under which the pump operates and the need for the pump to run continuously in industrial applications increase the likelihood of serious issues including component degradation and pump failure. In these situations, the whole facility will have to be taken down until the pump is restored. Under certain operational situations, a pump must operate dependably to avoid the significant financial losses that would result from such a shutdown [6]. Stress concentration sites on shafts such as keyway root radius and sharp changes of cross sections can initiate fatigue cracks.
Stress concentrations weaken the fatigue strength of the component [7]. Shafts are commonly subjected to a range of loads leading to vibrable stresses [8]. Overload, cyclic stress, deterioration of material strength, corrosive and erosive working conditions, poor surface quality, inadequate tolerances, and inappropriate thermal treatment are the main causes of pump component failure. Studies shows that pump shaft is subjected to global mechanical load including elementary loads such as axial load, radial load, bending moment, and torsional load [9].
Centrifugal pump vibration is also another cause of shaft failure. Centrifugal pump rotor system is a complex vibration system due to the unsteady multi-scale fluid–solid interactions (FSIs) [10]. During the operation of centrifugal pump, vibration that occurs can cause fatigue and damage of pump components and weaken the operation stability. Studies show that FSI is a cause of highest vibration levels in large centrifugal pumps. Moreover, hydraulic excitation forces are due to the FSI and cause pressure fluctuations, mechanical vibrations, and alternating stresses in different components of centrifugal pump [11]. The vibration problem of centrifugal pumps is bound to bring challenges to the safety and stability of operation and mainly reflected in rotor system of the pump [12,13,14,15]. Vibration has major impact on pump components as it plays a role in reducing expected life of the pump components [16]. Flow-induced vibration and noise are caused by the unsteady flow of fluid in the pump, and its mechanism is complex and changeable, including dynamic and static interference, rotating stall, backflow, and outflow [17].
Several studies are reported on fatigue investigation of centrifugal water pump shafts. Das et al. [8] analyzed the early failure of two pump countershafts that were used to lift slurry. The analysis was done employing hardness tests, fractography analysis, tensile and impact testing, chemical analysis, and microstructural characterization. The fractography analysis in both cases indicated signs of fatigue failure. The outcome of the study shows that cracks were initiated at key area of the shaft. The heat treatment is the main contributor to the shaft failure. Adam et al. [18] performed an investigation on fracture of centrifugal water pump shaft used in seawater cooling system of a diesel generator. The objective of the study was to justify why fractures in pump shafts occurred. Investigation of erosion damage, examining the working circumstances of the pump, spectrum analysis of the pressure fluctuations, and natural frequencies under bending and torsional vibrations were all included in their analysis. The cause of the failure was due to occurrence of resonance and fluctuation of the pressure in relation to the number of impeller blades and the shaft speed frequency. Bachche et al. [19] performed static and dynamic analysis of centrifugal pump shaft. They employed finite element analysis was to analyze the shaft’s stresses and deflections. In the study at minimum flow rate of the pump, maximum deflection and stress were found. A study on fatigue failure evaluation of the lubricating oil pump shaft was carried out by Gambhire et al. [9]. The study used theoretical research to validate the shaft design against fatigue.
Nasir et al. [20] conducted pump shaft fatigue failure analysis through mechanical design analysis of the shaft. They employed modified Goodman criterion to identify cause of the failure. They concluded that the rotor shaft failed because of fatigue crack initiated at root region of threaded part due to continuous fatigue loading. Computational fluid dynamics (CFD)-based simulation of the 3D flow field inside the pump improved the accuracy of the computation results, facilitating the possibility to analyze the impact of various flow parameters and the collective flow field on the flow dynamics [21]. Research on centrifugal pumps indicated that fluid–structure interaction (FSI) analysis enables the visualization of Coriolis and centrifugal forces generated by the impeller where the pressure distribution is used to perform fatigue investigation on the shaft. FSI analysis is an interaction between a solid structure and fluid flow, and this analysis can be done by two ways of coupling the fluid with the structural parts: (1) one-way and (2) two-way coupling. As it was stated in Benra et al. [22], the CFD results from one-way FSI analysis were transformed to the structural part by one-way approach. On the other hand, the structural deformations in two-way FSI analysis, due to fluid interaction, are fed back to the CFD field and the change in the flow due to the deformation of the structural section is analyzed. The study by Gu et al. [23] shows that von Mises stress of mechanical components significantly affected by fluid pressure. According to Piperno et al. [24], for the rotating system’s safe operation at any rate of flow, it is essential to analyze impellers’ stress and deformation in the unstable operating region using fluid–structure interaction (FSI) analysis.
Though many researchers conducted both experimental and theoretical fatigue investigation of centrifugal pump shaft, further work is still needed in the fatigue study of high load operating centrifugal water pump shaft. Furthermore, insufficient FSI-induced fatigue analysis of centrifugal pump shaft was performed. In particular, the fatigue analysis of multi-stage centrifugal pump shaft needs further scrutiny by considering hydraulic forces of the fluid, since previous research were performed considering torque, weight of the impellers and self-weight of the shaft. Moreover, fatigue analysis of multi-stage centrifugal pump shaft at various flow rates was not previously performed. Research shows that as pump operates away from design operating conditions, the radial forces of impeller increase. Thus, there is need of conducting fatigue analysis of pump shaft at off-design point considering fluid pressure or hydraulic forces under different flow rate of multi-stage centrifugal pumps.
Based on the observation from previous studies on centrifugal water pumps, this study aims to examine the multi-stage centrifugal water pump shaft’s fatigue performance under varying load conditions. In this study, 3D Navier–Stokes and energy equations will be solved in ANSYS CFX 19.0, to numerically study fatigue in centrifugal water pump shaft at different operating conditions.
2 Materials and methods
FSI-induced fatigue structural stress evaluation of the shaft on 3-stage pump was carried out in ANSYS 19.0 Workbench considering the load and applying boundary conditions. The shaft was simply supported by bearings from both ends. The structural analysis of the shaft was then performed by considering torque from the drive unit, the load due to the weight of three impellers, self-weight of the shaft, and fluid pressure of the pump.
In this study, materials for the shaft and the impeller were selected based on the need for strength and corrosion resisting properties. Accordingly, X5-Cr-NiMo17-12-2 stainless steel and G-Cu-Sn10 Copper Tin Alloy were selected for the shaft and for impeller, respectively. Table 1 shows mechanical properties of the used materials.
The data on pump geometry was collected from a water treatment station in Jimma. ANSYS 19.0 and SolidWorks modeling software were used to model and analyze the FSI-induced stress of multi-stage centrifugal water pump shaft. After modeling the impeller in Vista CPD Design tool, the CFX module in ANSYS was employed to conduct steady state analysis.
To conduct the one-way FSI, first components of centrifugal pump impeller, diffuser with return guide vane, inlet and outlet casing was modeled. The next step was to generate fluid domain of each component. After fluid domain is generated, unstructured mesh was used to generate fluid domain mesh. Following mesh generation of fluid domain, CFD analysis was performed in ANSYS 19.0 CFX. The next step was mapping CFD result to static structural analysis in the ANSYS 19.0 Workbench to perform fatigue analysis of the shaft. Schematic diagram that shows the procedure of the one-way FSI analysis is shown in Fig. 1.
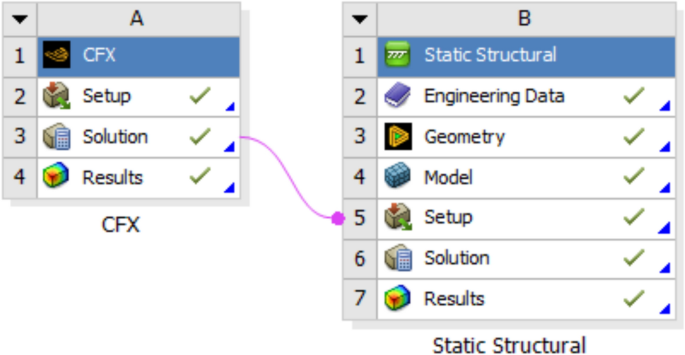
Schematic diagram of one-way FSI
The study used k-SST omega turbulence model and no-slip condition, and smooth wall function was selected to model the wall of the solid parts. Fatigue stress of the pump shaft was performed using one-way FSI analysis. The conservation law governed by fluid dynamics was employed, which are given as follows [25]:
where ρ is density, µ is the dynamic viscosity, is velocity vector, p is pressure, i and j are tension notations, is tensor of apparent stress turbulence. The SST model is based on k − ω and accounts for the turbulence shear stress. The unknown turbulent viscosity µt is obtained from computation of the energy k and frequency ω of the turbulence. These equations can be formulated as:
Because the rotating impeller and stationary diffuser are associated through the frozen rotor, the impeller is modeled in the frame of the rotating blade while the diffuser is modeled as fixed frame of reference. Table 2 displays the boundary conditions used to conduct the CFD analysis.
As indicated in Table 2 above the pump was simulated at different flow rate conditions where 3D incompressible Navier–Stoke’s equations were computed in ANSYS 19.0-CFX Solver. Due to its complexity and high computational requirement in CFD analysis, leakage was not considered. Moreover, because of the complex geometry of fluid domain in the pump, unstructured tetrahedral mesh cells were used in CFX meshing. Figure 2a–d shows unstructured tetrahedral mesh cells of the CFD fluid domain.
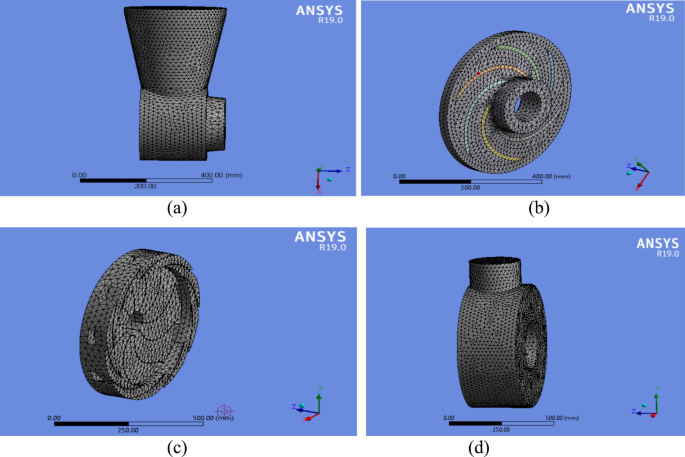
Mesh cells of CFD fluid domain for (a) inlet, (b) impeller, (c) diffuser with return guide vane, and (d) outlet casing
3 Mesh independence test for CFD simulation
Before conducting CFD analysis, mesh independence test in the domain of the flow was performed to assure accuracy of the CFD. To conduct the test, seven mesh element sizes with the identical settings were performed to check influence of element size on the result of the analysis. The mesh independency test was conducted for both CFD simulation and structural fatigue analysis. Table 3 shows that the numerical results are only minimally influenced by the grid size, with the overall difference being less than 1%. Therefore, considering computational time and cost, 2,353,607 elements were chosen to perform CFD analysis.
Unstructured meshes for the shaft and impeller were used to perform FSI fatigue stress analysis of the shaft using pressure distribution obtained from CFD analysis. Figure 3a and b depicts the shaft and impeller assembly of the unstructured mesh of the assembly, respectively.
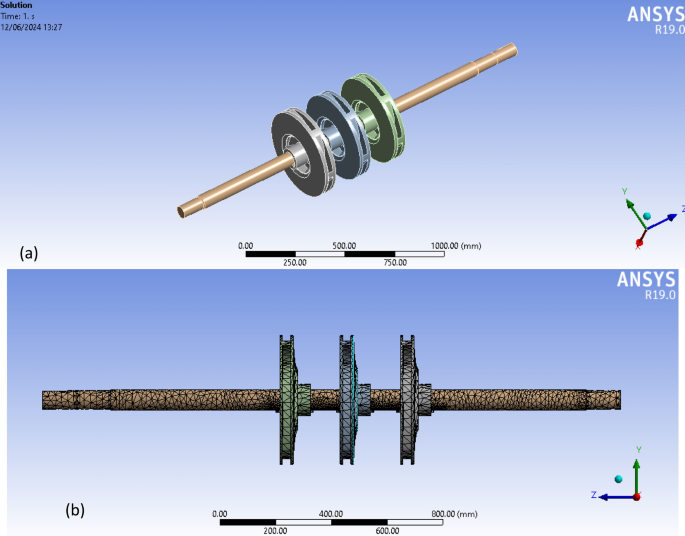
a Shaft and impeller assembly and b Meshed assembly for fatigue structural analysis
4 Discussion of results
Three-stage centrifugal pump was simulated at flow rates varying from 0.6Qd to 1.4Qd, where Qd is the design flow rate in m3/hr. The findings reveal that the total head of 203.597 m was obtained at design flow rate (Qd = 439.2 m3/hr). Numerically obtained total head over predicted the design pump head, which is 191 m. Because the CFD analysis assumed that surface of the hydraulic components impeller, the diffuser including the return guide vanes was smooth, deviation between design flow rate head and CFD simulated head are observed. Studies show that surface roughness of pump components affects the characteristic curves of the pump. The pump’s head and efficiency dropped as the roughness increased, while the power consumption remained nearly constant [26]. Some literatures state that surface roughness change from 100 to 300 μm can cause pump head decrease by 9.06–14.73% [27]. Study by Wang et al. [28] also showed when surface roughness increases from 0 to 600 µm, the head decreased by 11.9%. The other case for deviation of the head was due to leakage flow was neglected in CFD analysis because of complexity to predict leakage accurately and its high computational cost. In a previous study of the authors [29], head versus flow rate of CFD simulation results were studied and it was observed that the pump head decreased when the flow rate was increased and vice versa. The reason for this inverse proportionality is that the shaft power depends on water density, flow rate and pump head. So, for constant shaft power, the flow rate and head are inversely proportional to each other.
4.1 Pressure distribution
The pressure distribution obtained from CFD varies along span of the impeller. Low overall pressures were noted close to the impeller’s hub. High pressure was observed at the impeller’s trailing edge. At 60% of the design flow rate (143.52 m3/hr), which is one of the extreme scenarios, the pressure distribution results are shown in Fig. 4. The pressure distribution on the impeller increases with the stages. As Fig. 4a shows maximum value of the total pressure stage 1 is 0.763 MPa, and the minimum value is − 0.0993 MPa. It is also observed from Fig. 4b and c that maximum value of the pressure at 2nd and 3rd stage are 1.386 MPa and 1.973 MPa, while the minimum total pressures are 0.536 MPa and 1.155 MPa, respectively.
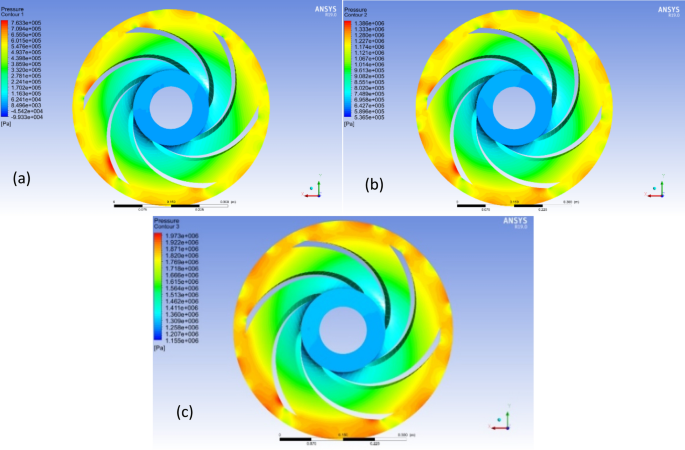
Pressure distribution on the impellers at a Stage I, b Stage II and c Stage III
Using the same CFD simulation settings, analysis was performed at selected pump operation flow rates from 0.6 to 1.4Qd. The resulting pressure distributions are summarized in Table 4. In general, the fluid pressure rises as it moves from the pump’s first stage impeller to its third stage impeller at varying flow rates, as shown in Table 4. The overall maximum pressure was obtained at the 3rd stage under all operating conditions. Additionally, when the pump’s flow rate rises, its pressure falls, and vice versa. Typically, in centrifugal pumps, as the pressure required to move a fluid increases, the flow rate decreases. This is because the pump must work harder to overcome the resistance created by higher pressure. Conversely, if the pressure requirement is lower, the pump can deliver a higher flow rate. As it can be observed from Table 4, maximum pressure of 1.973 MPa was observed at low flow rate 0.6Qd. The reason for the high pressure at low flow rate is due to pressure pulsations that occur because of interaction between the pump’s impeller and volute, causing unsteady flow and increased pressure fluctuations. Centrifugal pumps experience high pressure fluctuations at low flow rates due to the generation and development of vortices within the impeller flow passage, which can block flow and disturb the internal flow field.
4.2 Mesh independence analysis for structural analysis of the shaft
Mesh independence analysis was performed to be sure that the results obtained by ANSYS 19.0 is mesh independent. As it can be observed from Table 5, mesh element size minimally influence result below 7 mm element size. Considering computational cost and time for numerical analysis, 7 mm mesh element size was then selected for the analysis. After performing mesh independence test, the numerical analysis of the shaft was performed.
4.3 Fatigue stress analysis of shaft without considering fluid pressure
Structural fatigue analysis of the shaft was performed by considering torque from motor, load due to the weight of three impellers and self-weight of the shaft. To compare the fatigue stress results due to FSI in terms of pressure distribution in the pump, fatigue stress analysis of the shaft without pressure of water flows was also performed. As depicted in Fig. 5, the max. equivalent shaft stress is 122.6 MPa while the min. equivalent stress is 0.336 MPa.
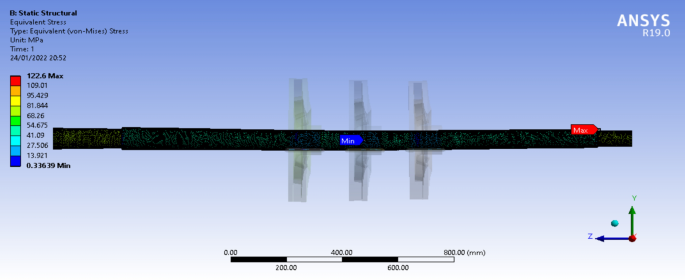
Equivalent shaft stress distribution
4.4 Analytical fatigue analysis of the shaft
Analytical stress analysis of the shaft was also performed to validate the numerical analysis results obtained from ANSYS 19.0 without considering fluid pressure on the impeller. This analysis was performed by taking stress concentration factors into account at the change of the geometry. While rotating, the shaft is subjected to a load that varies from compressive to tensile stress because of bending moment, and hence the mean bending stress is zero. In addition, the shaft under operation was rotating with constant speed, and thus the alternating torque becomes zero. Considering the maximum bending moment on the shaft and fatigue concentration factor of kfb (1.64) and kft (1.4) for bending and torsion, respectively, the equivalent stress was calculated. The values of kfb and kft were determined considering shaft diameter and filet radius of the shaft as given in Shigely’s book of Mechanical Engineering Design (Budynas and Nisbett, PP. 287–288 and PP. 1008 [30]). Axial load was neglected since the effect of axial load can be prevented by axial thrust balancing devices. By determining the bending moment across the length of shaft at different locations, the resulting maximum bending moment of 1,085.92 Nm was obtained. The mean torque of 2,194.87 Nm from the motor was applied to the shaft. Analytical fatigue stress analysis of the shaft was performed using Eq. (5) and (6) [30].
where kfa, kfb, and kft are the fatigue stress concentration factor in axial, bending, and torsional loadings, respectively.
Analytical fatigue stress analysis using Eqs. (5) and (6) yield equivalent stress of 120.588 MPa in the shaft. Referring to the numerical simulation results in Fig. 5, the numerical fatigue analysis result is 122.6 MPa implying that both analytical and numerical analysis results agreed with minimum error percentage, which can partly be attributed to absence of axial loads.
4.5 FSI-induced fatigue stress analysis and total deformation of the shaft at different flow rates
According to studies, the size of the expected mechanical or hydraulic stress on the bearings and the shaft that can arise during operation must be taken into consideration by the designer while creating the pump’s mechanical components. The hydrodynamic forces contribute the most to the rotor loads. This study targets analysis of fatigue stress in a shaft of 3-stage centrifugal pump at varying flow rates. In the following paragraphs, the FSI-induced fatigue stress analysis and total deformation results for the two extreme cases, i.e., 0.6Qd and 1.4Qd, and the design flow rate values are discussed supported by their simulation plots, while the other flow rates considered in the study will be summarized (tabulated) with reference to their appended simulation plots (Appendix A).
- (a)Fatigue stress and deformation at 0.6Qd flow rate: Fig. 6 a and b) show the fatigue stress and deformation analysis results of the centrifugal water pump shaft, respectively, at 0.6Qd flow rate. The figure shows that max. equivalent stress is 141.19 MPa and min. equivalent stress is 0.52 MPa, while the total deformation obtained is 0.507 mm.
- (b)Fatigue stress and deformation at Qd flow rate: Fatigue stress analysis of the pump shaft was also performed at design flow rate of the pump. As Fig. 7a shows, the maximum equivalent stress of the shaft at Qd flow rate is 137.58 MPa and min. equivalent stress is 0.25 MPa. As displayed in Fig. 7b, the total deformation at the design point flow rate is 0.465 mm.
- (c)Fatigue stress and deformation at 1.4Qd flow rate: Finally Fatigue stress analysis of the pump shaft at 1.4Qd of the pump (Fig. 8a shows that the maximum equivalent stress of shaft is 142.88 MPa, which is higher than the equivalent stress at the design flow rate, and the minimum equivalent stress is 0.24 MPa. The registered total deformation (Fig. 8b) is 0.435 mm, which is slightly lower than that of the design point deformation.
- (d)Summary of results from FSI induced fatigue stress analysis and total deformation: The simulation results for both the equivalent stresses and total deformations are summarized in Table 6. The simulation plots are appended in Appendix A.
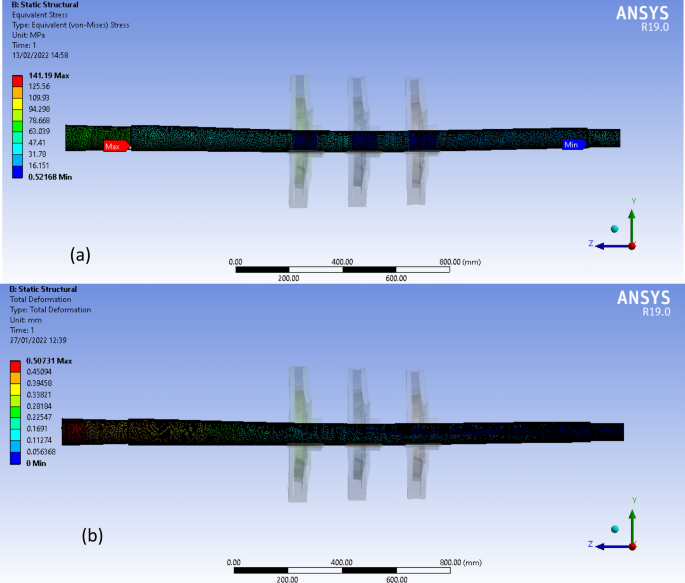
a Equivalent stress, and b total deformation of the shaft at 0.6Qd
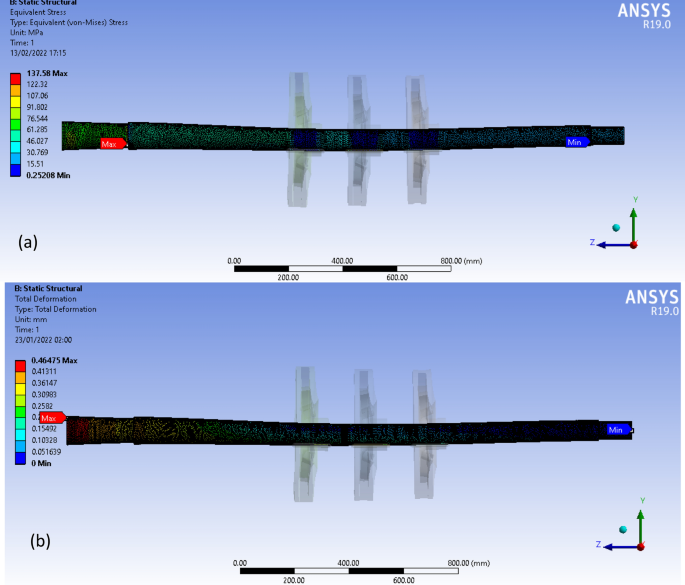
a Equivalent stress, and b Total deformation at Qd flow rate
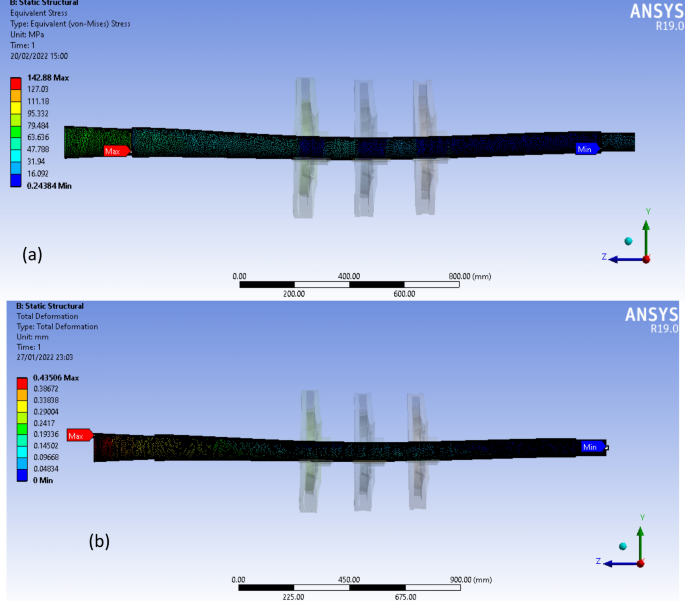
a Equivalent stress, and b Total deformation at 1.4Qd flow rate
Simulation results of equivalent stresses and total deformations at other flow rates other than 0.6Qd, Qd and 1.4Qd are shown in Appendix A. From these appended materials and the data listed in Table 6, it is observed that the maximum stress and total deformation of the shaft at other flow rates apart from 0.6Qd, Qd and 1.4Qd, i.e., at 0.7Qd, 0.8Qd and 0.9Qd, experiences decreasing trend as the flow rate increases toward the design flow rate Qd. Also, at 1.1Qd, 1.2Qd, and 1.3Qd the equivalent stress increases as the flow rate increases but the deformation pattern declines, which can be attributed to increasing turbulence which creates fluid damping after certain point of operation. Generally, as it is listed in Table 6, fatigue equivalent stress in the shaft decreases for all flow rates with decreasing flow rates that are lower than the design flow rate, which is because at very low flow rate of pump, the peripheral pressure distribution along each stage impeller becomes less and less uniform. Additionally, research indicates that the creation of asymmetrical pressure and velocity fields outside the best efficiency point (BEP) results in radial loading [31]. The diffuser’s geometrical shape in multi-stage pumps, the operating environment or the non-symmetrical inflow can all lead to the non-uniform pressure distribution [32]. As non-uniformity of the pressure on the impeller increases, it causes high radial stress on the impeller which acts on the shaft resulting in high stress of the shaft at low pump flow rate. Thus, the fatigue stress of the shaft at the design flow rate becomes minimum because, the circumferential pressure at design flow rate of the pump acts on the impeller at each stage relatively becomes uniform causing less radial load. This is because, as stated in study by Cui et al. [33], lowest radial force appeared at the design flow rate, and radial forces increased at off-design conditions. The radial force increased with decreasing flow rate. Thus, uniform pressure around the impeller circumference results in less fatigue stress. The findings are in good agreement with the study reported by Mohand-Amokrane et al. [32] which states that the stress on the shaft decreases with rising pump flow rate toward the design point.
The numerical simulation results (Table 6) also shows that fatigue stress of the shaft increases with increasing flow rate above the design point because at very high flow rate, the peripheral pressure distribution along each stage impeller becomes non-uniform. As non-uniformity of the pressure increases when the pump operates away from its design operating condition, it creates substantial radial load. The operation of the pump away from design flow rate of the pump causes high radial stress on the impeller which acts on the shaft resulting in high stress of the shaft at high flow rate of the pump. Studies also show that non-uniform distribution of pressure resulted in radial force on the impeller. For instance, Cui et al. [33] reported that high radial load of impeller generated at high flow rate away from design point. The high radial load generated at higher flow rate leads to high fatigue stress of the shaft. In both cases of the flow rate, i.e., when the pump operates at higher or lower flow rate than the design point flow rate of the pump, the study shows that the fatigue stress of the shaft increases. This is because as the radial load on the impeller acting on the shaft increases due to occurrence of non-uniform pressure along the circumference of impeller in both high or low operating condition of the pump. The fatigue stress at the design flow rate becomes minimum. This is because at design flow rate the circumferential pressure acts on the impeller at each stage relatively becomes uniform causing less radial load. The uniform pressure around the circumference results in less fatigue stress of the shaft at design flow rate.
The findings of this study agree with previous research [33], where it was stated that the radial forces vary with the deviation of flow rate from the design point. In other words, radial load is minimum in the best efficiency zone or at the best efficiency point. The impeller’s design justifies this fact, which produces a uniform static pressure at impeller periphery during operation at the optimal flow efficiency by maintaining a constant velocity. High radial loads on pump bearings because of a shift in the pressure distribution surrounding the impeller as the flow rate deviates from the BEP. The shaft is experienced a greater radial load at lower and higher flow rates, which can cause the shaft to be exposed to severe stress and strain. In this study, however, high strains are registered for the lowest flow rate because the deformation generally decreased with increasing flow rate (Table 6). As it is shown in Table 6, the total deformation at 1.4Qd flow rate is less than the total deformation obtained at 0.6Qd flow rate. Even though the deformation is expected to follow the stress trend, the deformation trend shows a reverse relation or nonlinear behavior, and the deformation becomes less at some points due to turbulence generation at higher flow rates that provide fluid damping effects.
5 Conclusions
In this study, ANSYSS 19.0 CFX was employed to investigate the effect of fluid pressure on a the shaft of a 3-stage centrifugal pump at varying flow rates from 0.6 to 1.4Qd. A steady-state solution with k-SST model was used to perform CFD analysis, whose result indicates that the pump head decreased with increasing flow rate and vice versa. The pump head obtained from the CFD was above the design point value, which was 191 m. This deviation can be attributed to the neglected leakage in the analysis and partly because of the assumption that the surfaces of the impeller and the diffuser are smooth.
The study results show that the shaft is exposed to maximum equivalent stress at extreme end off-design operating conditions of the pump, i.e., at 0.6Qd and 1.4Qd flow rate. The equivalent stress observed at 0.6Qd and 1.4Qd flow rates was 141.9 MPa and 142.88 MPa, respectively. In all cases of off-design condition of the pump, equivalent stress was higher than the equivalent stress at the design flow rate, which is 137.58 MPa. This can be as the result of the off-design operating conditions; pressure distribution on the circumference of impeller of the pump becomes non-uniform which causes increase in radial load on the impeller and the shaft. Operation at design point creates uniform distribution of the pressure on the impeller’s circumference, which causes less radial load leading to lower equivalent stress of the shaft. Based on the results of this research, therefore, operating shaft at design flow rate is recommended for safe operation of the pump. This recommendation is, however, valid under the limitation of the research where the study did not include impact of cavitation and vibration on fatigue analysis of multi-stage centrifugal pump shafts. Furthermore, the impacts of corrosion on the fatigue analysis of the shaft were not accounted for.