Article Content
Abstract
We explore, both theoretically and through a laboratory experiment, the impact of different forms of higher-order punishment on third-party behavior and cooperation levels within a public goods game. This investigation may shed light on how norms influence national governments, as monitored by international organizations or disciplined by electoral competition, and how these norms are subsequently enforced on and followed by domestic agents, e.g., businesses. Specifically, we compare two main treatments that represent the effects of competitive elections and external monitors in a stylized form. These treatments are contrasted with a control condition that lacks an additional layer of norm enforcement. While both higher-order punishment institutions enhance cooperation compared to the control, our findings reveal differences between the two scenarios: Evaluation of the third party by an uninvolved agent leads to heightened punishment and reduced free-riding, whereas competition between two third-party candidates results in more strategic and selective punitive actions.
Does corruption affect cooperation? A laboratory experiment

Polarize, catalyze, and stabilize: how a minority of norm internalizers amplify group selection and punishment

How More Severe Punishment Generates Less Norm Enforcement. Further Evidence of Paradoxical Effects of Norm Enforcement in Inspection Games
Explore related subjects
Discover the latest articles and news from researchers in related subjects, suggested using machine learning.
- Comparative Politics
- Democracy
- Game Theory
- Prison and Punishment
- Prosocial Behavior
- Prison Policy
1 Introduction
Sanctions imposed by third parties are crucial in fostering and enforcing cooperative behavior and adherence to norms across economic and social interactions. Typically, designated individuals or organizations monitor group behavior and may impose sanctions when deviations from established norms occur. In economic and other societal contexts, national governments and government agencies are supposed to act as third parties, with the power to influence businesses and other entities not only through formal regulatory measures but also by signaling disapproval of certain behaviors through guidelines, public statements, or informal pressures.
For instance, many national governments take part in international agreements such as the OECD’s Base Erosion and Profit Shifting (BEPS) initiative, aimed at mitigating corporate tax dodging by implementing and enforcing more stringent tax policies. Achieving this requires critical political decisions and international coordination to reduce opacity and close loopholes that enable aggressive tax avoidance. Such opportunities distort the competitive landscape, disadvantaging businesses that refrain from engaging in gray tax practices. Nevertheless, watchdogs like the Tax Justice Network report that numerous countries still facilitate multinational corporations in paying less tax than expected (Tax Justice Network, 2021). This suggests that many nations have either not fully adopted the necessary legal measures or are failing to enforce international tax conventions effectively at the national level.Footnote1
This paper explores ‘higher-order’ mechanisms to enhance the effectiveness of third parties, such as national governments, and to hold them accountable, using theoretical analysis and a laboratory experiment based on a public goods game. It investigates how two distinct approaches influence the behavior of these third parties across various policy domains: firstly, scrutiny from ‘fourth parties’– including civil society groups like the Tax Justice Network and international organizations such as the OECD; and secondly, the dynamics of competitive elections. Furthermore, our study assesses which incentive regimes– higher-level monitoring by a fourth party or electoral competition for the role of third party– are more effective, when considered in isolation, at ensuring compliance and cooperation among the entities (e.g., businesses) these third parties monitor.
We have chosen a combined theoretical and experimental approach because, in real-life scenarios, the two forms of higher-order institutions typically coexist, and their effects are intertwined. Disentangling the distinct impacts of each in a controlled, abstract setting may shed light on an important aspect of international political economy: how different oversight mechanisms influence the compliance of governments and nonstate actors, particularly in areas where public goods span national borders. International relations research suggests that state leaders, sensitive to reputational concerns, often react to criticism and performance evaluations from international organizations (e.g., Kelley and Simmons, 2021), leading not only to greater formal adherence to international agreements but, at least sometimes, influencing the actual behavior of nonstate actors within those countries (Jensen and Malesky, 2018). Nonetheless, it remains an open question how this fourth-party monitoring compares to alternative mechanisms such as electoral competition. Our study aims to address this gap, providing insights into the strengths and weaknesses of higher-order institutions in the realm of public goods.
While the paper does not focus on any specific policy area, examples such as global tax policy not only illustrate how lacking public good contributions can be a key part of electoral campaigns but also show how international organizations can act as fourth parties. For instance, U.S. presidential candidates like Bernie Sanders and Elizabeth Warren, during their 2020 primary campaigns, have emphasized strengthening global tax policy and fighting corporate tax avoidance, reflecting this dynamic in their platforms. Additionally, organizations such as the OECD, the World Bank, civil society groups, and activist watchdogs evaluate and potentially critique policies, imposing reputational costs on national governments (see Kelley, 2017) and promoting fairer enforcement. This influence is evidenced, for example, by the OECD’s BEPS project, which eventually prompted Ireland to reform its tax strategies, notably phasing out the ’Double Irish’ scheme in response to OECD and other international criticism (The Irish Times, 2014a, b).
Our theoretical model and experiment build on a public goods game, a standard model of social dilemmas often encountered by groups of agents. Importantly, previous research, such as that by Cubitt et al. (2011), has established that free-riding in this context is widely viewed as morally blameworthy. Additionally, many real-world scenarios mirror the public goods game. For instance, tax avoidance and tax evasion have been analyzed within this framework in studies by Fortin et al. (2007); Coricelli et al. (2010), and Blaufus et al. (2016).
In the experiment, a third party observes contributions in the public goods game and can choose to punish individual players at a cost to himself. The willingness of third parties to punish norm violators has been documented by numerous studies (e.g., Fehr and Fischbacher, 2004; Mathew and Boyd, 2011; Traxler and Winter, 2012). Building on this Baseline game, we vary the third party’s incentives as follows: (i) another uninvolved outside player, referred to as Fourth party, evaluates and possibly sanctions the third party;Footnote2 (ii) in Competition, two third party candidates compete via their punishment proposals to be selected as the third party by the participants of the public good game. The negative payoff consequences for the third party (candidate) when others– the fourth party or the majority of public good players – disapprove of their punishment behavior are identical.
Our experimental results indicate that fourth-party monitoring results in more severe and widespread punitive actions by third parties, even with higher overall contributions. In contrast, electoral competition leads third parties to strategically direct punishment only towards the least contributing agents. These results are in line with the hypotheses derived from the theoretical analysis. Furthermore, our experimental results show that, while the earnings of public good players improve in both treatments compared to the Baseline, Competition did best in this respect, combining reasonably high contributions with low average punishment.
1.1 Related experimental literature
To the best of our knowledge, different mechanisms to motivate and control a third party have not yet been studied in a comparative perspective. While studies such as those by Cinyabuguma et al. (2006) and Fu et al. (2017) have explored the dynamics of higher-order sanctions within peer punishment contexts– specifically, whether public good players who fail to punish or those who engage in antisocial punishment are themselves punished by their peers– we are aware of only three papers that have directly considered sanctions against third parties: First, Martin et al. (2019) compare how often higher-order punishment was targeted against second and third parties– i.e., agents who, respectively, were the victim of and observed a theft– who failed to punish the perpetrator. The authors found that higher-order sanctions were more common against non-punishing observers than against non-punishing victims. This finding indicates that third party punishment has a more normative character – an observer who does not react or reacts too much or too little to an observed norm violation will often be seen as violating normative standards of behavior himself. A key difference to our study is that Martin et al. (2019) focus on the psychological mechanisms underlying higher-order punishment, which they suggest are similar to third-party punishment, whereas we focus on the effect of institutional arrangements. Secondly, the studies by Kamei (2020) and Kamei et al. (2023) examine higher-order sanctioning when multiple third parties are present. Kamei (2020) found that allowing third parties to determine the level of punishment democratically avoids both antisocial punishment and overly harsh punishment of norm violators. The focus of Kamei et al. (2023) is the potential free-riding problem among uncoordinated third parties. Unlike this scenario, our Competition treatment does not involve a free-riding problem among third-party candidates but focuses on the disciplining effect of electoral competition on punishment behaviors. While Kamei et al. (2023) also explore how cultural differences (loose vs. tight kinship ties) influence these dynamics, this aspect does not feature in our analysis.
Our work is also related to studies such as Kurzban et al. (2007) and Kamei (2017, 2021) that examine how third parties’ behavior is affected when their decisions to punish will be known by others (also see Filiz-Ozbay and Ozbay, 2014 on audience effects). A major difference with this literature is that in our experiment the third party is not only observed, but their decisions are also subjected to an explicit evaluation that includes potential payoff consequences.
More broadly, our study adds to research on designing governance regimes to address social dilemmas. For instance, Nicklisch et al. (2016) explore options in a public goods game where players choose between a no-punishment environment, a centralized environment with a single randomly selected enforcer, and a decentralized environment where all players have punitive powers. Similarly, Fehr and Williams (2018) compare forms of decentralized peer punishment with a centralized scenario where public good players collectively choose one group member by majority vote to wield punitive powers. Gross et al. (2016) explore a more flexible arrangement, where each player can independently transfer segments of their punitive power to one or several other group members. By contrast, our Competition treatment introduces a unique dimension where punishment is determined by a third party not involved in the public goods game, and third parties compete on specific punishment proposals each period. This setup simulates an electoral-like competition, aiming to reveal whether such competition can enhance the performance of third parties in enforcing social norms effectively, thereby providing insights relevant to debates on electoral mechanisms and governance effectiveness in real-world settings.
2 Theoretical framework and hypotheses
2.1 Model
The baseline game
Consider a group S = \{1, 2, \dotsc, m\} where we assume the group size, |S|, to be odd to avoid complications later on. Each individual i \in S can use part of his personal endowment to make a voluntary contribution c_i to a public good that benefits all group members, and keep the rest. We refer to the members of group S as public good players.
We assume that each player i is motivated by both material self-interest, which gives them incentives to free-ride on the contributions of others, and a preference for adhering to a social contribution norm (Krupka and Weber, 2013; Gächter et al., 2017). Building on d’Adda et al. (2020), we think of a contribution norm N as containing two elements: first, agents’ idea about the-right-thing-to-do, r \in \mathbb {R}_+, which is a primitive notion in our analysis,Footnote3 and second, an agent’s expectation of how much others contribute, {\textbf{E}}(c). Specifically, N is the value of a function that computes a weighted average of these two elements:
\begin{aligned} N = (1-\beta ) r + \beta {\textbf{E}}^I(c)\,, \quad \quad \quad \beta \in (0,1) \,. \end{aligned}
The weights 1- \beta and \beta measure, respectively, the importance attached to individual values and to conformity with others. Since different punishment institutions may affect expected contribution behavior and thus the applicable norm, we will write {\textbf{E}}^I(c) and N^I to emphasize the dependence on the institutional setting. We will consider I \in {Base, FP, Comp}, referring to our Baseline, Fourth party and Competition models of third party punishment.
An outside authority, or third party (T), who does not take part in the public good game (PGG), observes all contributions and experiences a disutility when the relevant normative standard N^I is violated. This disutility could reflect, for example, inequity aversion (Fehr and Schmidt, 1999), or anger towards violators (Jordan et al., 2016). T can, at a cost to himself, direct punishment p_i \ge 0 to public good player i \in S, with the goal to minimize the loss function
\begin{aligned} \mathcal {L}_{T} = \kappa \sum _{i\in S} p_i + \sum _{i\in S}\frac{(N^I-c_i-p_i)^2}{2\theta _T}, \end{aligned}
where \kappa \in (0,1) captures T’s cost per unit of administered punishment. Punishment enters negatively into the norm-related terms of T’s loss function of Eq. 2, capturing the assumption that the loss from a norm violation is “healed” to some extent when the violator is punished (Xiao and Houser, 2005). The trade-off between the material and the normative interests is governed by T’s privately known type \theta _T. The closer \theta _T is to zero, the more importance T attaches to norm-compliant behavior.
Each public good player i \in S forms an expectation of the punishment he will face when he contributes c_i and the vector of all contributions is \textbf{c} = (c_1, \dotsc, c_m) and anticipate the loss suffered from others’ norm violations; i minimizes the loss function
\begin{aligned} \mathcal {L}_i = c_i + \lambda {\textbf{E}}(p_i|\textbf{c}) + \frac{(N^I-c_i)^2}{2\theta _i} + \sum _{\begin{array}{c} j\ne i \\ j \in S \end{array}}\frac{{\textbf{E}}\left[ (N^I-c_j-p_j)^2\right] }{2\theta _i}\,. \end{aligned}
The first two terms capture i’s loss stemming from his contribution and expected punishment, where parameter \lambda \in (0,1) measures the utility cost from each unit of punishment i receives. The third and fourth terms capture i’s concern for norm-appropriate behavior by self and other group members.
We assume that types \theta _i and \theta _T are independently distributed according to a uniform distribution on [0, 1], and that this is common knowledge.Footnote4 Uncertainty in the model is solely with respect to the individual types; other parameters are common knowledge.
The fourth party and competition games
The Fourth party game additionally includes another outsider, referred to as the fourth party, F, who shares the same normative concerns as the public good players and T, but is not in a position to punish public good players directly. For example, an international organization usually lacks the means to sanction corporations for questionable tax practices, but may express disapproval if the national government under whose jurisdiction the corporation operates fails to act. F can critique or challenge T’s decisions at no cost to herself.Footnote5 Disapproval adds an amount d to T’s loss, so that Eq. 2 becomes
\begin{aligned} \mathcal {L}_{T} = \kappa \sum _{i\in S} p_i + \sum _{i\in S}\frac{(N^I-c_i-p_i)^2}{2\theta _T} + d \cdot 1_{\mathcal {D}}(\textbf{c}, \textbf{p}) \,, \end{aligned}
where 1_{\mathcal {D}}(\cdot ) is the indicator function, and {\mathcal {D}} represents the “disapproval set”, i.e., the contribution-punishment combinations that F disapproves of.
We assume that d is sufficiently large such that T generally seeks to avoid F’s disapproval. For example, d could represent reputational damage or the withdrawal of foreign investment to the country resulting from being disciplined by a higher-order authority. The possibility of damaging disapproval also differentiates our study from papers that study audience effects (e.g., Kamei, 2017), where another player is informed about the third parties’ actions but cannot interfere.
We assume that F’s loss function is given by
\begin{aligned} \mathcal {L}_F = \sum _{i \in S} \min \left\{ (N^{\texttt {FP}}-c_i-p_i)^2, \delta \cdot 1_{\mathcal {D}}(\textbf{c}, \textbf{p}) \right\} \,, \end{aligned}
i.e., the punishment of norm-violating public good players imposed by T also reduces F’s loss. Note that, although the loss function of Eq. 5 posits that expressing disapproval incurs no material cost for F, it still assumes that F will only react to T’s misactions above a certain threshold, captured by the leniency level \delta \ge 0. For example, international organizations may be cautious about overcriticizing their members, as they risk losing cooperation or even prompting members to withdraw.
Finally, in the Competition game, the third party is chosen by the public good players in an election among two candidates, A and B. The candidates announce their punishment proposals after observing the contributions in the public good game, but before votes are cast. A candidate’s loss function \mathcal {L}_j, j \in \{A, B\}, is given by Eq. 4, where 1_{\mathcal {D}} now is an indicator function for the event that voters did not elect candidate j. Not being elected adds disutility d to the candidate’s loss, e.g., because campaigning unsuccessfully is expensive or because not being elected means not enjoying an attractive salary.
2.2 Equilibrium analysis
We simplify the analysis by assuming that PGG players treat expectation {\textbf{E}}(c) as independent from their own contribution, i.e., an individual contribution does not change the norm N^I.Footnote6 We are now ready to state the equilibrium of the Baseline game in the following proposition. All proofs are provided in the appendix.
Proposition 1
Suppose that \theta has an independent uniform prior on the unit interval. Let \kappa + \lambda < 1. In the Perfect Bayesian Equilibrium of the Baseline game,
- (i)player i’s contribution is
\begin{aligned} c_i^* = {\left\{ \begin{array}{ll} \max \left\{ 0, N^{\texttt {Base}} – \theta _i(1-\lambda ) \right\} & \text { if } \, \theta _i > \bar{\theta } \\ \max \left\{ 0, N^{\texttt {Base}}-\frac{\kappa }{2}\right\} & \text { if } \, \frac{\kappa }{2} < \theta _i \le \bar{\theta } \\ \max \left\{ 0, N^{\texttt {Base}}-\theta _i\right\} & \text { if } \, \theta _i \le \frac{\kappa }{2} \,, \end{array}\right. } \end{aligned}
(6)where \bar{\theta } {\mathop {=}\limits ^{\text {def}}}\frac{\kappa }{2 (1-\lambda )}.
- (ii)The third party’s equilibrium punishment strategy is
\begin{aligned} p_i^* = \max \left( 0, N^{\texttt {Base}} – c_i – \theta _T \kappa \right) \,, \end{aligned}
(7)i.e., all players who contributed less than N^{\texttt {Base}} – \theta _T\kappa receive punishment.
- (iii)The equilibrium norm is
\begin{aligned} N^{\texttt {Base}} = r – \frac{\beta }{1-\beta }\left[ \frac{4(1-\lambda )^2 + \kappa ^2 \lambda }{8(1-\lambda )} \right] \,. \end{aligned}
(8)
The piecewise linear blue graph in Fig. 1a shows how the equilibrium contribution to the public good depends on \theta _i: Contributions fall short of norm N^B for all types and decrease in \theta _i, that is, a public good player contributes less the more importance he attaches to material concerns relative to normative concerns. Moreover, contributions to the public good are greater (lower), the higher \lambda (\kappa).
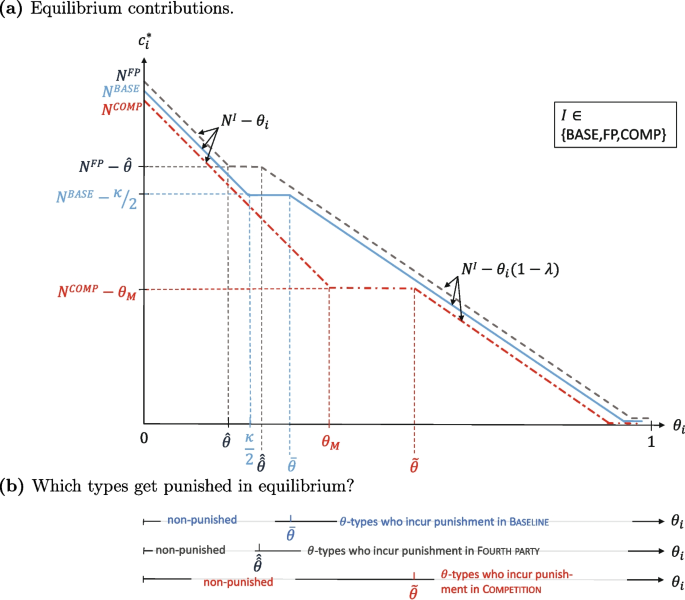
Equilibrium contributions in Panel (a) and expected punishment decisions in Panel (b) for Baseline (blue), Fourth party (grey), and Competition (red). The figure assumes that the distribution of \theta is uniform on [0, 1]. Refer to Eqs. 6, 9, and 14 for the definition of the piecewise linear function that describes equilibrium contributions, as well as the thresholds that determine which types are punished in expectation.
The third party’s optimal punishment policy is to not punish any public good player who contributed at least an amount N^{\texttt {Base}} – \theta _T\kappa. Individuals with small values of \theta _i \le \frac{\kappa }{2} prefer contributions exceeding this amount and receive no punishment, whereas individuals with \theta _i > \bar{\theta } find it optimal to contribute less and incur non-zero punishment. For public good players whose type \theta _i falls in the intermediate range it is optimal to contribute exactly the amount that is in expectation sufficient to avoid punishment. Figure 1b illustrates (in blue) who is and who is not punished in equilibrium.
We next turn to the Fourth party game, observing first that minimizing the loss function of Eq. 5 implies that F will disapprove T’s decisions if \left( N^{\texttt {FP}} – c_i – p_i \right) ^2 > \delta for some i. Compared to the situation without a fourth party, third parties of type \theta _T \ge \sqrt{\delta }/\kappa need to modify their punishment strategy by choosing the amount of punishment that is just sufficient to avoid disapproval. In contrast, third parties who are sufficiently norm-oriented, i.e., \theta _T < \sqrt{\delta }/\kappa, anyway prefer a punishment satisfying the fourth party.
The following Proposition 2 establishes that in equilibrium the punishment, the contributions, and hence the norm N^{\texttt {FP}} are larger than in the situation without a fourth party.
Proposition 2
Suppose that \theta has an independent uniform prior on the unit interval. Let \kappa + \lambda < 1 and \sqrt{\delta } < \kappa /2 (non-lenient fourth party). Then, in the Perfect Bayesian Equilibrium of the Fourth Party game,
- (i)player i’s equilibrium contribution is given by
\begin{aligned} c_i^{**} = {\left\{ \begin{array}{ll} \max \left\{ 0, N^{\texttt {FP}}-\theta _i(1-\lambda ) \right\} & \text { if } \, \theta _i > \hat{\hat{\theta }} \\ \max \left\{ 0, N^{\texttt {FP}}-\sqrt{\delta } \right\} & \text { if } \, \hat{\theta } < \theta _i \le \hat{\hat{\theta }} \\ \max \left\{ 0, N^{\texttt {FP}}-\theta _i \right\} & \text { if } \, \theta _i \le \hat{\theta } \,, \end{array}\right. } \end{aligned}
(9)where \hat{\theta } {\mathop {=}\limits ^{\text {def}}}\sqrt{\delta }-\frac{\delta }{2\kappa } and \hat{\hat{\theta }} {\mathop {=}\limits ^{\text {def}}}\frac{\hat{\theta }}{1-\lambda }.
- (ii)The third party’s equilibrium punishment strategy is
\begin{aligned} p_i^{**} = \max \left\{ 0, N^{\texttt {FP}} – c_i – \sqrt{\delta }, N^{\texttt {FP}} – c_i – \theta _T\kappa \right\} \,. \end{aligned}
(10) - (iii)The fourth party decides as follows,
\begin{aligned} 1_{\mathcal {D}}(\textbf{c}, \textbf{p}) = {\left\{ \begin{array}{ll} 1 & \text { if } (\textbf{c}, \textbf{p}) \in {\mathcal {D}} \\ 0 & \text { if } (\textbf{c}, \textbf{p}) \notin {\mathcal {D}} \,, \end{array}\right. } \end{aligned}
(11)with disapproval set
\begin{aligned} {\mathcal {D}} = \left\{ (c_1, c_2, \dots, c_m, p_1, p_2, \dots, p_m) \in \mathbb {R}^{2m} \|\ \exists \, i \in \{1, \dots, m\} \text { such that } c_i + p_i < N^{\texttt {FP}} – \sqrt{\delta } \right\} \,. \end{aligned}
(12) - (iv)The equilibrium norm is
\begin{aligned} N^{\texttt {FP}} = r – \frac{\beta }{1-\beta }\left[ \frac{4(1-\lambda )^2 + 4 \delta \lambda }{8(1-\lambda )} \right] + \frac{\beta }{1-\lambda }\frac{\lambda }{1-\lambda }\left[ \frac{4\kappa \sqrt{\delta }\delta – \delta ^2}{8\kappa ^2} \right] \,. \end{aligned}
(13)
The grey graph in Fig. 1a illustrates the equilibrium. As shown in Corollary 1 below, we have N^{\texttt {FP}} > N^{\texttt {Base}} for all \beta >0 and \lambda >0, subject to the condition that \sqrt{\delta } < \kappa /2, i.e., the fourth party is not too lenient. Propositions 1(i) and 2(i) lead to our first hypothesis:
Hypothesis 1
(Amount of contributions) Public good players’ contributions are larger on average if a Fourth Party is present compared to Baseline.
The (ii)-parts of Propositions 1 and 2 imply that public good players who would already have incurred punishment without a fourth party’s presence are punished more severely now. Moreover, as shown in Fig. 1b, the share of players who incur punishment is greater in Fourth party compared to Baseline. This leads to our second set of predictions:
Hypothesis 2
(How much punishment?)
- (a)Punishment per unit of norm violation in the Fourth Party treatment exceeds that in the Baseline treatment.
- (b)The number of punished players in Fourth Party is greater than that in the Baseline treatment.
In the Competition game, every public good player has two decisions, first choosing his contribution to the public good, and then deciding in favor of one punishment proposal over the other. Clearly, i casts his vote in favor of the candidate whose punishment proposal (p_1, \dotsc, p_m) leads to a smaller value of i’s loss function of Eq. 3. If there is no difference, then i chooses randomly, with equal probability for electing either candidate.
Since public good players experience a loss from other group members’ norm violations, it is not optimal for a third party candidate to leave norm violations generally unpunished. Rather, electoral concerns cause both candidates to penalize a subset of at most \frac{|S|-1}{2} players who contributed less than the median contributor. This allows a candidate to gain the support of group members who contributed (weakly) more than the median.Footnote7 In equilibrium, the two candidates submit identical punishment proposals and win the election with probability one half. The following proposition summarizes our results:
Proposition 3
Suppose that players have a common prior about the distribution of \theta on [0, 1] and let \theta _{M} denote the median of this distribution. In the Perfect Bayesian Equilibrium of the Competition game,
- (i)public good player i contributes
\begin{aligned} c_i^{***} = {\left\{ \begin{array}{ll} \max \left\{ 0, N^{\texttt {Comp}} – \theta _i(1-\lambda ) \right\} & \text { if } \, \theta _i > \tilde{\theta } \\ \max \left\{ 0, N^{\texttt {Comp}} – \theta _M \right\} & \text { if } \, \theta _M < \theta _i \le \tilde{\theta } \\ \max \left\{ 0, N^{\texttt {Comp}} – \theta _i \right\} & \text { if } \, \theta _i \le \theta _M \,, \end{array}\right. } \end{aligned}
(14)where \tilde{\theta } {\mathop {=}\limits ^{\text {def}}}\frac{\theta _M}{1 – \lambda };
- (ii)both third party candidates propose identical punishments
\begin{aligned} p_i^{***} = {\left\{ \begin{array}{ll} \max \left\{ 0, N^{\texttt {Comp}} – c_i \right\} & \text { if } \, c_i < \text {med}(\textbf{c}) \\ 0 & \text { if } \, c_i \ge \text {med}(\textbf{c}) \,, \end{array}\right. } \end{aligned}
(15)where \text {med}(\textbf{c}) is the realized median contribution in the PGG.
- (iii)Suppose that \theta has an independent uniform prior on the unit interval. Then, the equilibrium norm is
\begin{aligned} N^{\texttt {Comp}} = r – \frac{\beta }{1-\beta }\left[ \frac{(1-\lambda )^2 + \theta _M^2\lambda }{2(1-\lambda )} \right] \,. \end{aligned}
(16) - (iv)Moreover, if
\begin{aligned} \lambda > \sum _{j \ne i} \frac{N^{\texttt {Comp}}-c_j-p_j}{\theta _i} \,, \end{aligned}
(17)then public good player i prefers the candidate who punishes him less in case that the candidates’ proposals are not identical (off the equilibrium path).
Proposition 3(i) implies that the effect of two-candidate competition on contributions is a priori ambiguous. Whether public good players contribute more or less compared to Baseline and Fourth party, and whether the norm is more or less demanding than in these two, depends on the distribution of types, in particular on the location of \theta _M. The red graph in Fig. 1a depicts a situation where contributions will be lower in Competition than in the other two settings, as is for example the case if types are drawn from a uniform distribution on [0, 1]. In this case, we obtain the following result by directly comparing the equilibrium norms of Eqs. 8, 13 and 16:
Corollary 1
Suppose that players’ types are distributed uniformly on [0, 1], \kappa + \lambda < 1, and \sqrt{\delta } < \kappa /2. Then,
\begin{aligned} N^{\texttt {Comp}}< N^{\texttt {Base}} < N^{\texttt {FP}} \,. \end{aligned}
But for a type distribution with, say, \theta _M < \bar{\theta }, equilibrium contributions in Competition would be greater than in the Baseline setting.
Proposition 3(ii) shows that it also depends on the median type \theta _M how many public good players get punished in equilibrium. Figure 1b illustrates, in line with panel (a), a situation where the median public good player is relatively uninterested in norm-following behavior. We formulate our expectations based on Proposition 3, (ii) and (iv), as
Hypothesis 3
(Punishment in Competition)
- (a)In the Competition treatment, both candidates propose to punish a subset of at most size \frac{|S|-1}{2} which includes the lowest contributors. In our experiment, |S| = 3 and thus \frac{|S|-1}{2} =1.
- (b)If a candidate in the Competition treatment proposes to punish more than \frac{|S|-1}{2} public good players, his proposal does not win against a competitor who allocates punishment to at most \frac{|S|-1}{2} public good players.
Note that our model does not allow us to make a general prediction of how punishment per unit of norm violation in Competition compares to Baseline and Fourth party: This comparison depends on whether N^{\texttt {Comp}} – c_i is greater or smaller than N^{\texttt {Base}} – c_i – \theta _T\kappa and N^{\texttt {FP}} – c_i – \delta.
Finally, the condition of Eq. 17 in Proposition 3(iv) is more likely to be satisfied, the greater \theta _i– and thus the lower i’s contributions. We thus arrive at the following two additional predictions:
Hypothesis 4
(Elections)
- (a)A public good player does not vote for a candidate who proposes to punish him.
- (b)A public good player is more likely to vote for the candidate who proposes more (less) punishment the greater (lower) his own contribution.
3 Experimental design
3.1 The public good game
Our experimental design builds on a standard linear public goods game with three players which is repeated for 20 periods. At the beginning of the first period, all participants are randomly assigned to one of two roles, which stay fixed for the entire 20 periods– public good player (“A-player”) or third party (“B-player”).Footnote8 In each period, three A-players are randomly matched with one B-player using a stranger matching protocol. Hence, group membership is randomly changed in each round. This design choice helps to avoid repeated-game effects.Footnote9 Additionally, we believe it reflects real-world scenarios, where third parties– such as national governments and tax agencies – as well as the set of public good players, often change over time.
At the beginning of every period, A-players receive an endowment of 20 points each. They then decide simultaneously to contribute c_i \in \left\{ 0, 4, 8, 12, 16, 20\right\} to a public good with a marginal per capita return \alpha = 0.5, which is implemented in their group. After the PGG players have made their decisions, the third party is informed about the contributions \mathrm c_1, \mathrm c_2 and \mathrm c_3 in her group and can punish A-player i by assigning punishment points p_i to i. One punishment point costs the B-player one point out of his endowment of 30 points, but reduces i’s payoff by two points. The monetary payoff \pi _{\mathrm A_i} for A-player i is given byFootnote10
\begin{aligned} \pi _{A_i} =20-c_i+0.5\sum _{j=1}^{3}c_j-2p_i \,. \end{aligned}
The monetary payoff for a B-player in a Baseline period equals her endowment of 30 points minus the total punishment points she assigned, i.e.,
\begin{aligned} \pi _{\mathrm B}^{Base}=30-\sum _{i=1}^{3}p_i. \end{aligned}
At the end of each period, each PGG player receives information about (i) her own contribution, (ii) the total contribution in her group (from which she can infer the total contribution of her two group members), (iii) the punishment points she received from the third party and (iv) her own payoff in the period.Footnote11 Third parties also receive information about their own payoff in the current period. The final payoff for each A- and B-player is calculated as the sum of her payoffs over the 20 periods.
In the Fourth Party treatment, we introduced a ‘C-player’ to each group, resulting in a composition of three A-players, one B-player, and one C-player. Roles remained fixed over 20 periods, with groups being randomly rematched in each round. In addition to the two previously described stages, a third stage was added in each period. In this stage, the C-player received information about contributions and the assigned punishments. The C-player then indicated whether they found B’s decisions ‘appropriate’ or ‘not appropriate.’ C-players received a fixed payoff of 15 euros, regardless of their decisions in the 20 periods.Footnote12 The payoffs for A-players are still calculated according to Eq. 18. Importantly, the B’s punishment decision is enforced in any case, even when a C-player has characterized the B’s decision as ‘not appropriate’.Footnote13 The B-player’s payoff, however, now depends on C’s decision:
\begin{aligned} \pi _{\mathrm B}^{Fourth}={\left\{ \begin{array}{ll} 30-\sum _{i=1}^{3}p_i & \text {if C agrees}\\ 5 & \text {if C disapproves} \,. \end{array}\right. } \end{aligned}
The third treatment, Competition, has groups consisting of three A-players as before and two B-player candidates (\mathrm B_1 and \mathrm B_2). Both candidates observe A-players’ contributions in their group and suggest punishments (p_1^{B1}, p_3^{B1}, p_3^{B1}) and (p_1^{B2}, p_3^{B2}, p_3^{B2}) to A-players. Each A-player in Competition is informed about these punishment proposals on an additional screen (see Fig. C4, Online Appendix 3) that appears after the punishment decisions of \mathrm B_1 and \mathrm B_2 and before the feedback screen (which is identical to the one used in Baseline; see Fig. C5, Online Appendix 3). On the additional screen, each A-player receives information about the individual contributions of herself and her group members and the proposed punishment points assigned to her and the two group members by the third parties. A-players then indicate their preferred proposal by vote. The proposal which receives the majority of votes is implemented. The payoff for an A-player in each period is calculated by Eq. 18, using the winning punishment proposal. A B-player’s payoff in a period now depends on the decision of the three A-players in her group: The selected B-player’s payoff is calculated as in Eq. 19; the non-selected B-player receives a payoff of 5 points, i.e.,
\begin{aligned} \pi _{\mathrm B}^{Comp}={\left\{ \begin{array}{ll} 30-\sum _{i=1}^{3}p_i & \text {if B’s proposal received two or three votes} \\ 5 & \text {if B’s proposal received zero or one vote} \,.\end{array}\right. } \end{aligned}
3.2 Procedures
The experiment was programmed using z-Tree (Fischbacher, 2007). The participants were recruited via the administration software hroot (Bock et al., 2014).
Participants might differ with respect to their inequality aversion and efficiency preferences, and this might influence their punishment and contribution decisions. We therefore conducted the equality equivalence test due to Kerschbamer (2015) to elicit these preferences at the beginning of the experiment and use the measures thus gained as control variables in our analysis. In order to save space, we omit the details and refer to the original description of the double price-list technique in that paper.Footnote14
Subjects first completed the Kerschbamer-test (part 1) and then participated in one of the treatments (Baseline, Fourth Party or Competition) as part 2.Footnote15 As final payoff, each participant received the sum of her individual payoffs from parts 1 and 2 at a conversion rate of 100 points = 3 euros. The subjects answered some control questions after reading the instructions and completed a questionnaire upon conclusion of the experiment.
The experiment was conducted at the University of Hamburg and involved eight sessions with a total of 228 participants; 48 subjects participated in Baseline (two sessions, 24 subjects per session), 90 subjects participated in Fourth Party and 90 subjects participated in Competition (both three sessions, 30 subjects per session). The participants were undergraduate and graduate students enrolled in Bachelor’s and Master’s degree programs of the University of Hamburg. The students came from various disciplines, with the largest group of participants (47.37%) studying economics or social sciences. 133 participants (58.33%) indicated their gender as female and 95 (41.67%) as male. Upon arrival at the laboratory, the participants were randomly placed at the computers. For each of the two parts of the experiment they received written instructions, which were read aloud by the experimenter. Sessions lasted for 75-90 minutes. The highest payoff was €20.52, the lowest payoff €6.93 and the average payoff €15.52. All decisions and payoffs were made in private.
4 Results
We begin with an overview of our main findings before providing a detailed analysis of punishment behavior, contributions, and earnings.
4.1 Overview
To first get an idea of contribution behavior, Fig. 2 shows the average contributions to the public good by treatment and pooled over all periods (left panel) and by treatment and period (right panel). A first result is that Fourth Party generated higher contribution rates than Baseline (mean 11.57 and 6.59 points, respectively), as predicted in Hypothesis 1. Additionally, we see that Competition had greater contributions (mean 9.54 points) than Baseline as well. There is a slight, negative contribution trend over time for the Baseline and Competition treatments, that is not observed for Fourth Party. The data replicate the stylized fact from previous PGG experiments that participants initially contribute on average between 40 % and 60 % of their endowment (see Chaudhuri, 2011).
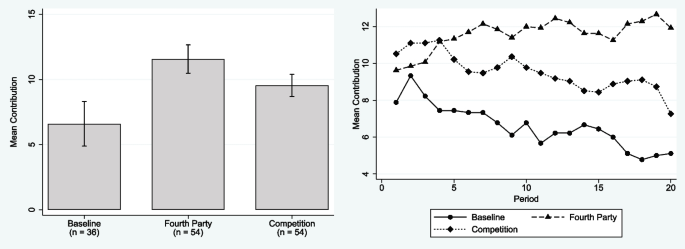
Mean contribution by treatment and over time. Notes: Error bars represent 95% confidence intervals for the mean (pooled over all periods for each public good player)
In the second stage of each treatment, third parties could punish PGG players. Figure 3 shows the average punishment points assigned per public good player by treatment and pooled over all periods (left panel) and by treatment and period (right panel). In Competition, there were two third parties in each group. In the left panel of Fig. 3, we first incorporate both punishment proposals to calculate the mean for all punishment observations (third bar from the left). The mean punishment was higher in Fourth Party (mean punishment: 1.70 points) than in Competition (mean punishment for all observations: 1.01 points) and Baseline (mean punishment: 1.00 points). The left panel of Fig. 3 also shows the mean punishment proposals separately for “rejected” and “accepted” third party candidates in the Competition treatment, i.e., whose proposals respectively received the minority and majority of public good players’ votes. We find that on average, rejected third parties (mean punishment: 1.13 points) punished more harshly than accepted third parties (mean punishment: 0.89 points).
We also find that in 2563 of a total of 3960 individual punishment decisions by third parties per public good player over all periods (64.7%), third party players chose not to punish at all. In contrast to many public good experiments with second-party punishment that show decreasing levels of punishment over time, there is no clear punishment trend in any of our treatments (see Fig. 3, right panel).
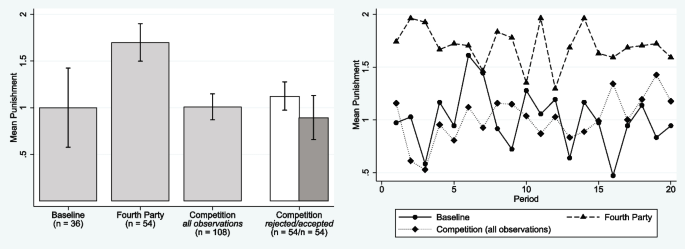
Mean punishment per public good player by treatment and over time. Notes: Error bars represent 95% confidence intervals for the mean (pooled over all periods for each third party)
We now turn to third party punishment at the group level. Considering all treatments combined, the majority of third parties tended to punish either none or only one of the public good players. When only one player was punished, the punishment was almost always applied to the player who contributed the least to the public good– this was true in 97.62% of cases where only one player was punished. We see similar results when two players were punished. In this case, the two players who contributed the least to the public good were punished in 98.58% of the cases.
Figure 4 shows how many of the three public good players in a group were punished (in percent, by treatment and pooled over all 20 periods). In Baseline, 51.67% of the time none of the A-players in a group were punished. The picture is very different in Fourth Party, where punishment was not only harsher (cf. Fig. 3), but also frequently directed against multiple public good players: Only in 11.94% of cases was no player punished. Punishment of one or two players was much more frequent, with 30.28% and 48.33% of cases, respectively. With respect to the Competition treatment, Fig. 4 again shows punishment profiles for “rejected” and “accepted” third party candidates.Footnote16 We find that third parties were most successful when they did not punish any or one public good actor.
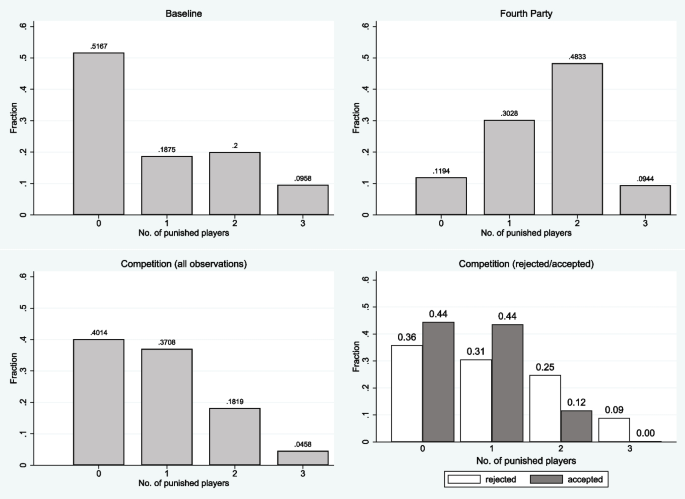
Number of punished players by treatment (fractions)
Lastly, Fig. 5 shows how PGG players’ contributions influenced the punishment decisions of the third parties. The plot shows the mean punishment as a function of the deviation (d) of a public good player’s contribution from the average contribution in his group.Footnote17 We categorize the deviation by intensity level and by treatment. The bars in the two lowest d-categories indicate that a few public good players were punished even though they contributed exactly at the group average (d=0) or more than group average (d>0). However, mean punishment in these cases was generally low in all three treatments. Punishment increased when the contribution was negatively different from the group average. We also observed a stronger effect for larger deviations. The three groups of bars on the right side of Fig. 5 indicate that third parties punished negative deviations the most in the Fourth Party treatment.
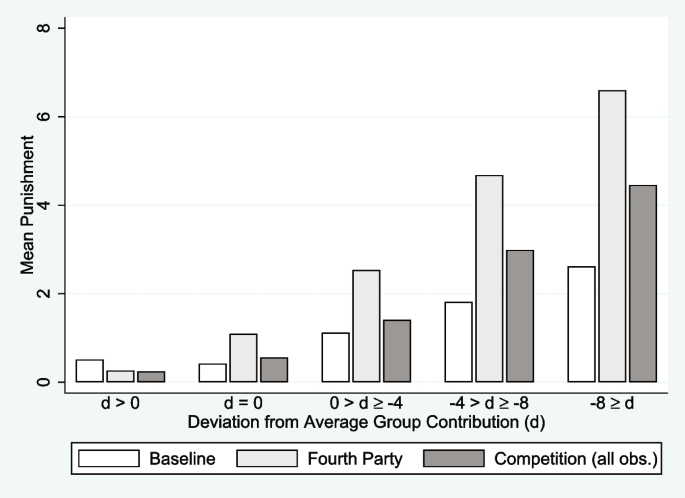
Deviation from average group contribution and individual punishment. Notes: d = individual deviation from the average contribution in the group; Observations from left to right: 288, 503, 944 (for d>0), 76, 132, 270 (for d=0), 188, 280, 668 (for 0>d\ge -4), 134, 125, 256 (for -4>d\ge -8), 34, 40, 22 (for -8\ge d); We do not report error bars since third parties make repeated decisions over 20 periods
4.2 Third party behavior
Our main interest is in analyzing the impact of different third-party incentives. We run multiple regressions to identify the key factors that determine the size of the assigned penalty. Since we have 2563 observations of third parties who did not assign a penalty, we first analyze the probability that the penalty is nonzero: columns (1) and (2) in Table 1 show random effects probit regressions where the dependent variable takes the value of 1 if the B-player punished an A-player and 0 otherwise. We then analyze the severity of the penalty: columns (3) and (4) in Table 1 show random effects tobit regressions where the dependent variable is the level of third party punishment. We use Baseline as our benchmark treatment in all regressions. FP and Comp are dummy variables for the treatments Fourth Party and Competition, respectively. In regressions (1) and (2) of Table 1, standard errors are clustered at the subject level of B-players.Footnote18
The results of the first regression in Table 1 and a Wald test between FP and Comp suggest that third parties chose to punish more often in Fourth Party than in Baseline and Competition. In regression (2), we include two interaction terms, FP x deviation and Comp x deviation. Both terms have a significant and negative impact on punishment. Thus, we find that a treatment difference in the assigned punishment occurs only when the contribution of a public good player negatively deviates from the group average, consistent with the results presented in Fig. 5. The interaction terms show that the strongest effect for deviation on the punishment decision was present in the Fourth Party treatment. We conclude that the punishment decision was more responsive to deviation from the average in Fourth Party compared to Baseline, but also compared to Competition.Footnote19
In regression (2), we include the standard deviation of group contributions, the group-average contribution and period indicators as additional controls. We also include gender and social preference controls (inequality aversion and efficiency preferences of third parties). We elicited the latter separately with Kerschbamer’s test in the first part of the experiment. The regression reveals a significant positive impact of more spread-out contributions and a negative impact of a higher group-average contribution on the punishment decision. The other controls (gender and social preference controls) are insignificant.
In regressions (3) and (4), we analyze the chosen level of punishment. The results of regression (3) and a Wald test between FP and Comp indicate that third parties chose to punish more severely in Fourth Party than in Control and Competition.Footnote20 The interaction terms in regression (4) reveal that negative deviations of public good players from average group contribution are punished more severely in Fourth Party and Competition than in Baseline. Generally, we obtain similar results when considering the punishment level or a punishment dummy as dependent variables.Footnote21 We therefore conclude:
Result 1
If the contribution of a public good player negatively deviates from the group average, third parties punish more severely in Fourth Party compared to Baseline, thus confirming Hypothesis 2(a). The punishment level is higher in Fourth Party than in Competition.
We now turn to group-level analysis by analyzing how many public good actors were punished in each treatment.Footnote22 Table 2 presents logit regressions in which the dependent variable is an indicator variable indicating how many public good actors were punished by the third party. In column (1), the indicator variable equals one if the number of punished A-players in the group was zero, and it equals zero if punishment occurred. We again use the baseline treatment as a benchmark. The regression shows a negative and significant effect of the treatment variable FP. A Wald test shows that the difference between FP and Comp is also statistically significant. These results reflect that “no punishment” was more common in Baseline and Competition than in Fourth Party. A high standard deviation in group contributions had a negative and significant effect, while a high group-average contribution had a positive and significant effect. That is, when the level of contributions was highly variable within a group, “no punishment” was rare, whereas no punishment was more common when average group contributions were high.
In column (2), Table 2, the dependent variable is an indicator equal to one if exactly one player was punished and zero otherwise. We find that a single player was punished more often in Competition than in Baseline.Footnote23 A Wald test shows that the difference between FP and Comp is statistically significant at the 10%-level, indicating that a single player was punished more often in Competition than in the other treatments, which is a key finding of our experiment.
In the third regression, the dependent variable is an indicator of “>one penalized player”. A Wald test between FP and Comp confirms that two or three players were significantly more likely to be penalized in Fourth Party than in Baseline and Competition. Overall, these findings support the following result:
Result 2
In Fourth Party, the number of penalized public good players is larger than in Baseline, confirming Hypothesis 2(b). Punishment in Competition is more often targeted at one player than in the other treatments.
Next, we take a closer look at the Fourth Party and Competition treatments to see if these key results are confirmed by further analysis. In Fourth Party, there were 360 instances where a fourth party player had to evaluate the third party’s punishment decision. As expected in theory, the evaluation was often positive: In 81.67% of the cases, the fourth party judged the third party’s punishment decision to be appropriate.
Columns (1) and (2) in Table 3 present random effects logit regressions in which the dependent variable is a dummy variable (“F agrees”) indicating a positive evaluation by the fourth party. In column (1), we include ‘Punishment of norm deviators (A)’ as an explanatory variable, which equals one if a third party punished all public good players who contributed less than the average contribution, and zero otherwise. The regression shows that this variable does not have a significant effect on the evaluation of fourth parties. In contrast, a higher average punishment within the group does have a positive and significant effect on approval. In column (2), we instead include ‘Punishment of norm deviators (B)’ as an explanatory variable, which equals one if a third party punished all public good players who contributed less than the average contribution observed thus far by the fourth party, and zero otherwise. Likewise, this variable does not have a significant effect on on the evaluation of fourth parties. Apart from that, the results of regression (2) are also similar to those of regression (1). The results of regressions (1) and (2) suggest that it is more important to give a larger total amount of punishment, rather than to just punish those who contribute less than the group average observed in the current period or observed thus far by the fourth party.Footnote24
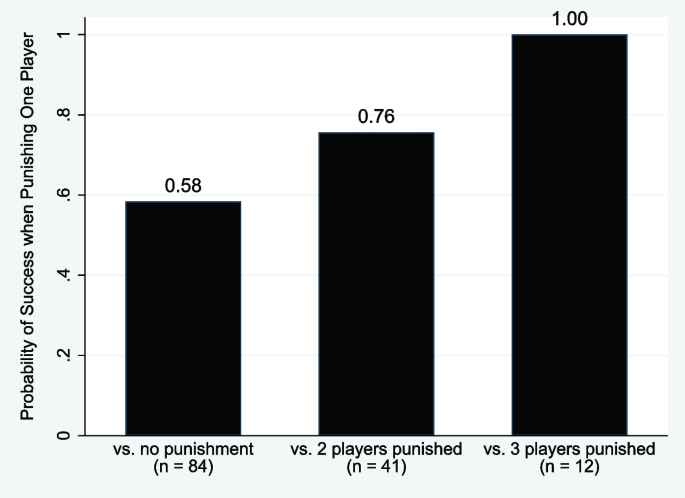
Probability of success when punishing one player in Competition (“matchups”). Notes: The figure illustrates the cases in the Competition treatment in which a third party proposed to punish one public good actor (and not to punish the other two) when competing with another third party that proposed (i) to punish none of the three public good actors, (ii) to punish two of the three public good actors, or (iii) to punish all three public good actors. The bars show the probabilities of success of such a third party in the elections (i.e. the relative frequency with which a third party that punished only one player received the majority of votes), separately for case (i) (left bar), case (ii) (middle bar) and case (iii) (right bar). Note that cases where both third parties proposed to punish exactly one public good actor are not displayed
Column (3) in Table 3 shows a regression that has the electoral success of third parties in Competition as the dependent variable. As explanatory variable, we include ‘Punishment of norm deviators (A)’.Footnote25 The variable has no significant effect on electoral success in Competition. However, the dummy variable for punishing one public good player has a significant positive effect on electoral success.Footnote26 Moreover, higher average punishment within a group led to significantly lower electoral success. Further illustration is provided by Fig. 6, which shows the probability of electoral success when a public good actor is punished compared to other punishment proposals. Consistent with Hypothesis 3(b), third parties are most likely to win a majority of votes when they punish one of the three public good actors, particularly when their competitor proposes punishing two or three actors.Footnote27 We conclude:
Result 3
Strategic punishment of only the largest deviator from the average group contribution is key to third party candidate success in Competition, confirming Hypothesis 3(a), whereas a high average punishment is harmful. In Fourth Party, a high average punishment led to greater approval by fourth parties, in line with the equilibrium stated in Proposition 2(ii).
In Competition, the public good players chose between the punishment proposals of two candidates. As expected, they almost always (in 98.61% of cases) voted for the candidate who proposed less punishment for them, confirming Hypothesis 4(a). To test Hypothesis 4(b), we run random-effects logit regressions (see Table 4) in which the dependent variable is a dummy variable indicating whether a public good actor voted for the candidate who proposed a higher total penalty (yes = 1/no = 0). As explanatory variables, we include the own contribution, the average contribution of the other group members and period. The regression shows that a public good player is more likely to vote for the candidate who proposes more punishment the greater his own contribution was, confirming Hypothesis 4(b).Footnote28
4.3 Contributions and earnings
We now turn to the contribution decisions of the public good players. It was already clear from Fig. 2 that the level of contributions depended on the treatment. For a more detailed analysis, we ran two random effects tobit regressions for total contributions, which we report in columns (1) and (2) in Table 5. The regressions confirm that contributions were significantly higher in Fourth Party and Competition than in the benchmark Baseline treatment. A Wald test shows that the difference between FP and Comp is statistically significant in regression (1) but not in regression (2) (see last row of Table 5). In addition, regressions (1) and (2) show that contributions went somewhat down in later periods while regression (2) reveals that a higher average contribution of the other group members in the previous period had a significant positive effect on contributions. Basing the contribution decision partly on the behavior of others in the past appears similar to conditional cooperation. However, that term is traditionally used in experiments that use partner matching.
Finally, we analyze earnings of public good players: Which system is most profitable from their point of view?Footnote29 Figure 7 shows the average earnings of public good players in the public good game by treatment and pooled over all periods (left panel) and by treatment and period (right panel), revealing them to be highest in Competition, followed by Fourth Party and Baseline. The earnings in Competition are particularly high in the beginning of the experiment (periods 1–5). Columns (3) and (4) of Table 5 show the results of random effects regressions in which the period-specific profits of the public good actors are the dependent variable. We again use Baseline as the benchmark. In (3) all periods are considered, while in (4) only periods 6 to 20 are considered to check whether the results are the same if we exclude the periods with very high profits in Competition. The results of both regressions and Wald tests between FP and Comp show that the returns in Competition were significantly higher than in Baseline and Fourth Party.Footnote30
Result 4
Contributions were higher in Fourth Party than in Baseline, in line with Hypothesis 1. Moreover, the Competition treatment generated higher earnings for public good players than Baseline.
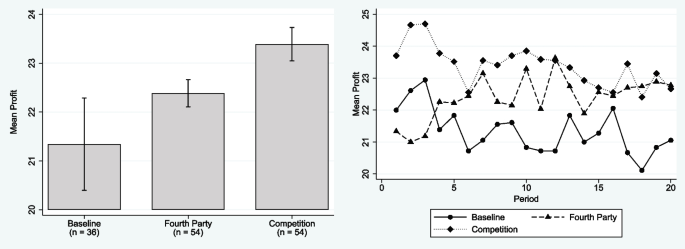
Mean earnings of public good players by treatment and over time. Notes: Error bars represent 95% confidence intervals for the mean (pooled over all periods for each public good player)
5 Concluding remarks
Our study has revealed significant variations in how third parties execute their role, contingent upon the presence and nature of additional incentive structures. Within our laboratory experiment, the introduction of an independent fourth party emerged as the most effective strategy for curbing norm violations among participants in a public goods game. Nevertheless, this effectiveness was accompanied by a notable increase in the use of third party punishment. Conversely, the introduction of electoral competition, where two candidates vied for the role of norm enforcer, resulted in strategically targeted sanctions against the player contributing the least. This approach not only mitigated norm violations but also produced the most gains for public good players.
Applying findings from a theoretical model or a high-internal-validity laboratory study to real-world contexts requires careful consideration. In practice, the institutions studied– fourth-party monitoring and electoral competition– coexist, and their effectiveness depends on factors such as the fourth party’s willingness and capacity to enforce sanctions. In our experiment, the mere possibility of fourth-party intervention significantly influenced third-party behavior; often, the threat of sanctions alone was enough to ensure compliance. However, applying these insights to real world domains such as, e.g., global tax policy, presents several challenges. Notably, in our experimental setup, we followed standard practice by representing both fourth-party sanctions and the consequences of losing the electoral competition as purely monetary losses, which were also substantial for third parties. In real-world settings, however, the impact of such punishments causes a utility loss that often extends beyond financial penalties, involving reputational damages and career concerns. Second, the influence of organizations like the OECD, the World Bank, or civil society groups on national governments significantly depends on the media coverage and public attention their criticisms receive, a point also made by, e.g., Kelley and Simmons (2015). The extent of damage these organizations can inflict– the d in our model – is, therefore, crucially dependent on their ability to shape public and media narratives to pressure governments.
Moreover, the role of fourth-party entities in global governance is complicated further by the dependencies that international organizations have on the funding and cooperation of their member states. Despite assertions by scholars such as Barnett and Finnemore (1999, 2004) who suggest that international organizations possess significant autonomy, the balance between enforcing norms and maintaining member support is delicate (see also Haftel and Thompson, 2006). Excessive criticism or stringent enforcement risks alienating member states, potentially leading to reduced involvement or even withdrawal; a concern which, in our model, corresponds to a large leniency threshold \delta for the fourth party, F. This challenge is less pronounced for civil society groups and activist watchdogs, who generally maintain greater autonomy and incur fewer repercussions from critiquing national governments, leading them often to demand tighter standards.Footnote31 Their independent positions allow them to apply pressure without the immediate threat of financial or political retribution, pointing to a distinct dynamic in the enforcement of internationally agreed norms, like, for example, global tax policies.
Reflecting on our findings, it is evident that while electoral competition offered significant advantages in fostering compliance and cooperation among public good players in our experiment, its effectiveness in addressing real-world public goods problems is contingent on the governance scope aligning with the challenges at hand. This highlights that governance strategies need to be tailored specifically to the nature of the public goods they aim to manage (see Sandler, 2006). National issues may be effectively addressed through national electoral mechanisms, but global challenges such as multinational corporate tax dodging require broader, potentially global governance structures.
Our model contributes theoretically by demonstrating that the formation of norms can vary depending on institutional arrangements, rather than being fixed absolutes, highlighting how different setups influence behavior and outcomes. In particular, it cautions that the impact of Competition on outcomes can be notably sensitive to the moral preferences within the group of public good players, especially with regard to the moral standards of the median individual. This sensitivity arises partly because, in our setup, the third-party punisher is selected after public good players have made their contribution decisions.Footnote32 This arrangement may mirror natural electoral processes, where citizens often vote on political candidates and their announced policies after making their ‘contribution’ decisions, such as adopting a specific tax strategy or, to give another example, engaging in environmentally conscious behaviors.
Lastly, the effect of institutional environments on third-party behavior opens up several promising avenues for future research. One key question is to what extent the positive effects of electing a sanctioning authority, as found in our study, would hold when more than two candidates compete. Would increased competition lead to a race to the bottom in terms of imposed punishment? Another avenue of interest, which we have left unexplored, concerns the endogenous selection of incentive environments for third parties. Our findings suggest that this choice could depend not only on preferences for efficiency but also on beliefs about others’ moral standards. This speaks to broader discussions in the literature, such as Abbott and Snidal (2000) work on preferences for “soft” versus “hard” law, particularly when considering that a democratically elected third party may have the capacity to enforce norms more rigorously.
Data availability
The Stata do-file and dataset to reproduce the results are available at: https://osf.io/rykaw/.
Notes
-
These shortcomings reflect the nature of many international agreements as “soft” legal arrangements. Participation in them can represent varying degrees of commitment to the background legal norms, and they often lack the precision, binding obligation, and delegation to authorities (e.g., judges) that are characteristic of “hard” law. See Abbott and Snidal (2000) for more on the role of soft law in international governance.
-
For clarification, in the terminology of the higher-order punishment literature, the ‘third party’ in our setting engages in first-order punishment, i.e., based directly on contribution decisions, while the ’fourth party’ can engage in second-order punishment, i.e., based on observing another agent’s punishment decisions.
-
Since our focus here is on how the institutional setting changes players’ behavior, we abstract from differences in individual values, i.e., we assume that r is identical for all individuals.– For the same reason, we also chose not to elicit participants’ beliefs about social norms in the experiment. While social norms are clearly important for contribution and punishment behavior, subjects’ perceptions about the social norm are not central to our comparative statics exercise. Moreover, the elicitation procedure itself may unduly influence behavior and lead to experimenter demand effects.
-
The assumption of a uniform distribution of types is made for computational ease; the results below generalize to other continuous distributions whose density is positive on the support.
-
In real life, individuals who were expected to act as a third-party punisher are often punished symbolically when failing to live up to expectations. Punishment in the form of gossip, verbal reproach or unfavorable coverage in the media is widely seen as costless to the punisher(s) (see Guala, 2012).
-
This seems realistic in large groups; yet, also in smaller groups, it is not clear to which extent individuals would take this “feedback” channel into account.
-
Under the assumption that the number of public good players,|S|, is odd, exactly one median voter generically exists.
-
We use a neutral framing (“A-player”, “B-player” and “public project”) in the experimental instructions (see Online Appendix 3).
-
For example, repeated-game effects can occur when A-players punish with pedagogical motives to deter future low contributions.
-
A-players cannot receive a negative payoff. If the formula yields a negative amount, the payoff is 0 points.
-
See Fig. C5, Online Appendix 3 for a screenshot of this screen.
-
The payoff for C is designed such that it approximately equals the average final payoff of A- and B-players. The results show that the payoff of C-players in Fourth Party is slightly higher than that of A- and B-players, who earn an average of 13.43 and 12.58 euros, respectively. This is reassuring since otherwise disadvantageous inequality might have driven C-players’ decisions.
-
In many cases, in reality, a fourth party, such as the OECD, will most likely only take action after the third party’s decision has been implemented.
-
The test provides two measures of distributional preferences: (i) a measure of inequality aversion, the willingness-to-pay for advantageous inequality WTP^a\in [-0.667,0.667]; (ii) a measure for efficiency preferences, the willingness-to-pay of disadvantageous inequality, WTP^d\in [-0.667,0.667].
-
To avoid potential spillover effects between parts 1 and 2, participants were only informed of the outcome of the Kerschbamer-test at the end of the experiment, i.e. after all decisions (including in the public good game) had been made.
-
A figure that separates punishment profiles for third parties by assessment of the fourth party in the treatment Fourth Party can be found in Fig. A1, Online Appendix 1.
-
Comparing deviations from the average contribution in the group is both suggested by our formulation Eq. 1 of the norm and widely used in studies of PGGs.
-
For our main results (regressions (1) and (2) of Table 1, as well as the regressions of Table 2 and Table 5) we conduct several additional regressions in which we cluster standard errors at the session level. The results with session clustered standard errors are very similar to those with subject clustered standard errors, both qualitatively and quantitatively (see Online Appendix 2).
-
A Wald test also indicates that the difference between the interaction terms FP x deviation and Comp x deviation is statistically significant (p < 0.05, see second row, last column of Table 1).
-
In contrast to regression (1), the indicator Comp is significant in regression (3).
-
The results of Table 1 are also supported by regressions where we cluster standard errors by session (see Table B1, Online Appendix 2).
-
In addition to our estimates in Table 1, we also ran group-level regressions for the punishment decision and punishment level, which we report in Table A1, Online Appendix 1. In these regressions, we also included lagged variables as additional controls.
-
Note that the variable Comp in Table 2 does not distinguish between successful and unsuccessful third parties.
-
We conducted additional regressions using an alternative benchmark against which norm violations might be measured. We constructed a hypothetical “ideal” punishment profile and assessed the quality of third party punishment by the sum of the (squared) deviation of actual punishment from this “ideal” profile. The choice of the ideal punishment profile is to some extent arbitrary and we therefore relegate the corresponding results to Online Appendix 1 (see Table A2 there).
-
An explanatory variable analogous to ’Punishment of norm deviators (B)’ in Competition could be the average contribution observed thus far by the public good players. However, since these observations may differ among the three public good players, we did not include this variable in a regression.
-
As mentioned earlier, in the case of punishing only one actor, the one who contributed the least to the public good was almost always punished. The results in columns (1)-(3) are virtually identical when replacing ‘one actor punished’ with a dummy that also captures whether that actor was also the lowest contributor to the public good (Table A2, Online Appendix 1).
-
This resembles findings by Andreoni and Gee (2012) and Kamijo et al. (2014), who noted that automatic punishment of the least contributor is a popular and effective method to sustain cooperation. However, our model (Hypothesis 3(b)) does not predict punishment of only the lowest contributor but rather punishment of public good players contributing below the median level. The similarity to Andreoni and Gee arises due to the n=3 case.– Additionally, third parties that abstained from punishing any actors also fared well against competitors who opted for broader sanctions. Matchups where both third parties abstained from punishment occurred in 73 instances, and both deciding to punish one actor occurred 65 times.
-
In addition, average contribution of the other group members has a significant negative effect. In other words, the higher the average contribution of the other two group members, the less a public good player voted for the candidate who proposed more sanctions.
-
Note that we do not compute group efficiency, i.e. the total group payoffs in the public good game, as this measure would not be comparable between treatments.
-
When clustering standard errors by session (see Table B3, Online Appendix 2), the results support our findings that earnings were significantly higher in Competition than in Baseline. However, the difference between FP and Comp turns out not to be significant.
-
Abbott and Snidal (2010) discuss how collaboration with non-state actors can benefit international organizations, improving their organizational performance.
-
It is worth mentioning that our results nevertheless align with studies in which the choice of the punishment institution precedes the public goods situation, demonstrating that voting on institutions allows for more efficient punishment schemes (Ertan et al., 2009; Putterman et al., 2011; Markussen et al., 2014) and reduced punishment compared to an appointed authority (Marcin et al., 2019).
References
-
Abbott, K. W., & Snidal, D. (2000). Hard and soft law in international governance. International Organization,54(3), 421–456.
-
Abbott, K. W., & Snidal, D. (2010). International regulation without international government: Improving IO performance through orchestration. Review of International Organizations,5, 315–344.
-
Andreoni, J., & Gee, L. K. (2012). Gun for hire: delegated enforcement and peer punishment in public goods provision. Journal of Public Economics,96, 1036–1046.
-
Bandyopadhyay, S., & McCannon, B. (2014). The effect of the election of prosecutors on criminal trials. Public Choice,161, 141–156.
-
Barnett, M., & Finnemore, M. (1999). The Politics, Power, and Pathologies of International Organizations. International Organization,53(4), 699–732.
-
Barnett, M., & Finnemore, M. (2004). Rules for the World: International Organizations in Global Politics. Ithaca: Cornell University Press.
-
Besley, T., & Coate, S. (2003). Elected versus appointed regulators: Theory and evidence. Journal of the European Economic Association,1(5), 1176–1206.
-
Blaufus, K., Bob, J., Otto, P. E., & Wolf, N. (2016). The effect of tax privacy on tax compliance – An experimental investigation. European Accounting Review,64, 1–20.
-
Bock, O., Baetge, I., & Nicklisch, A. (2014). hroot: Hamburg registration and organization online tool. European Economic Review,71, 117–120.
-
Chaudhuri, A. (2011). Sustaining cooperation in laboratory public goods experiments: a selective survey of the literature. Experimental Economics,14, 47–83.
-
Cinyabuguma, M., Page, T., & Putterman, L. (2006). Can second-order punishment deter perverse punishment? Experimental Economics,9(3), 265–279.
-
Coricelli, G., Joffily, M., Montmarquette, C., & Villeval, M. (2010). Cheating, Emotions, and Rationality: An Experiment on Tax Evasion. Experimental Economics,13, 226–247.
-
Cubitt, R., Drouvelis, M., Gächter, S., & Kabalin, R. (2011). Moral judgments in social dilemmas: How bad is free riding? Journal of Public Economics,95(3–4), 253–264.
-
d’Adda, G., Dufwenberg, M., Passarelli, F., & Tabellini, G. (2020). Social norms with private values: Theory and experiments. Games and Economic Behavior,124, 288–304.
-
Ertan, A., Page, T., & Putterman, L. (2009). Who to punish? Individual decisions and majority rule in mitigating the free rider problem. European Economic Review,53(5), 495–511.
-
Fehr, E., & Williams, T. (2018). Social norms, endogenous sorting and the culture of cooperation. CESifo Working Papers 7003.
-
Fehr, E., & Fischbacher, U. (2004). Third-party punishment and social norms. Evolution and Human Behavior,25(2), 63–87.
-
Fehr, E., & Schmidt, K. M. (1999). A Theory of fairness, competition and cooperation. Quarterly Journal of Economics,114(3), 817–868.
-
Filiz-Ozbay, E., & Ozbay, E. (2014). Effect of an audience in public goods provision. Experimental Economics,17, 200–214.
-
Fischbacher, U. (2007). z-Tree. Zurich toolbox for ready-made economic experiments. Experimental Economics,10(2), 171–178.
-
Fortin, B., Lacroix, G., & Villeval, M. (2007). Tax evasion and social interactions. Journal of Public Economics,91, 2089–2112.
-
Fu, T., Ji, Y., Kamei, K., & Putterman, L. (2017). Punishment can support cooperation even when punishable. Economics Letters,154, 84–87.
-
Gächter, S., Gerhards, L., & Nosenzo, D. (2017). The importance of peers for compliance with norms of fair sharing. European Economic Review,97, 72–86.
-
Gross, J., Z. Méder, S. Okamoto-Barth, S., & Riedl, A. (2016). Building the Leviathan – voluntary centralisation of punishment power sustains cooperation in humans. Scientific Reports 6(20767).
-
Guala, F. (2012). Reciprocity: Weak or strong? What punishment experiments do (and do not) demonstrate. Behavioral and Brain Sciences,35, 1–59.
-
Haftel, Y. Z., & Thompson, A. (2006). The independence of international organizations: concept and applications. Journal of Conflict Resolution,50(2), 253–275.
-
Hainmueller, J., & Hangartner, D. (2019). Does direct democracy hurt immigrant minorities? Evidence from naturalization decisions in Switzerland. American Journal of Political Science,63(3), 530–547.
-
Huber, G., & Gordon, S. (2004). Accountability and coercion: Is justice blind when it runs for office? American Journal of Political Science,48(2), 247–263.
-
Jensen, N. M., & Malesky, E. J. (2018). Nonstate actors and compliance with international agreements: An empirical analysis of the OECD anti-bribery convention. International Organization,72(1), 33–69.
-
Jordan, J., McAuliffe, K., & Rand, D. (2016). The effects of endowment size and strategy method on third party punishment. Experimental Economics,19, 741–763.
-
Kamei, K. (2017). Altruistic norm enforcement and decision-making format in a dilemma: Experimental evidence. MPRA Paper 76641, University Library of Munich, Germany.
-
Kamei, K. (2020). Group size effect and over-punishment in the case of third party enforcement of social norms. Journal of Economic Behavior & Organization 175(C), 395–412.
-
Kamei, K., Sharma, S., & Walker, M.J. (2023). Sanction Enforcement among Third Parties: New Experimental Evidence from Two Societies. SSRN Working Paper 4429802.
-
Kamei, K. (2021). Teams do inflict costly third-party punishment as individuals do: Experimental evidence. Games,12(1), 22.
-
Kamijo, Y., Nihonsugi, T., Takeuchi, A., & Funaki, Y. (2014). Sustaining cooperation in social dilemmas: Comparison of centralized punishment institutions. Games and Economic Behavior,84, 180–195.
-
Kelley, J. G. (2017). Scorecard Diplomacy: Grading States to Influence Their Reputation and Behavior. New York: Cambridge University Press.
-
Kelley, J. G., & Simmons, B. A. (2015). Politics by number: Indicators as social pressure in international relations. American Journal of Political Science,59(1), 55–70.
-
Kelley, J. G., & Simmons, B. A. (2021). Governance by other means: Rankings as regulatory systems. International Theory,13(1), 169–178.
-
Kerschbamer, R. (2015). The geometry of distributional preferences and a non-parametric identification approach: The equality equivalence test. European Economic Review,76, 85–103.
-
Krupka, E., & Weber, R. (2013). Identifying social norms using coordination games: Why does dictator game sharing vary? Journal of the European Economic Association,11, 495–524.
-
Kurzban, R., DeScioli, P., & O’Brien, E. (2007). Audience effects on moralistic punishment. Evolution and Human Behavior,28(2), 75–84.
-
Lim, C. (2013). Preferences and incentives of appointed and elected public officials: Evidence from state trial court judges. American Economic Review,103(4), 1360–1397.
-
Marcin, I., Robalo, P., & Tausch, F. (2019). Institutional endogeneity and third-party punishment in social dilemmas. Journal of Economic Behavior & Organization,161(C), 243–264.
-
Markussen, T., Putterman, L., & Tyran, J.-R. (2014). Self-organization for collective action: an experimental study of voting on sanction regimes. The Review of Economic Studies,81(1), 301–324.
-
Martin, J., Jordan, J., Rand, D., & Cushman, F. (2019). When do we punish people who don’t? Cognition,193, 104040.
-
Mathew, S., & Boyd, R. (2011). Punishment sustains large-scale cooperation in prestate warfare. Proceedings of National Academy of Sciences,108(28), 11375–11380.
-
Nicklisch, A., Grechenig, K., & Thöni, C. (2016). Information-sensitive Leviathans. Journal of Public Economics,144, 1–13.
-
Partridge, M., & Sass, T. (2011). The productivity of elected and appointed officials: the case of school superintendents. Public Choice,149, 133–149.
-
Putterman, L., Tyran, J.-R., & Kamei, K. (2011). Public goods and voting on formal sanction schemes. Journal of Public Economics,95(9–10), 1213–1222.
-
Sandler, T. (2006). Regional public goods and international organizations. Review of International Organisations,1, 5–25.
-
Tax Justice Network (2023). Why the world needs UN leadership on global tax policy. https://taxjustice.net/wp-content/uploads/2023/08/Why-the-world-needs-UN-leadership-Briefing-Tax-Justice-Network.pdf/
-
Tax Justice Network. (2021). The State of Tax Justice. https://taxjustice.net/wp-content/uploads/2021/11/State_of_Tax_Justice_Report_2021_ENGLISH.pdf
-
The Irish Times. (2014). ‘Double Irish’ tax arrangements to be targeted by OECD plans: Project aims to eliminate ‘zero tax’ havens with measures set to ‘favour’ low tax areas. https://www.irishtimes.com/business/economy/double-irish-tax-arrangements-to-be-targeted-by-oecd-plans-1.1748019
-
The Irish Times. (2014). Abolition of ‘double Irish’ in Budget follows intense pressure on Ireland. https://www.irishtimes.com/business/economy/abolition-of-double-irish-in-budget-follows-intense-pressure-on-ireland-1.1963192
-
Traxler, C., & Winter, J. (2012). Survey evidence on conditional norm enforcement. European Journal of Political Economy,28(3), 390–398.
-
Whalley, A. (2013). Elected versus Appointed Policy Makers: Evidence from City Treasurers. The Journal of Law & Economics,56(1), 39–81.
-
Xiao, E., & Houser, D. (2005). Emotion expression in human punishment behavior. Proceedings of National Academy of Sciences,102(20), 7398–7401.
Funding
Open access funding provided by Aarhus Universitet.
This study was funded by the University of Bremen’s Central Research Development Fund. No grant number available.
Ethics declarations
Ethical approval
not applicable.
Competing interests
The authors have no competing interests to declare that are relevant to the content of this article.
Additional information
Responsible editor: Axel Dreher
Supplementary Information
Below is the link to the electronic supplementary material.
Supplementary file 1 (pdf 1406 KB)
Appendix proofs
Appendix proofs
1.1 Proof of proposition 1
The third party’s punishment decisions minimize her loss Eq. 2. The interior solution of this minimization problem must satisfy the first-order conditions
\begin{aligned} \kappa – \frac{1}{\theta _T}(N^{\texttt {Base}} – c_i – p_i) = 0 \quad \quad \text {for each } i \,. \end{aligned}
It is straightforward to see that the second-order condition holds. The optimal punishment imposed on an agent i who contributed c_i \ge 0 is thus as stated in Eq. 7.
Since {\textbf{E}}(\theta _T) = \frac{1}{2}, a public good player can in expectation avoid punishment by contributing c^0_i = N^{\texttt {Base}} – \frac{\kappa }{2}. Anticipating the third party’s punishment behavior, a public good player chooses c_i to minimize
\begin{aligned} \mathcal {L}_i = c_i + \lambda \max \left( 0, N^{\texttt {Base}} – c_i – \frac{\kappa }{2} \right) + \frac{(N^{\texttt {Base}}-c_i)^2}{2\theta _i} + \sum _{\begin{array}{c} j\ne i \\ j\in S \end{array}}\frac{(N^{\texttt {Base}}-c_j-p_j)^2}{2\theta _i} \,. \end{aligned}
This can be transformed into the standard minimization problem \min L(c_i, z) where
\begin{aligned} L(c_i, z) = c_i + \lambda z + \frac{(N^{\texttt {Base}}-c_i)^2}{2\theta _i} + \sum _{\begin{array}{c} j\ne i \\ j \in S \end{array}}\frac{(N^{\texttt {Base}}-c_j-p_j)^2}{2\theta _i} \,, \end{aligned}
subject to inequality constraints
\begin{aligned} z&\ge 0 \, \,\\ \text { and } \quad \quad \,\, z – N^{\texttt {Base}} + c_i + \frac{\kappa }{2}&\ge 0 \,. \end{aligned}
The solutions for this problem imply that c_i = N^{\texttt {Base}}-\theta _i, or c_i = N^{\texttt {Base}} – \theta _i(1-\lambda ) or c_i = N^{\texttt {Base}} – \frac{\kappa }{2}. Comparing the optimal values of the objective function Eq. 3 over the domain of \theta _i, we arrive at expression Eq. 6.
Using equilibrium contributions Eq. 6, the expected value with respect to the distribution G of types is
\begin{aligned} {\textbf{E}}^{\texttt {Base}}(c) = N^{\texttt {Base}} – \frac{\kappa ^2}{8}\left( \frac{1}{1-\lambda } – 1\right) – \frac{1-\lambda }{2} \,. \end{aligned}
In equilibrium, condition Eq. 1 has to hold. The equilibrium norm stated in Eq. 8 follows from inserting Eq. 22 into Eq. 1 and solving.
1.2 Proof of proposition 2
The fourth party’s decision on whether to disapprove of the third party’s actions is derived directly from minimizing the loss function Eq. 5, resulting in expressions Eqs. 11 and 12.
As shown in Proposition 1, a third party’s most preferred punishment in the absence of a fourth party is \max \{0, N^{\texttt {Base}} – c_i -\theta _T \kappa \}. Third parties with type \theta _T \ge \sqrt{\delta }/\kappa prefer less punishment compared to what is necessary to avoid being sanctioned by F. For these types, minimizing loss Eq. 4 thus calls for punishing all public good players who contributed strictly less than N^{\texttt {FP}} – \sqrt{\delta } by N^{\texttt {FP}} – c_i – \sqrt{\delta }, i.e., the amount of punishment that makes F indifferent between sanctioning and not sanctioning T.
Third party types with \theta _T < \sqrt{\delta }/\kappa prefer punishment N^{\texttt {FP}} – c_i -\theta _T \kappa, which satisfies F. Public good players in equilibrium anticipate third party behavior., they expect to be punished
p_i = {\left\{ \begin{array}{ll} \max \{0, N^{\texttt {FP}} – c_i – \sqrt{\delta }\} & \text { if } \theta _T \ge \frac{\sqrt{\delta }}{\kappa }\\ \max \{0, N^{\texttt {FP}} – c_i -\theta _T \kappa \} & \text { if } \theta _T < \frac{\sqrt{\delta }}{\kappa } \,. \end{array}\right. }
Using that \theta _T is drawn from a uniform distribution on the unit interval, the expected punishment of public good player i is
\begin{aligned} {\textbf{E}}(p_i|\textbf{c}) = \max \{0, N^{\texttt {FP}} – c_i – \sqrt{\delta } + \frac{\delta }{2\kappa } \} \,. \end{aligned}
A public good player chooses c_i to minimize
\begin{aligned} \mathcal {L}_i = c_i + \lambda \max \left( 0, N^{\texttt {FP}} – c_i – \sqrt{\delta } + \frac{\delta }{2\kappa } \right) + \frac{(N^{\texttt {FP}}-c_i)^2}{2\theta _i} + \sum _{j\ne i}\frac{(N^{\texttt {FP}}-c_j-p_j)^2}{2\theta _i}. \end{aligned}
This can be transformed into the standard minimization problem \min L(c_i, z) where
\begin{aligned} L(c_i, z) = c_i + \lambda z + \frac{(N^{\texttt {FP}}-c_i)^2}{2\theta _i} + \sum _{j\ne i}\frac{(N^{\texttt {FP}}-c_j-p_j)^2}{2\theta _i} \,, \end{aligned}
subject to inequality constraints
\begin{aligned} z&\ge 0 \, \,\\ \text { and } \quad \quad \,\, z – N^{\texttt {FP}} + c_i + \sqrt{\delta } – \frac{\delta }{2\kappa }&\ge 0 \,. \end{aligned}
The solutions for this problem imply that c_i = N^{\texttt {FP}}-\theta _i, or c_i = N^{\texttt {FP}} – \theta _i(1-\lambda ) or c_i = N^{\texttt {FP}} – \sqrt{\delta } + \frac{\delta }{2\kappa }. Comparing the optimal values of the objective function Eq. 3 over the domain of \theta _i, we arrive at expression Eq. 9.
Using equilibrium contributions Eq. 9, the expected value with respect to the distribution G of types is
\begin{aligned} {\textbf{E}}^{\texttt {FP}}(c) = N^{\texttt {FP}} – \frac{\delta \lambda + (1-\lambda )^2}{2(1-\lambda )} + \frac{\lambda }{(1-\lambda )}\left( \frac{\sqrt{\delta }\delta }{2\kappa } – \frac{\delta ^2}{8\kappa ^2} \right) \,. \end{aligned}
In equilibrium, condition Eq. 1 has to hold. The equilibrium norm stated in Eq. 13 follows from inserting Eq. 23 into Eq. 1 and solving. It follows from comparing Eqs. 13 and 8 that \sqrt{\delta } < \kappa /2 is necessary and sufficient to ensure that N^{\texttt {FP}} > N^{\texttt {Base}} for all \beta > 0 and \lambda > 0.
1.3 Proof of proposition 3
We solve by backward induction. Let \mathcal {L}_i^A and \mathcal {L}_i^B denote the losses that public good player i incurs if, respectively, candidate A’s punishment proposal \textbf{p}^A = (p_1^A, \dotsc, p_l^A) or candidate B’s proposal \textbf{p}^B = (p_1^B, \dotsc, p_l^B) is implemented. Clearly, i will cast his vote in favor of candidate A (B) if \mathcal {L}_i^A < (>) \mathcal {L}_i^B. In case that \mathcal {L}_i^A = \mathcal {L}_i^B, voter i is indifferent and decides by the toss of a coin.
The loss function Eq. 3 implies that, for any own contribution c_i, i’s loss is at a minimum when p_i = 0 and p_j = N^{\texttt {Comp}} -c_j for all j \ne i. In the equilibrium of majority competition, both office-motivated candidates thus propose to punish all public good players who contribute strictly less than the median amount \tilde{c}_M. Public good players who contribute at least \tilde{c}_M face zero punishment. It follows from the loss mimization problem that the non-punished players’ optimal contribution is c_i = N^{\texttt {Comp}} – \theta _i. The expected median contribution thus is c_M = N^{\texttt {Comp}} – \theta _M, i.e., the loss-minimizing contribution of a public good player with median type \theta _M.
An office-seeking third party candidate has to disregard his own preferences (his \theta-type) and choose punishment in line with the preferences of group members who contributed at least the median amount. We thus arrive at expression Eq. 15.
Public good players with type \theta _i > \theta _M expect to face punishment p_i = \max \{0, N^{\texttt {Comp}} – c_i\}. Minimizing loss in face of non-zero punishment, i’s optimal contribution is c_i = N^{\texttt {Comp}} – \theta _i(1-\lambda ). Clearly, a public good player of type \theta _i > \theta _M prefers to avoid punishment iff
\begin{aligned} N^{\texttt {Comp}} – \theta _M&\le N^{\texttt {Comp}} – \theta _i(1-\lambda ) \quad \text { or, equivalently, } \\ \theta _i&\le \frac{\theta _M}{1-\lambda } {\mathop {=}\limits ^{\text {def}}}\tilde{\theta } \,. \end{aligned}
This gives us the optimal contributions stated in part (i) of the proposition.
Next, we show part (iii). Using equilibrium contributions Eq. 14, the expected value with respect to the distribution G of types is
\begin{aligned} {\textbf{E}}^{\texttt {Comp}}(c) = N^{\texttt {Comp}} – \frac{\theta _M^2}{2}\left( \frac{1}{1-\lambda } – 1\right) – \frac{1-\lambda }{2} \,. \end{aligned}
In equilibrium, condition Eq. 1 has to hold. The equilibrium norm stated in Eq. 16 follows from inserting Eq. 24 into Eq. 1 and solving.
To show part (iv), compare the marginal effect on i’s loss Eq. 3 from being punished one unit more to the marginal effect of other players being punished one unit more. Being punished one unit more increases i’s loss by \lambda, whereas each unit of punishment imposed on another group member j \ne i reduces i’s loss by
\begin{aligned} \frac{N^{\texttt {Comp}} – c_j – p_j}{\theta _i} \,. \end{aligned}
This shows that condition Eq. 17 is sufficient to conclude that i derives a greater disutility from being punished himself than he derives utility from other norm-violators being punished. If the condition is satisfied and the candidates’ proposals differ, then i will prefer the candidate who proposes to punish him less.
Rights and permissions
Open Access This article is licensed under a Creative Commons Attribution 4.0 International License, which permits use, sharing, adaptation, distribution and reproduction in any medium or format, as long as you give appropriate credit to the original author(s) and the source, provide a link to the Creative Commons licence, and indicate if changes were made. The images or other third party material in this article are included in the article’s Creative Commons licence, unless indicated otherwise in a credit line to the material. If material is not included in the article’s Creative Commons licence and your intended use is not permitted by statutory regulation or exceeds the permitted use, you will need to obtain permission directly from the copyright holder. To view a copy of this licence, visit http://creativecommons.org/licenses/by/4.0/.
Reprints and permissions
About this article
Cite this article
Krügel, J.P., Maaser, N. How do higher-order punishment institutions shape cooperation and norm-enforcement?. Rev Int Organ (2025). https://doi.org/10.1007/s11558-025-09594-3
- Accepted
- Published
- DOI https://doi.org/10.1007/s11558-025-09594-3
Keywords
- Norm compliance
- Third party punishment
- Higher-order punishment
- Cooperation
- Public goods game
JEL Classification
- C92
- D02
- H41