Article Content
Abstract
This paper provides a comprehensive analysis of labor market power in Spain, focusing on the period from 1997 to 2021. Using detailed firm-level data from the Central de Balances Integrada (CBI) of the Bank of Spain, we estimate markdowns—a direct measure of labor market power—across various sectors, firm sizes, and regions. Our findings show that there was a notable decline in markdowns following the 2008 financial crisis. However, this trend has partially reversed in recent years, suggesting a resurgence of labor market power, particularly among larger firms. We find that firms with a higher proportion of temporary workers or female workers tend to have higher markdowns.
Explore related subjects
Discover the latest articles and news from researchers in related subjects, suggested using machine learning.
- Gender Economics
- Labor History
- Labor Movements
- Labor Economics
- Labor and Population Economics
- Sociology of the labour market
1 Introduction
Labor market power, defined as the ability of firms to pay wages below the marginal product of labor, has been the focus of much recent economic research and policy analysis. Labor market power is often quantified through markdowns, which measure the gap between the marginal revenue product of labor (MRPL) and the wage paid to the worker. High markdowns indicate substantial monopsony power, where firms suppress wages below the competitive level. Theoretical models point to the firm-specific labor supply elasticity as the key determinant of a firm’s ability to impose a positive markdown (Manning 2013; Card et al. 2018). Understanding labor market power is crucial, as it has profound implications for wage inequality, employment levels, and overall economic efficiency. Using a dataset from the Bank of Spain’s Central de Balances Integrada (CBI), which includes data on over two million firms from 1995 to 2022, we analyze the evolution of markdowns in Spain across various sectors, firm sizes, and regions.
The main objective of this paper is to empirically assess how labor market power in Spain has evolved over the past few decades. The main questions that we seek to answer are: (i) how has labor market power evolved in Spain over this period, (ii) to what extent is there heterogeneity in markdowns across firms, sectors, and regions, and (iii) what is the relationship between market structure and labor market power. To estimate the markdowns, we use the production function approach of Yeh et al. (2022), which applies ideas from the markup estimation method proposed by De Loecker (2011); De Loecker and Warzynski (2012). We adapt this methodology following Hashemi et al. (2022) by directly estimating markdowns without relying on markups and estimating a revenue-production function. To estimate the revenue-production function, we use the proxy variable approach (Ackerberg et al. 2015; Gandhi et al. 2020), which allows us to account for unobserved productivity shocks that may be correlated with input choices. By isolating the MRPL and comparing it with the wages paid, we can calculate markdowns, offering a direct measure of the firm’s labor market power. The richness of the CBI dataset enables us to estimate markdowns at the firm level across different sectors, regions, and firm sizes.
1.1 Related literature
The estimation of markdowns has been a focal point in the monopsony literature, with seminal works such as Manning (2013) and Card et al. (2018) emphasizing the role of firm-specific labor supply elasticity and local labor market competition in determining the extent of labor market power. This approach allows researchers to capture the dispersion in labor market power across different firms and sectors, revealing important heterogeneity that aggregate measures might hide.
In the context of the US labor market, studies by Yeh et al. (2022) and Kirov and Traina (2023) have documented an increase in markdowns in the last two decades in the manufacturing sector. They attribute the rise in labor market power to factors such as technological advancements and globalization. Yeh et al. (2022) highlight how larger firms with significant market share are more likely to exhibit higher markdowns, a pattern that has been observed across various advanced economies.
In contrast, the European context presents a more complex picture. Mertens (2023) finds that, while markdowns have increased in some European countries, the extent and drivers of this trend vary significantly across the continent. The diversity in labor markets characteristics, such as the strength of unions and the prevalence of collective bargaining agreements, play a crucial role in moderating the degree of labor market power. Diez et al. (2022) explore the role of labor market institutions in shaping wage outcomes in Europe, finding that countries with more rigid labor markets tend to have lower markdowns. This suggests that institutional factors, such as collective bargaining coverage and labor market regulation, play an important role in determining the degree of labor market power. The Spanish labor market is an example of a labor market characterized by high union coverage and rigid regulation, making it an ideal setting to examine how institutional constraints influence firms’ wage-setting behavior and labor market power.
Our study contributes to this growing body of literature by providing the first empirical estimates of markdowns for Spanish firms, covering a 25-year period and offering a comprehensive view of how labor market power has evolved around big economic events such as the 2008 crisis.
The remainder of this paper is structured as follows: Section 2 details the data sources utilized in the study, specifically the firm-level data from the Central de Balances Integrada (CBI) of the Bank of Spain, covering a broad sample of firms across multiple sectors and regions. It also describes the filtering and cleaning procedures applied to ensure data reliability. Section 3 presents the theoretical methods employed to estimate labor market power through markdown estimation, showing the differences with previous works on markdown estimation. Section 4 introduces the revenue-production-function approach, which allows us to estimate markdowns while accounting for demand-side factors and firm heterogeneity. Section 5 presents the descriptive results of markdowns for the whole period, followed by a discussion on the heterogeneity of markdowns in Sect. 6, analyzing variations across firm size, industry, and geographic regions. Finally, Sect. 7 summarizes the key findings, discusses their implications, and suggests directions for future research.
2 Data
The primary data source for this study is the Central de Balances Integrada (CBI) of the Bank of Spain (BELab 2024), a firm-level database compiled by the Bank of Spain in collaboration with the Spanish College of Registrars (CORPME). The dataset is constructed using firm-level annual financial statements filed in the Spanish Mercantile Registries, complemented with firm surveys and supervisory reports by the Bank of Spain. The CBI dataset provides granular economic and financial information on Spanish non-financial corporations, making it one of the most comprehensive firm-level datasets available in Spain. The dataset covers the period from 1995 to 2022, with information updated twice per year (June and December). It includes over 900,000 firms annually, of which approximately 600,000 firms pass the quality standards set by the data laboratory of Bank of Spain. The dataset captures approximately 80% of total employment in Spain (Almunia et al. 2018).
Each firm in the dataset is identified by a unique anonymous identifier and is classified by its economic activity (NACE-2009 1-,2-, and 4-digit code), size, and postal code. The dataset contains over 110 numerical variables per firm-year, covering income statements, balance sheets, and other key financial and labor indicators, including total labor costs, number of employees, differentiating between permanent and temporary employment, and wage bill. Also, it includes further firms’ information such as firm age, ownership structure (publicly traded, foreign-owned, or part of a corporate group), capital, debt structure, and financial ratios. We deflate the key variables used in the markdown estimation using the Consumer Price Index (CPI), with 2022 as the base year. The deflated measures include revenues, capital, materials, and wages. The CPI data is obtained from Instituto Nacional de Estadística (INE) (2023b).
The CBI dataset includes both firms that meet the Bank of Spain’s quality control criteria and those that do not, with two explicit quality and reliability indicators, allowing researchers to filter unreliable data when needed. Given that the Bank of Spain applies consistency checks on financial reporting, we restrict our analysis to firms that pass these checks and exclude those with inconsistencies in employment or wage reporting. After dropping those observations that did not pass the reliability checks, we reduce the original sample from more that 22 million to 15,058,301 observations and 2,197,176 distinct firms. Next, we remove firms with missing, zero, or negative values for key variables such as wages, revenues, capital, materials, and labor, leaving 8,900,209 observations and 1,386,054 firms. We further trim the top 0.01% of employment values to exclude implausible employment figures, resulting in 8,899,318 observations and 1,385,837 firms. Additionally, we ensure that neither temporary nor permanent employment exceeds total employment, which leave us with 8,899,309 observations and maintaining the same number of distinct firms. Lastly, we generate a total employment measure as the sum of permanent and temporary employment. Any discrepancy between this constructed measure and the originally reported total employment leads to exclusion. We end up with a final dataset of 8,015,233 observations and 1,344,053 distinct firms. The main variables that we will use for our analysis are:
- Revenues (), total revenues for the one-year period
- Employment (), average number of employees during the period, both fixed-term and part-time.
- Labor cost (), includes both salaries and social expenses.
- Wages (), calculated as the ratio between labor cost and employment .
- Materials (), intermediate consumption during the period.
- Capital (), as property plan and equipment during the period.
Table 1 provides summary statistics for key firm characteristics, including firm age, production, employment, capital, wage bill, and temporary employment share. The average firm in the sample employs 7.51 workers, with a median of 3 employees, confirming that most Spanish firms are micro-enterprises. According to Instituto Nacional de Estadística (INE) (2023a) in 2023, 81.6% of Spanish firms have two or fewer employees, and only 4.1% have more than 10 workers. Revenue is highly skewed, with a mean of 1,336.45 but a median of 302.78, reflecting a small number of large firms driving up the average. Capital and wage expenditures also show substantial dispersion, consistent with the heterogeneous structure of Spanish firms.
Temporary employment accounts for 20.3% of total employment on average, with a median of only 0.49%. The mean temporary employment share is consistent with estimates reported by Banco de España (2023). The low median indicates that smaller firms, which constitute the majority of the sample, employ almost no temporary workers, a pattern also documented by Banco de España (2023), where firms with five or fewer employees have an average temporary employment share of 14.5%. Additionally, half of these small firms employ no temporary workers, while only 10% rely on temporary contracts for more than half of their workforce.
The dataset also provides a detailed breakdown of employment by gender and contract type for the period 2010–2022. The initial sample has 12,623,325 firm-year observations corresponding to 1,895,005 distinct firms. We also trim this sample to enhance the quality and reliability of our results. We first drop missing and negative values for gender-specific employment variables, including temporary and permanent employment figures for male and female. This results in 12,623,309 observations and 1,895,004 firms. Next, we merge this dataset by firm ID and year with our original database. While the total number of observations remains unchanged, this merged dataset introduces firm-year combinations that were either absent or eliminated during the initial trimming and quality checks. To ensure consistency with the original dataset, we drop observations with missing values for our original total employment measure, reducing the sample to 5,416,171 firm-year observations and 1,039,665 firms. We then construct total male, female, and temporary employment variables, excluding observations where these exceed the original total employment measure, reducing the sample to 4,339,694 observations and 958,926 firms. Finally, we validate the data by summing male and female employment to create a new total employment variable, removing mismatches with the original measure, resulting in 1,503,749 firm-year observations and 499,964 distinct firms.
Table 2 presents summary statistics for the subsample of firms reporting gender disaggregated employment data. The average firm employs 5.20 workers, with a median of 2, confirming the prevalence of micro-enterprises, in line with the findings in Table 1 and official statistics from Instituto Nacional de Estadística (INE) (2023a) in 2023. The temporary employment share in this subsample averages 9.28%, with a median of 2.34%, representing a lower mean and a higher median compared to the full sample. This discrepancy arises because the subsample is substantially smaller, as not all firms report detailed employment disaggregation.
The gender composition indicates that male employment averages 66.73% (median 83.33%), while female employment accounts for 33.27% (median 16.67%), reinforcing the male dominance in most firms. In contrast, Instituto Nacional de Estadística (INE) (2020) shows that women constitute 46.4% of the total labor force in 2020, which indicates that, for the firms that reported gender disaggregated data and passed the quality checks, female representation is lower.
3 Methodology
Traditional approaches to estimating markdowns rely on first recovering firm markups and then inferring markdowns under the assumption that at least one input—typically materials—is fully flexible and competitively priced (Yeh et al. 2022; Kirov and Traina 2023). However, this assumption imposes strong restrictions on input choice behavior, leading to potential biases in markdown estimation (Bond et al. 2021). Specifically, if materials are subject to firm-specific pricing, adjustment costs, or supply constraints, the estimated markup becomes unreliable, distorting markdown estimates (Klette and Griliches 1996). Moreover, when revenue-based output elasticities are used instead of physical quantities, the estimated markup collapses, making any inferred markdown invalid (Bond et al. 2021; Hashemi et al. 2022). To address these concerns, we use a direct markdown estimation approach proposed in Hashemi et al. (2022) that eliminates the need for markup estimation, ensuring a more robust and empirically valid methodology.
In this section, we first discuss the limitations of the markup-based approach and demonstrate why it fails when revenue elasticities are used. We then introduce our implementation of the direct markdown estimation methodology following Hashemi et al. (2022), which allows us to recover markdowns using revenue elasticities of labor while controlling for productivity shocks and input endogeneity. To the best of our knowledge, this is the first paper implementing this methodology empirically.
3.1 Limitations of markup-based markdown estimation
Estimating markdowns through markups has become a standard approach in the literature, yet it critically depends on the flexible input assumption. This assumption allows researchers to infer markups and subsequently compute markdowns, but it introduces significant limitations. Under this assumption, materials serve as a benchmark for competitive pricing. Following De Loecker and Warzynski (2012) and Yeh et al. (2022), the markup is estimated as:
where is the output elasticity of materials, and is the share of materials in total revenue. The markup is then used to estimate markdowns, leading to the formula used in Yeh et al. (2022):
where is the output elasticity of labor, and is the labor share of revenue.
This approach is widely used by a substantial body of literature that estimates output elasticities from revenue data (De Loecker and Warzynski 2012; Flynn et al. 2019; Gandhi et al. 2020; Yeh et al. 2022; Kirov and Traina 2023). However, the fact that most datasets contain revenues but not output is a significant issue in this literature (Klette and Griliches 1996; Bond et al. 2021; Mertens 2023), and present key limitations to this approach. The assumption that materials are fully flexible (i.e., free of adjustment costs and priced competitively) may not be valid in all markets. If materials face frictions or firm-specific pricing, the estimated markup could be biased, distorting markdown estimates. Bond et al. (2021) highlight a critical issue with this approach: when revenue is used instead of physical output, the estimated output elasticity is distorted by demand conditions. Specifically, using revenue elasticities instead of output elasticities results inFootnote1
This equation reveals that the markup estimate is biased unless price elasticities are directly observed or controlled for. Consequently, any markdown estimate inferred from such markups inherits this bias, leading to severe measurement errors in labor market power estimates. Therefore, applying the markup formula to revenue-based elasticities results in no useful information about markdowns.
3.2 Markdowns without markups
Instead of assuming frictionless input markets, we estimate markdowns directly from observed revenue elasticities, eliminating the need for markup computation. Our approach builds on Hashemi et al. (2022) and is derived from a monopsonistic firm’s profit maximization problem, where the firm chooses employment to maximize profits:
The first-order condition with respect to employment leads to:
Dividing by , we obtain the inverse-elasticity rule for the markdown:
This formulation shows how markdowns depend on the elasticity of labor supply. With this approach we estimate markdowns “directly” by leveraging revenue elasticities, avoiding the need for markup estimation. Specifically, by expressing the marginal revenue product of labor (MRPL) as , we obtain:
where is the revenue elasticity of labor, directly estimated from firm-level revenue data and following directly from the definition of the marginal revenue product of labor:
Since this approach relies on revenue rather than output, it avoids the Bond et al. (2021) critique because (i) revenue elasticities are directly observed, eliminating the need for price corrections, (ii) markdowns are naturally defined in terms of MRPL and we do not require any assumption about inputs being fully flexible nor any specific product market condition, and (iii) our approach remains valid regardless of whether firms have market power in both labor and product markets.
In this study, markdowns are estimated at the firm level, while the output elasticities required for markdown computation are estimated at the sector level, more precisely, we use NACE-1 digit specification. This means that firms’ wage-setting power is analyzed individually, but their production function parameters are derived from broader sectoral estimates.
This approach is justified by the need to obtain robust estimates of production function elasticities while preserving firm-level heterogeneity in markdowns. Estimating elasticities at the firm level introduces excessive noise due to firm-specific productivity shocks and limited observations per firm, which substantially increases the complexity of its computation.
The definition of labor markets in monopsony analysis is often debated, with some studies focusing on local geographic labor markets (e.g., commuting zones or ZIP code-industry interactions) (Azar et al. 2022), while others define labor markets based on industries or occupations (Yeh et al. 2022). In Spain, collective bargaining agreements are often set at the sectoral level, influencing firms’ wage-setting behavior (Bank of Spain 2003). Our sector-level elasticity estimation aligns with this institutional setting, reflecting industry-wide production conditions while allowing markdowns to vary at the firm level.
4 Revenue-production-function estimation
To estimate markdowns, we first recover firm-level total revenue productivity using the proxy variable approach of Ackerberg et al. (2015). The methodology follows three key steps: (i) estimating the revenue-production function to obtain productivity-adjusted revenue measures, (ii) addressing endogeneity by controlling for unobserved productivity shocks using instrumental variables, and (iii) identifying input elasticities through instrumental variable estimation.
4.1 Specification of the revenue-production function
We model firm revenue as a function of labor, capital, and materials:
where is log revenue, are log labor, capital, and materials, is a firm-specific productivity shock, and is a measurement error.
Unlike standard proxy variable production estimation, which relies on output-based production functions, our approach is explicitly formulated in terms of revenue-production functions (Ackerberg et al. 2015; Yeh et al. 2022; Hashemi et al. 2022). This distinction is critical because, in an output-based setting, productivity enters as a firm’s ability to convert inputs into physical output. In contrast, in a revenue-based framework, productivity captures both technical efficiency and demand-side factors affecting firm-level revenue. By making this adjustment, we ensure that our estimates of markdowns remain robust even when firms exhibit product market power.
4.2 Controlling for productivity using the proxy variable approach
The unobserved productivity shock introduces endogeneity in input choices. To control for this, we assume:
Assumption 1
Labor and materials are flexible inputs, adjusted in response to productivity shocks.
Assumption 2
Capital is predetermined, evolving according to the law of motion:
where represents past investment.
Assumption 3
At least one flexible input exhibits a strictly monotonic demand function in , enabling nonparametric identification.
Assumption 4
is observed by the firm when choosing flexible inputs (l and m) and follows a serially correlated process.
Assumption 5
The measurement error is uncorrelated with firm input choices and is only realized after decisions have been made.
Following Ackerberg et al. (2015), we estimate total revenue productivity nonparametrically by regressing log revenue on a third-order polynomial expansion of inputs. This polynomial provides a flexible approximation of the revenue function, allowing us to extract a firm-specific measure of productivity that is independent of parametric functional form assumptions. The productivity-adjusted revenue measure takes the form of:
where is a flexible function estimated separately by industry.
4.3 Identification strategy and estimation of markdowns
To estimate the input elasticities, we employ a two-step procedure using the Generalized Method of Moments (GMM). We first estimate a Cobb–Douglas revenue-production function by sector using Ordinary Least Squares (OLS). These initial OLS estimates provide a numerically stable starting point for the nonlinear GMM estimation. By initializing the procedure with OLS estimates, we reduce the risk of local convergence failures in the nonlinear optimization step. Given a candidate parameter vector from the OLS, which represents a trial set of input elasticities (labor, capital, and materials), we first compute the unexpected component of productivity:
where represents the residual innovation in productivity.
Since productivity is unobserved and potentially correlated with input choices, we use lagged values of labor and materials as instruments to ensure consistent estimation. These lagged inputs are valid instruments under the assumption that productivity shocks exhibit persistence but are not perfectly predictable.
The estimation proceeds as follows:
- 1.Approximation of revenue productivity: We estimate the total revenue productivity through a third-order polynomial expansion of revenue as a function of inputs and compute predicted revenue values.
- 2.Projection of productivity innovations: Given a candidate vector , we compute firm-specific productivity and project it onto a fifth-order polynomial in lagged productivity to extract the unexpected innovation component .
- 3.Minimization of GMM objective function: We solve for by minimizing the sum of squared moment conditions using nonlinear GMM, where the instruments include one-period lagged labor and material inputs .
To estimate , we minimize the empirical moments based on the orthogonality condition:
where represents the vector of instruments, including lagged labor and materials. The estimation is implemented via a nonlinear optimization procedure in which is iteratively adjusted until the moment conditions are satisfied.
The use of one-period lagged inputs as instruments is standard in the production function literature (Ackerberg et al. 2015; Gandhi et al. 2020; Yeh et al. 2022; Kirov and Traina 2023). Under the assumption that productivity shocks are persistent but not perfectly predictable, lagged inputs remain correlated with input choices but exogenous to unexpected productivity innovations, ensuring identification validity (Blundell and Bond 2000).
Our adaptation of the proxy variable approach to revenue-based production function estimation allows for robust estimation of markdowns. The identification remains similar to previous literature but the interpretation varies as we interpret it as a revenue-production function.
Once the optimal set of input elasticities is obtained, we extract the estimated revenue elasticity of labor, denoted as . Since the production function is specified in logarithmic form, corresponds to the coefficient on labor input from the estimated revenue-production function. This elasticity captures the marginal impact of labor on firm revenue while incorporating firm-specific productivity shocks.
Once we estimate the revenue elasticity of labor, markdowns are computed as:
where is the labor share of revenue calculated as:
where, denotes the log of total labor cost, and is the estimated productivity-adjusted total revenue.
5 Descriptive results
Our analysis of markdowns across Spanish firms from 1997 to 2021 shows significant variation in labor market power over time and across different firm characteristics. The Spanish labor market is characterized by, on average, positive markdowns, though these have fluctuated depending on firm size, sector, and geographic region. For the estimation, we exclude the first two years of the dataset to ensure the availability of lagged variables for estimation and we discard the final year due to potential data incompleteness. With that, we end up with 6,419,544 observations and 1,082,226 distinct firms with markdowns computed throughout the period.
The overall trend in markdowns shows a decline over this 25-year period, particularly following the 2008 financial crisis. Figure 1 presents the distribution of markdowns in 1997 and 2021, where approximately 20% of observations in both years show markdowns situated either below -1 or above 1. Mertens (2023) show that markdown variation is often linked to firm size, with larger firms presenting higher markdowns, whereas smaller firms generally have low or even negative markdowns because of competitive wage-setting pressures or institutional constraints. The large share of small and microFootnote2 firms in our final sample contributes to the observed markdown dispersion and negative markdowns. Additionally, the prevalence of sectoral wage agreements in Spain, which often apply uniformly to any type of firm size, may lead to differences in markdown estimates between firm size categories.
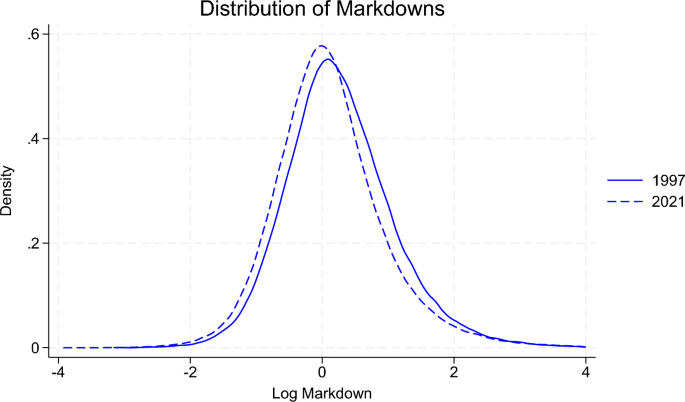
Distribution of markdowns in 1997 and 2021. Notes: The figure shows the distribution of log markdowns in 1997 and 2021. The markdowns are calculated following the methodology explained in Sect. 3. The distribution is weighted by firm’s labor cost to reflect the relative importance of each firm in the labor market. The calculations were performed using nonparametric kernel density estimation to smooth the distribution, ensuring that the entire range of markdown values is captured accurately Source: Author’s own calculation from firm-level data of BELab (2024) in 1995–2022
The decline in markdowns is further supported by the trends shown in Fig. 2, which plots the log markdown alongside the Herfindahl–Hirschman Index (HHI) over time. The weighted-average markdown decreased from approximately 30% before the financial crisis to about 10% post-crisis, with a slight rebound to around 15% by 2021. This reduction in markdowns reflects a combination of economic restructuring and increased competition during the post-crisis recovery period. The 2008 financial crisis led to widespread firm closures, increased unemployment, and tighter credit conditions, all of which likely diminished firms’ ability to exercise monopsony power.
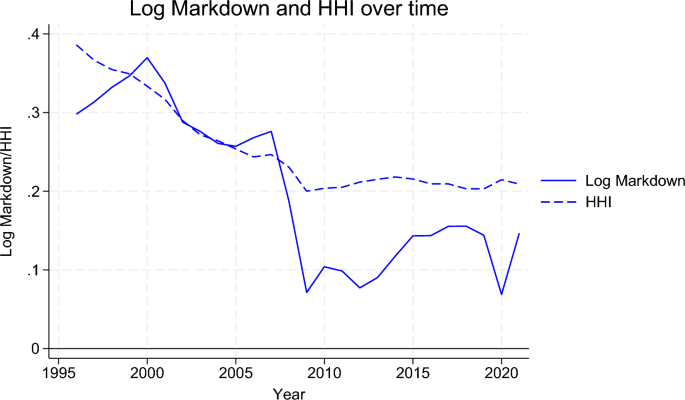
Log markdown and HHI over time. Notes: This figure plots the evolution of log markdowns and the Herfindahl–Hirschman Index (HHI) from 1996 to 2021. The figure presents a weighted average of markdowns across firms, where the weights are based on firm’s labor cost to account for the varying influence of firms in the labor market. Source: Author’s own calculation from firm-level data of BELab (2024) in 1995–2022
Despite the overall downward trend, the increase in markdowns in recent years suggests a potential resurgence in labor market power. These findings align with broader international observations, such as those by Yeh et al. (2022); Kirov and Traina (2023), who documented similar reductions in labor market power in the US manufacturing sector during periods of economic crises. Such parallels suggest that economic crises can significantly alter monopsony power, as firms adjust their wage-setting strategies in response to changing labor market conditions.
However, the observed trends in markdowns are not uniform across the entire period. To ensure robustness, we divided the study into three periods, as we suspected that two structural breaks may not be fully reflected in our overall results: pre-financial crisis (1996–2006), financial crisis and its immediate aftermath (2007–2012), and post-crisis recovery (2013–2021). We observe that markdowns increased until the early 2000 s, peaking around 2001, before declining as stable economic conditions and labor market regulations influenced firm wage-setting behavior. During the financial crisis, markdowns declined sharply, becoming negative in 2008 and 2009 as firm closures, higher unemployment, and reduced product demand limited firms’ ability to suppress wages. After 2013, coinciding with the implementation of the 2012 labor market reforms, markdowns increased again as the reforms introduced greater wage-setting flexibility and altered firms’ responses to labor costs.
The relationship between markdowns and market concentration shown in Fig. 2 emphasizes the importance of market structure in shaping labor market power. Before 2008, both markdowns and the HHI followed similar trends, reflecting the influence of market concentration on wage-setting power. However, after the financial crisis, markdowns declined more sharply than HHI, indicating that despite relatively stable market concentration, firms experienced reduced ability to exercise monopsony power. This suggests that factors beyond concentration, such as shifts in labor market regulations, changing firm dynamics, and broader economic conditions, played a role in shaping firms’ wage-setting behavior.
6 Heterogeneity of markdowns
We conduct a detailed heterogeneity analysis of markdown estimation results across various dimensions, including firm size, geographical regions, sectors, and firm age. The analysis reveals significant variation in labor market power, with larger, older firms, and those in certain regions or sectors, exhibiting higher markdowns. The findings also show that the 2008 financial crisis disproportionately affected smaller firms, leading to a reduction in their markdowns, while larger firms maintained their monopsony power. These results emphasize the importance of considering firm characteristics and regional differences when analyzing labor market dynamics and the impact of policy reforms.
6.1 Markdown percentiles
The evolution of markdowns reveals substantial heterogeneity across firms. Figure 3 presents the distribution of markdown percentiles over time, including the median, mean, 75th percentile (p75), and 90th percentile (p90). A persistent gap between the upper percentiles and the median indicates that a subset of firms consistently exhibits higher markdowns, while most firms maintain relatively low or even negative markdowns. This distributional asymmetry results in a mean markdown that remains above the median, as the right tail of the markdown distribution skews the average upward.
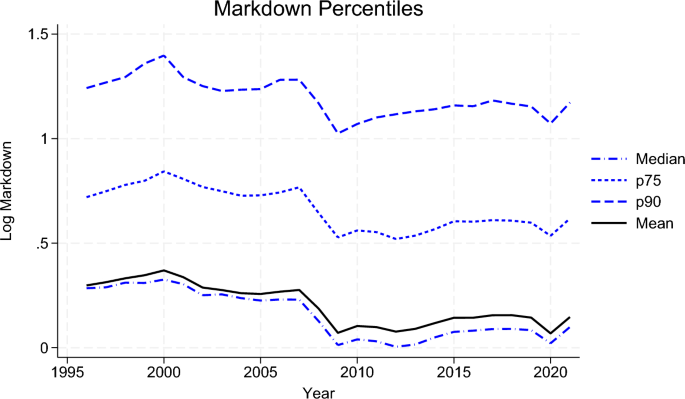
Markdown percentiles over time. Notes: This figure shows the evolution of markdowns across different percentiles (median, 75th percentile, 90th percentile, and mean) from 1996 to 2021. The analysis is conducted on a balanced panel of firms, ensuring that the trends observed are not driven by changes in the composition of the sample over time. Source: Author’s own calculation from firm-level data of BELab (2024) in 1995–2022
6.2 Markdowns by firm size
Figure 4 shows markdowns over deciles of firm size, weighted by employment. Firms in the top two deciles of size exhibit significantly higher markdowns compared to smaller firms. However, there is a U-shaped pattern, where the bottom decile has positive markdowns. These results are consistent with the notion that larger firms tend to have greater monopsony power, while firms in the bottom decile, who are more likely to engage in self-employment, exhibit larger markdowns than small and medium firms.
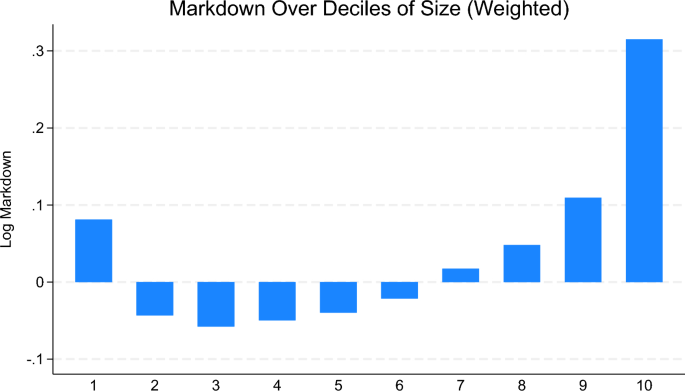
Markdown over deciles of firm size (Weighted). Notes: This figure shows log markdowns across deciles of firm size. The deciles are weighted by labor cost to account for the influence of larger employers in the labor market. Source: Author’s own calculation from firm level data of BELab (2024) in 1995–2022
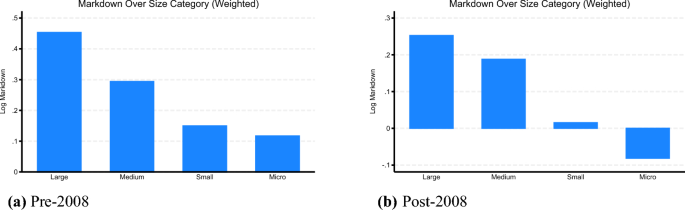
Effect on employment: heterogeneity by pre-period levels of markdown. Notes: This figure compares markdowns by firm size before and after the 2008 financial crisis. The categorization by size was made as before. This analysis is conducted under a balance panel to avoid biases. Source: Author’s own calculation from firm-level data of BELab (2024) in 1995–2022
Figure 5 compares markdowns by firm size before and after the 2008 financial crisis. Firms are categorized by size as follows: large firms have 250 or more employees, medium-sized firms have between 50 and 249 employees, small firms have between 10 and 49 employees, and micro firms have fewer than 10 employees. Markdowns for large firms remained relatively stable, while smaller firms experienced a notable decline, with small-sized firms becoming almost zero and micro firms turning negative after the crisis. This pattern is again consistent with differences in market power and exposure to economic conditions across firm sizes.
6.3 Markdowns by autonomous community
Figure 6 shows the median markdowns across Spain’s autonomous communities, revealing notable regional differences. Navarra, Murcia, and La Rioja exhibit the highest markdowns, while the Balearic Islands, Asturias, and the Canary Islands have the lowest. The exact reasons for these variations are not clear but the most plausible explanation for these variations lies in differences in industry structure, collective bargaining agreements, and regional labor market conditions that influence firms’ wage-setting behavior. Future research could focus on identifying the factors driving these regional markdown differences.
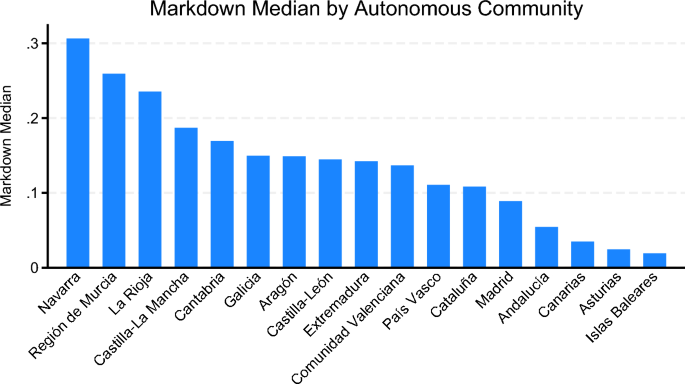
Markdown median by autonomous community. Notes: This figure presents the median markdowns across Spain’s autonomous communities over the whole sample period, reflecting regional variations in labor market power. Autonomous communities are the biggest regions in which Spain can be delimited. Source: Author’s own calculation from firm-level data of BELab (2024) in 1995–2022.
6.4 Markdowns by sector
Figure 7 presents the median markdowns across different sectors, illustrating sectoral differences in labor market power. The results reveal substantial variation, with the energy and manufacturing sectors displaying the highest markdowns, while sectors such as education and administrative services exhibit significantly lower markdowns. In capital-intensive sectors like energy and manufacturing, firms often operate with significant market concentration, high entry barriers, and specialized labor, which limits worker mobility and increase firms’ wage-setting power (Manning 2013; Autor et al. 2020). In contrast, sectors such as education and administrative services tend to be more labor-intensive and have lower capital requirements, which reduces the scope for monopsony power. These findings align with prior research, indicating that markdowns tend to be higher in industries where firms face less competitive pressure in labor markets and can exercise greater control over wages (Mertens 2023; Azar et al. 2020).
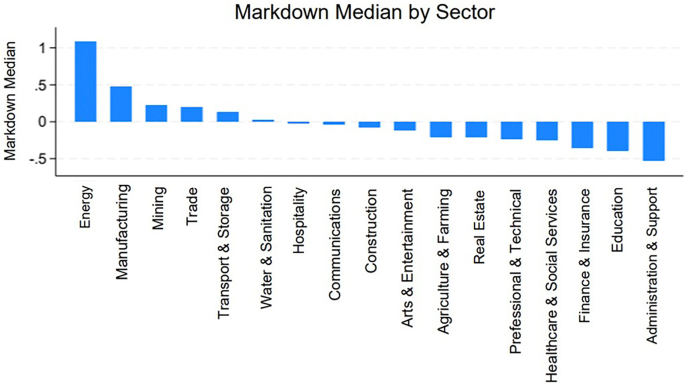
Markdown median by sector. Notes: This figure presents the median markdowns across NACE-2 digit sectors over the whole sample period, reflecting sectoral variations in labor market power. Source: Author’s own calculation from firm-level data of BELab (2024) in 1995–2022
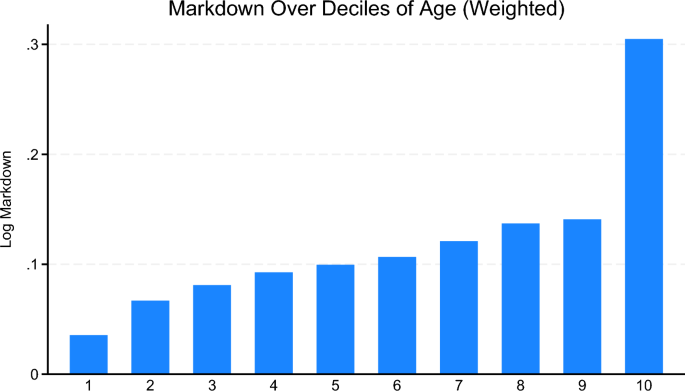
Markdown over deciles of firm age (Weighted). Notes: This figure displays markdowns over deciles of firm age, weighted by employment. Source: Author’s own calculation from firm-level data of BELab (2024) in 1995–2022
6.5 Markdowns by firm age
Figure 8 shows markdowns over deciles of firm age, weighted by employment. Markdown levels increase with firm age, with younger firms exhibiting lower markdowns and older firms showing higher values. This pattern indicates a relationship between firm age and markdown levels. Older firms have had more time to expand, establish long-term employment relationships, and stabilize their position in the labor market, which contributes to their higher markdowns. In contrast, younger firms, which are still growing, show lower markdowns, reflecting differences in wage-setting behavior across firm age groups.
6.6 Markdowns and workforce composition
The composition of the workforce, particularly the proportion of temporary and female employees, also plays a significant role in shaping labor market power. As shown in Table 3, firms with higher shares of temporary workers tend to exhibit higher markdowns.
Similarly, Table 4 shows that firms with higher proportions of female workers also experience higher markdowns, suggesting potential gender disparities in wage-setting practices.
These results are particularly relevant in the Spanish context. Temporary contracts account for a substantial share of employment, influenced by rigid labor regulations and historically high unemployment rates. This has contributed to a segmented labor market where temporary workers receive significantly lower wages compared to permanent workers (Toharia and Jimeno 1993; Bentolila and Dolado 1994; Oliver and Sard 2019). Similarly, differences in wage-setting outcomes are observed across genders in the Spanish labor market (De La Rica et al. 2008, 2010; Guner et al. 2014; Casado-Díaz et al. 2022). Firms in our sample with a higher share of female employment tend to exhibit higher markdowns, which reflects variations in employment conditions, occupational segregation, or differences in bargaining power (Casado-Díaz et al. 2022).
7 Conclusion
This study provides a detailed analysis of labor market power in Spain by estimating markdowns as a direct measure of firms’ ability to suppress wages below the marginal revenue product of labor. Using firm-level data from the Central de Balances Integrada (CBI) of the Bank of Spain, we document substantial variation in markdowns across time, firm size, sector, and regions, offering new insights into the dynamics of monopsony power.
Our findings highlight a significant decline in markdowns following the 2008 financial crisis, with markdowns even turning negative for some firms, suggesting that economic crises can severely limit firms’ ability to exercise monopsony power. However, average markdowns have rebounded in recent years, particularly among larger firms, indicating a partial resurgence of labor market power. The increase in markdowns post-2013 coincides with labor market reforms that gave firms greater flexibility in wage setting, allowing them to regain some monopsony power. These trends align with international evidence, showing that markdowns tend to decline in response to economic crises but recover as firms adjust to new labor market conditions.
The results also show significant heterogeneity in markdowns across firms. Larger firms consistently exhibit higher markdowns than small- and medium-sized firms, supporting the view that firm size is a key determinant of monopsony power. Interestingly, the smallest firms in our sample exhibit a U-shaped relationship in markdowns, with those in the bottom decile having higher markdowns than those in the middle of the size distribution, possibly due to differences in self-employment or labor contracting structures. Additionally, sectoral and regional disparities suggest that institutional and market-specific factors play an important role in shaping firms’ wage-setting behavior. Industries with high capital intensity and strong market concentration, such as energy and manufacturing, have the highest markdowns, whereas labor-intensive sectors with greater worker mobility, such as education and administrative services, show lower markdowns.
Moreover, workforce composition emerges as a significant factor in explaining markdown variations. Firms with higher shares of temporary workers and female employees tend to exhibit higher markdowns, suggesting that monopsony power may contribute to the wage gaps observed across contract types and genders. These findings highlight the importance of labor market institutions and employment protections in moderating firms’ ability to set wages below MRPL.
While our methodology builds on previous approaches by estimating markdowns directly using a revenue-production function and provides the first markdown estimates for Spain, it opens the floor for several avenues for future. First, future work could refine markdown estimation by incorporating firm-specific labor supply elasticities, allowing for a more granular analysis of monopsony power at the individual firm level. Second, exploring the different factors that drive markdown variation across firms and to what extent the geographic region, sector, or the age are responsible for this variation. Third, linking markdowns with worker-level data could shed light on how monopsony power differentially affects workers based on contract type, gender, and skill level. Additionally, a comparative study between Spain and other European economies with varying labor market institutions could help identify the role of regulatory frameworks in shaping markdown trends.
Data Availability
The data that support the findings of this study are derived from the Central de Balances Integrada (CBI) of the Bank of Spain. Access to the data is restricted and requires permission from the Bank of Spain. Further details can be obtained by contacting the Bank of Spain directly.
Notes
-
The product market inverse-elasticity rule states that in equilibrium, the markup adjusts according to the price elasticity of demand . Specifically, firms set their markup such that , ensuring that the marginal revenue equals marginal cost. When markets are perfectly competitive (), the markup collapses to 1, implying price equals marginal cost. In contrast, with market power, firms price above marginal cost in proportion to the inverse of demand elasticity.
-
Small firms are considered those companies with less than 50 and more or equal than 10 employees. Micro companies are those with less than 10 employees.
References
-
Ackerberg DA, Caves K, Frazer G (2015) Identification properties of recent production function estimators. Econometrica 83(6):2411–2451
-
Almunia M, Lopez Rodriguez D, Moral-Benito E (2018) Evaluating the macro-representativeness of a firm-level database: an application for the Spanish economy, Banco de Espana Ocassional Paper (1802)
-
Autor D, Dorn D, Katz LF, Patterson C, Van Reenen J (2020) The fall of the labor share and the rise of superstar firms*. Q J Econ 135(2):645–709
-
Azar José, Marinescu Ioana, Steinbaum Marshall, Taska Bledi (2020) Concentration in US labor markets: evidence from online vacancy data. Labour Econ 66:101886
-
Azar J, Berry S, Marinescu I (2022) Estimating labor market power, National Bureau of Economic Research Working Paper, 30365, https://www.nber.org/system/files/working_papers/w30365/w30365.pdf
-
Banco de España (2023) Temporary employment in Spain: evolution and impact of labor market reforms, technical report 2310, Banco de España, https://www.bde.es/f/webbde/SES/Secciones/Publicaciones/PublicacionesSeriadas/DocumentosOcasionales/23/Files/do2310e.pdf, Accessed February 20, 2025
-
Bank of Spain (2003) “Collective Bargaining in Spain: An Individual Data Analysis,”Technical report, Banco de España, https://www.bde.es/f/webbde/SES/Secciones/Publicaciones/PublicacionesSeriadas/DocumentosOcasionales/03/Fic/do0302e.pdf
-
BELab (2024) Banco de España/CORPME, Colegio de registradores de la propiedad y mercantiles de España. CBI,” https://doi.org/10.48719/BELab.CBI9522_01
-
Bentolila S, Dolado JJ (1994) Labour flexibility and wages: lessons from Spain. Econ Policy 9(18):53–99
-
Blundell R, Bond S (2000) GMM estimation with persistent panel data: an application to production functions. Econom Rev 19(3):321–340
-
Bond S, Hashemi A, Kaplan G, Zoch P (2021) Some unpleasant markup arithmetic: production function elasticities and their estimation from production data. J Monet Econ 121:1–14
-
Card D, Cardoso AR, Heining J, Kline P (2018) Firms and labor market inequality: evidence and some theory. J Labor Econ 36(S1):S13–S70
-
Casado-Díaz JM, Driha O, Simón H (2022) The gender wage gap in hospitality: new evidence from Spain. Cornell Hosp Q 63(3):399–417
-
De La Rica S, Dolado JJ, Llorens V (2008) Ceilings or floors? Gender wage gaps by education in Spain. J Popul Econ. 21:751–776
-
De La Rica S, Dolado JJ, Vegas Sánchez R (2010) Performance pay and the gender wage gap: evidence from Spain.’
-
De Loecker J (2011) Recovering markups from production data. Int J Ind Organ 29(3):350–355
-
De Loecker J, Warzynski F (2012) Markups and firm-level export status. Am Econ Rev 102(6):2437–2471
-
Diez F, Diez MFJ, Malacrino MD, Shibata MI (2022) The divergent dynamics of labor market power in Europe: international monetary fund
-
Flynn Z, Traina J, Gandhi A (2019) Measuring markups with production data, Available at SSRN 3358472
-
Gandhi A, Navarro S, Rivers DA (2020) On the identification of gross output production functions. J Polit Econ 128(8):2973–3016
-
Guner N, Kaya E, Sánchez-Marcos V (2014) Gender gaps in Spain: policies and outcomes over the last three decades. SERIEs 5:61–103
-
Hashemi A, Kirov I, Traina J (2022) The production approach to markup estimation often measures input distortions. Econ Lett 217:110673
-
Instituto Nacional de Estadística (INE) (2020) Central business directory (DIRCE) 2020, https://ine.es/en/prensa/dirce_2020_en.pdf, Accessed 20 Feb 2024
-
Instituto Nacional de Estadística (INE) (2023a) Central companies directory (CCD) and business demographics, https://www.ine.es, Accessed on 20 Feb 2024
-
Instituto Nacional de Estadística (INE) (2023b) Consumer price index (CPI), Base 2022, https://www.ine.es/dynt3/inebase/en/index.htm?padre=61&capsel=62, Accessed on Feb 2024
-
Kirov I, Traina J(2023) Labor market power and technological change in US manufacturing, Technical report, Working Paper
-
Klette TJ, Griliches Z (1996) The inconsistency of common scale estimators when output prices are unobserved and endogenous. J Appl Econom 11(4):343–361
-
Manning A (2013) Monopsony in motion: imperfect competition in labor markets. Princeton University Press, Princeton
-
Mertens M (2023) Labor market power and between-firm wage (in) equality. Int J Ind Organ 91:103005
-
Oliver Xisco, Sard Maria (2019) The wage gap in Spain for temporary workers: the effects of the Great Recession. Int J Manpow 40(7):1319–1346
-
Toharia L, Jimeno JF (1993) The effects of fixed-term employment on wages: theory and evidence from Spain. Investig Económ. 17(3):475–494
-
Yeh C, Macaluso C, Hershbein B (2022) Monopsony in the US labor market. Am Econ Rev 112(7):2099–2138
Funding
Open Access funding provided thanks to the CRUE-CSIC agreement with Springer Nature.
Ethics declarations
Conflict of interest
The authors declare that there are no conflict of interest.
Additional information
Rights and permissions
Open Access This article is licensed under a Creative Commons Attribution 4.0 International License, which permits use, sharing, adaptation, distribution and reproduction in any medium or format, as long as you give appropriate credit to the original author(s) and the source, provide a link to the Creative Commons licence, and indicate if changes were made. The images or other third party material in this article are included in the article’s Creative Commons licence, unless indicated otherwise in a credit line to the material. If material is not included in the article’s Creative Commons licence and your intended use is not permitted by statutory regulation or exceeds the permitted use, you will need to obtain permission directly from the copyright holder. To view a copy of this licence, visit http://creativecommons.org/licenses/by/4.0/.
Reprints and permissions
About this article
Cite this article
Azar, J., Sanz-Espín, J. Labor market power in Spain. SERIEs (2025). https://doi.org/10.1007/s13209-025-00307-y
- Received
- Accepted
- Published
- DOI https://doi.org/10.1007/s13209-025-00307-y
Keywords
- Monopsony
- Markdown estimation
- Spain
JEL Classification
- J42
- L43