Article Content
1 Introduction
Explosive and large-scale caldera-forming eruptions (VEI 6 or more) are among the most catastrophic natural disasters on Earth and can have significant impacts on human societies and the global climate (e.g., Sparks et al. 2005; Self 2006, 2015; Geshi 2020). They commonly cover large areas in ignimbrite sheets and/or widely dispersed co-ignimbrite ash (Sparks and Walker 1977) fall deposits. Large-scale caldera-forming eruptions are unwitnessed low-frequency events so far. Frequency-magnitude power law distributions show VEI 6 to 7 eruptions occur between one and ten times every thousand years (Tatsumi and Suzuki-Kamata 2014; Geshi 2016). Based on geological evidence such as the presence of reworked deposits, erosional surfaces, paleosol, and lack of obvious flow/cooling unit boundaries in the ignimbrites, many previous studies concluded that caldera-forming eruptions occurred over days to months, with no significant time gaps (e.g., Self et al. 1984; Sigurdsson and Carey 1989; Wilson and Hildreth 1997; Wilson 2001, 2009; Hasegawa et al. 2016; Madden-Nadeau et al. 2021). In other words, the general current perception is that caldera-forming eruptions occur “infrequently” and last for a “short time”. However, recent quantitative paleomagnetic studies have reported that there are some cases in which caldera-forming eruption events have continued for several decades to several hundred years (e.g., Hasegawa et al. 2018; Mochizuki et al. 2022; Gravely et al. 2025). These studies suggest that the duration of some caldera-forming eruptions may be much longer than previously thought and that these eruptions would cause long-term, serious damage to economic activity and urban infrastructure such as electrical power grid. Furthermore, as the expected duration of caldera-forming eruptions increases, the probability of synchronous eruptions from different caldera volcanoes also increases. For example, if the eruption durations of two independent volcanoes in different regions increase 10 times, the probability of overlapping between the two eruption events also increases 10 times. Such synchronous caldera-forming eruptions would have more significant social and environmental impacts. Therefore, the verification and accumulation of chronological constraints on caldera-forming eruptions combining geologic and quantitative paleomagnetic methods is useful for long-term, future hazard assessment.
In this paper, we present newly obtained paleomagnetic results on Aso-4 tephra and Kp II/III, which are late Pleistocene caldera-forming eruption deposits in Japan. These deposits are stratigraphically close in the studied sections on Hokkaido, but their source calderas are spatially separated by over 1500 km (Aso caldera is located at central Kyushu and Kutcharo caldera at eastern Hokkaido, Japan) (Fig. 1a-c). Our paleomagnetic data combined with geological data suggest evidence for “synchronous caldera-forming eruptions”. We discuss the significance of such simultaneous occurrence of caldera-forming eruptions.
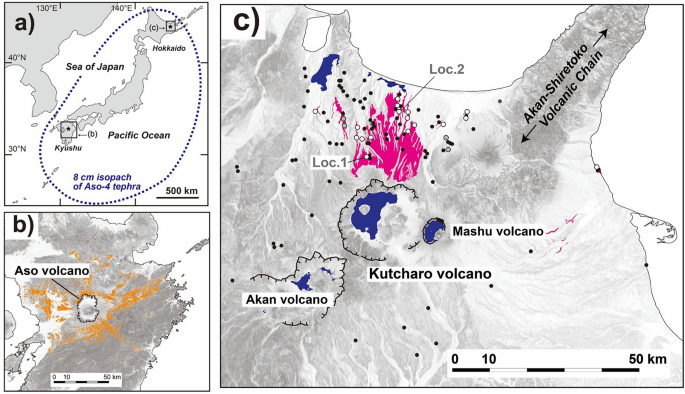
a Map of Japanese archipelago. Locations of Aso and Kutcharo volcanoes are shown as black stars. Blue dashed line indicates an 8 cm isopach line of Aso-4 tephra (showing the maximum bulk volume case: 920 km3) from Takarada and Hoshizumi (2020). b Map of the central Kyushu area showing distribution of Aso-4 ignimbrite (orange pattern) from Hoshizumi et al. (2023). Base map is a slope gradation map by Geological Information Authority of Japan. c Map of the eastern Hokkaido area showing paleomagnetic sampling locations and distribution of the Kp II/III ignimbrite (magenta pattern). Base map is a slope gradation map by Geological Information Authority of Japan. White circles indicate outcrops of the Kp II/III deposits exposed with Aso-4 tephra. Gray circles indicate outcrops of the Kp II/III deposits where the base is not exposed. Small black dots are exposures of the other Kutcharo pumice flow deposits. Dark blue patterns indicate lakes
2 Geological background
2.1 Kutcharo and Aso calderas
Kuthcharo and Aso calderas are 2 of the largest Pleistocene calderas in Japan.
Kutcharo volcano is located in the Akan-Shiretoko volcanic chain at the south end of the Kurile arc (Fig. 1c). It has the largest Quaternary caldera (26 × 20 km) in Japan and experienced repeated explosive eruptions during the Pleistocene, associated with the formation of the Kutcharo caldera. At least eight caldera-forming eruptions occurred between 400 and 40 ka (Hasegawa et al. 2011). These eruptions produced Furuume welded tuff (FWT; Katsui, 1963) and Kutcharo pumice flows VIII to I (Kp VIII to Kp I, from older to younger; Katsui and Satoh 1963). Kp II/III is small (25 km3) in volume (Hasegawa et al. 2012) and is mainly distributed to the north of the Kutcharo caldera (Fig. 1c). Its age is about 90 ka, based on its stratigraphic relation to the widespread Aso-4 tephra (Machida et al. 1985). Katsui and Sato (1963) described the Kp III and Kp II deposits as different eruption deposits. Sumita (1988) recognized a thin brown weathered ash zone between the Kp III and Kp II. Okumura et al. (1985) and Okumura (1988) combined the Kp III and Kp II into single eruption deposit as Kp II/III that was inferred to have been produced within a short time interval. However, none of these studies made any quantitative estimate of the time gap between Kp III and Kp II. In this paper, we define tephra stratigraphy and chronology using paleomagnetic methods.
Aso volcano is located in the Beppu-Shimabara graben (Matsumoto 1979) in central Kyushu (Fig. 1b). It contains Aso caldera (25 × 18 km), which is the second largest Quaternary caldera in Japan after Kutcharo caldera. Aso-4 eruption (87–89 ka) (Ono and Watanabe 1985; Matsumoto et al. 1991; Aoki 2008) is one of the largest caldera-forming eruptions in the last 1 Ma (Takarada and Hoshizumi 2020). Aso-4 tephra is widely distributed across the Japanese Archipelago (Fig. 1a) and has been used as one of the most significant late Pleistocene time marker tephras for volcanological and tephrochronological studies in Japan (e.g., Machida et al. 1985; Machida and Arai 2003; Nagahashi et al. 2007; Aoki 2008; Tsuji et al. 2018). The bulk volume of Aso-4 tephra is estimated to be 590–920 km3 (Takarada and Hoshizumi 2020). Its depositional age corresponds to Marine Isotope Stage 5b (MIS 5b) (Aoki 2008), during which the sea level was lower than today and most of the Japanese archipelago was a subaerial environment. Aso-4 tephra is interpreted as ‘co-ignimbrite ash’ from the Aso-4 ignimbrites because no large Plinian fall deposits have been found below the ignimbrites (Machida et al. 1985; Machida and Arai 2003). Recently, Hozhizumi et al. (2022) described an initial pumice fall beneath the Aso-4 ignimbrites, but its distribution is narrow and limited compared to the Aso-4 tephra.
Aso-4 ignimbrites have been subdivided into three units (Aso-4A, Aso-4 Aso-4B) at some proximal area (Kamata 1997; Hoshizumi et al. 1988). Nakajima and Fujii (1998) and Fujii et al. (2001) carried out paleomagnetic studies on the Aso-4 ignimbrites and Aso-4 tephra. The unit-mean characteristic remanent magnetization (ChRM) directions of Aso-4A ignimbrite is distinguishable from that of Aso-4B at 95% level of confidence, while the unit-mean ChRM directions of Aso-4A ignimbrite is indistinguishable from of the Aso-4 tephra (Nakajima and Fujii 1998; Fujii et al. 2001). These results suggest the Aso-4 tephra is correlative with Aso-4A ignimbrite rather than Aso-4B ignimbrite (Fujii et al. 2001). Some previous studies reported that the thermoremanent magnetizations recorded by hot ignimbrite deposits and the detrital remanence of coeval ash-fall deposits are consistent (Reynolds, 1979; Hayashida et al. 1996; Fujii et al. 2001; Hasegawa et al. 2023). These studies have shown that the ChRM directions of widespread tephra (ash-fall deposits) are reliable record of the paleomagnetic field direction, and that detrital remanence was acquired in a short period of time (e.g., Nakajima and Fujii, 1995, 1998; Fujii et al. 2001; Hasegawa et al. 2023).
In the eastern Hokkaido area (~ 1,500 km away from the Aso caldera in central Kyushu), Machida et al. (1985) reported that Kp II/III deposits overlie Aso-4 tephra, which is over 15 cm thick. Direct contact between Aso-4 tephra and Kp II/III deposits observed in eastern Hokkaido suggests no significant geological time gaps between them. However, the time gap between the Aso-4 tephra and Kp II/III deposits has not been quantitatively evaluated.
3 Methods
3.1 Field mapping and glass chemistry
We conducted a geological survey to reconstruct the stratigraphic relationship of Aso-4 tephra and Kp II/III deposits around the Kutcharo caldera. Kp II/III deposits are widely distributed to the north of the Kutcharo caldera (Fig. 1c). The identification of these tephra was based on the presence of the Aso-4 tephra beneath the Kp II/III deposits and glass compositions of pumice clasts and ash in these deposits. Glass compositions of pumice of Kp II/III deposits are distinguished from those of other Kutcharo pumice flows widely distributed in the same area such as Kp IV and Kp I by its low SiO2 and K2O contents (Hasegawa and Nakagawa 2016).
Glass composition of juvenile pumice clasts and ash were determined using the SEM–EDS system at Ibaraki University (JEOL JSM-IT200 + Aztec energy X-MaxN50). The operating parameters were taken from Shibata and Hasegawa (2024).
3.2 Paleomagnetic sampling and analysis
For paleomagnetic analysis, more than 10 oriented cube samples per tephra layer were collected from two locations (Loc.1 and Loc.2) by pushing 6 cc aluminum/plastic cubes into each tephra layer with a precisely guided device (Fig. 1c). In general, to improve the reliability of ChRM direction data and to evaluate the ChRM directions, it is necessary to sample the same units across multiple sites. However, when ChRM directions are used to assess relative time gaps between multiple pyroclastic deposits continuous sampling at representative sites (e.g., type localities) of the target eruptive deposits with suitable stratigraphic sequence, exposed conditions, and outcrop conditions are most effective (e.g., Hasegawa et al. 2018, 2023, 2024). We sampled the entire Kp II/III deposits (in ascending order Kp III, Kp III-ash, and Kp II) at Loc.1 (N43°45′33″, E144°18′45″). Aso-4 was too thin to be sampled with a precisely guided device at this location. Thus, we sampled Aso-4 at Loc.2 (N43°52′6″, E144°25′15″), which has the same stratigraphy sequence as Loc.1. At Loc.2, however, we were unable to sample Kp II/III deposits because the foothold for us to sample with a precisely guided device could not be secured. There was no evidence of significant tilting, deformation, and vertical ground movement at Loc.1 and Loc.2 where sampling took place. All oriented cube samples were collected only from horizontal strata.
For Kp II/III deposits, we chose as fine ash-rich parts as possible to avoid the significant effect of lapilli-sized materials (e.g., lithic fragments) within the cubes on the quality of the paleomagnetic analysis and directions (Hasegawa et al. 2023). For cube samples from the ash fall deposits (Aso-4 and Kp III-ash), the baking effects of overlying ignimbrites (Kp III and Kp II) must be considered. Therefore, we collected cube samples from 15 cm (Aso-4) to 45 cm (Kp III-ash) below the contact with the overlying ignimbrites (see details in “Evaluation of baking effects by overlying ignimbrites” section). The detailed procedure for orientation and removal of cubes from the outcrops is given in Hasegawa et al. (2023).
The measured azimuth was corrected for the local declination of − 9° with reference to International Geomagnetic Reference Filed (IGRF-13: Alken et al. 2021). Most cube samples were then subjected to stepwise thermal demagnetization (THD). THD was performed using an ASC Scientific furnace (TD-48) at Ibaraki University up to a peak temperature of 600 ℃. Aluminum cubes become deformed or bent at temperatures above 600 ℃. For some samples of Aso-4, stepwise alternating field demagnetization (AFD) was also carried out using an AGICO LDA-5 AF demagnetizer at Ibaraki University to peak alternating filed of 100 mT. During stepwise TD and AFD, remanence was reduced to less than 10% of the initial value. Remanence was measured by AGICO JR-6A at Ibaraki University. Results of the demagnetization were plotted on orthogonal vector plots (Zijderveld 1967) and equal-area projection to evaluate the demagnetization behavior. Characteristic remanent magnetization (ChRM) directions were calculated using principal component analysis (PCA) (Kirschvink 1980). Data points for ChRM calculation of individual cube samples were selected from the most stable component toward the origin of the vector component plot. In this study, demagnetization plots for cube specimens that had maximum angular deviation (MAD) values of greater than 10° were discarded from further analysis. We also removed just one cube sample of demagnetized Kp III-ash from calculating the mean direction because this cube was deformed during the sampling. Site-mean ChRM direction and 95% confidence limits (α95) were calculated using Fisher statistics (Fisher 1953).
Thermomagnetic curves were measured for representative bulk tephra samples (approximately 30–50 mg) using the NMB-89 Natsuhara Giken magnetic balance at Kochi University to determine the Curie temperature (Tc) that can be linked to magnetic minerals and clarify the effects of thermal alternation of magnetic minerals. The analysis was performed at ambient atmosphere with samples heated to a peak temperature of 700 °C and then cooled to the room temperature at a rate of 10 °C/min. The heating/cooling curves were obtained by monitoring these temperature profiles.
4 Results
4.1 Filed descriptions
During geological survey around the Kutcharo caldera, we recognized Aso-4 tephra and Kp II/III deposits in many outcrops. We subdivided the Kp II/III deposits into three subunits, the general characteristics of which are summarized in Fig. 2. In this section, we describe the occurrence of these tephra at selected paleomagnetic sampling sites of Loc.1 and Loc.2 (Fig. 3a-e).
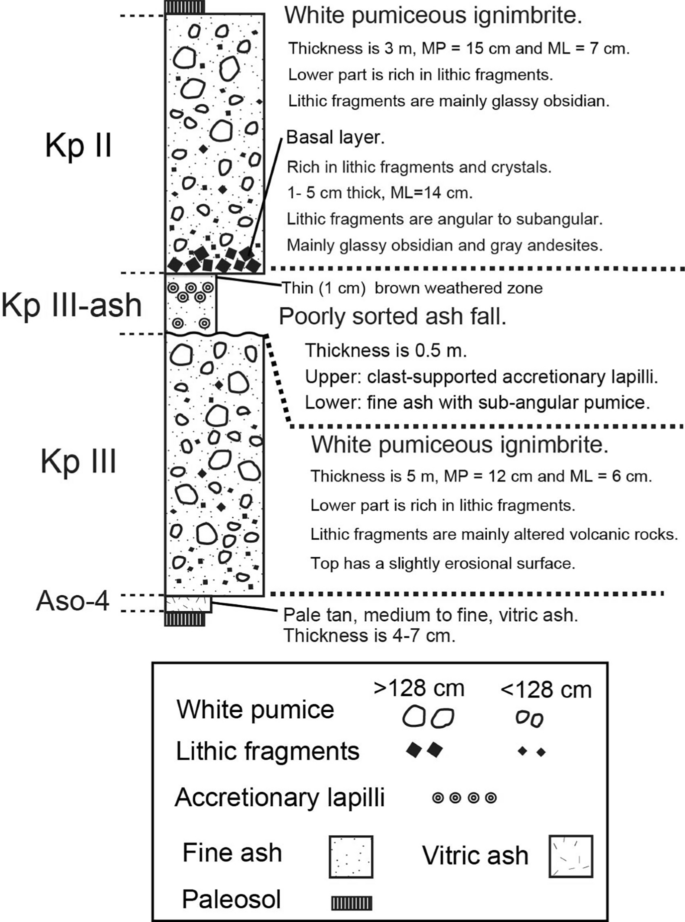
Schematic column of the Kp II/III deposits with the Aso-4 tephra at Loc.1. MP: maximum pumice size for the average of 3 largest clasts recognized at the outcrop. ML: maximum lithic size for the average of 3 largest clasts recognized at the outcrop
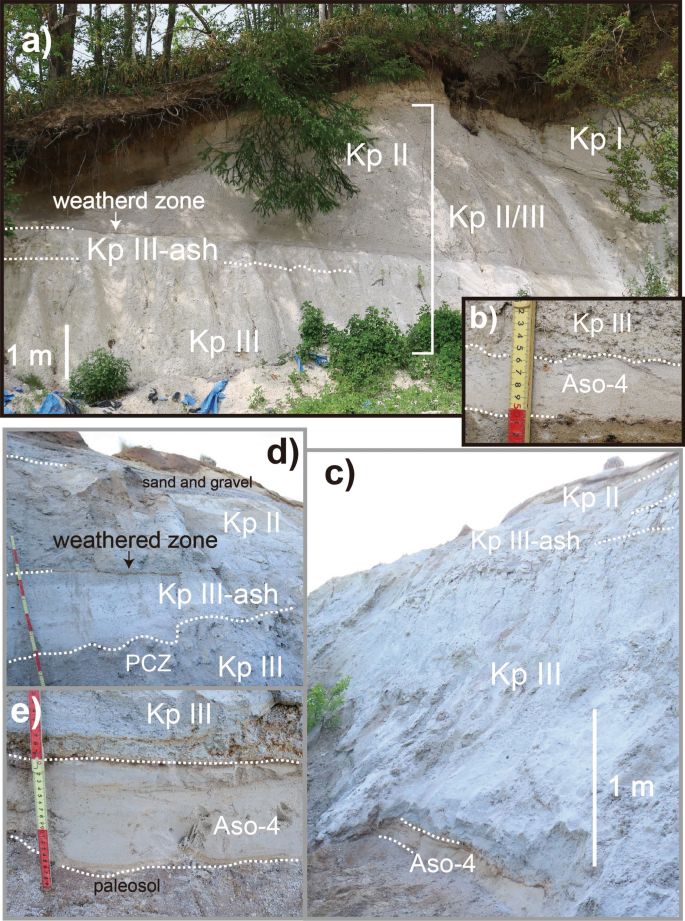
Outcrop photographs of the Kp II/III deposits and Aso-4 tephra. a Whole sequence of the Kp II/III deposits at Loc. 1. b Close-up of Kp III and Aso-4 tephra at Loc.1. c Whole sequence of the Kp II/III deposits and Aso-4 tephra at Loc. 2. d Close-up of Kp III-ash and Kp II with interbedded thin weathered zone at Loc.2. e Close-up of the base of the Kp III at Loc.2
In the eastern Hokkaido area, Aso-4 tephra is commonly found beneath the Kp II/III deposits. Aso-4 tephra is a pale tan, fine ash consisting of glass shards. At Loc.1, proximal to the Kutcharo caldera, the upper surface of Aso-4 tephra is partially eroded in a wavy structure by Kp III ignimbrite and its thickness is 4–7 cm within the outcrop (Fig. 3b). At Loc.2, 20 km from the Kutcharo caldera rim, Aso-4 tephra is approximately 18 cm thick (Fig. 3e), confirming the previous report by Machida et al. (1985). Kp III is a white, massive ignimbrite that overlies Aso-4 tephra in many outcrops. At Loc.1, Kp III is 5 m thick. Lithic fragments of Kp III are mainly altered volcanic rocks. Except for the proximal sites including Loc. 1, the boundary between Kp III and Aso-4 tephra is generally flat, with no significant reworked deposits or soil present between them (Fig. 3e). The top of Kp III has a slightly erosional surface and is directly covered by Kp III-ash without significant reworked deposits in between (Fig. 3d). Kp III-ash is a poorly-sorted ash-fall, rich in fine ash with accretionary lapilli. Such characteristics are interpreted as to be produced by phreatomagmatic eruption style. The upper part of Kp III-ash is slightly weathered and covered by a thin (~ 1 cm) brown layer (Fig. 3a, d). This brown layer is composed of cohesive clay finer than Kp III-ash and and contains few fresh volcanic glass shards, regarded here as a weathered zone The thickness of this weathered zone varies slightly between outcrops from 0.7 to 1.5 cm. Kp II is a white, massive ignimbrite, covering Kp III-ash and the intervening brown weathered zone (Fig. 3a, c, d). Charred plant fragments rarely occur between Kp II and the weathered zone. At Loc.1, Kp II is 3 m thick, and rich in glassy obsidian fragments.
4.2 Glass chemistry
Glass chemical composition of juvenile pumice from the Kp II/III deposits is dacite to rhyolite, with 75.1–77.6 wt.% SiO2 and 1.8–2.0 wt.% K2O, and cannot be distinguished between individual subunits (Fig. 4). Glass chemical composition of Aso-4 tephra is homogeneous dacite with 71.8–72.5 wt.% SiO2. It shows higher K2O contents (4.5–4.8 wt.%) than in Kp II/III deposits (Fig. 4) Our glass chemical composition of Aso-4 tephra plots within the range of values previously compiled by Machida and Arai (2003).
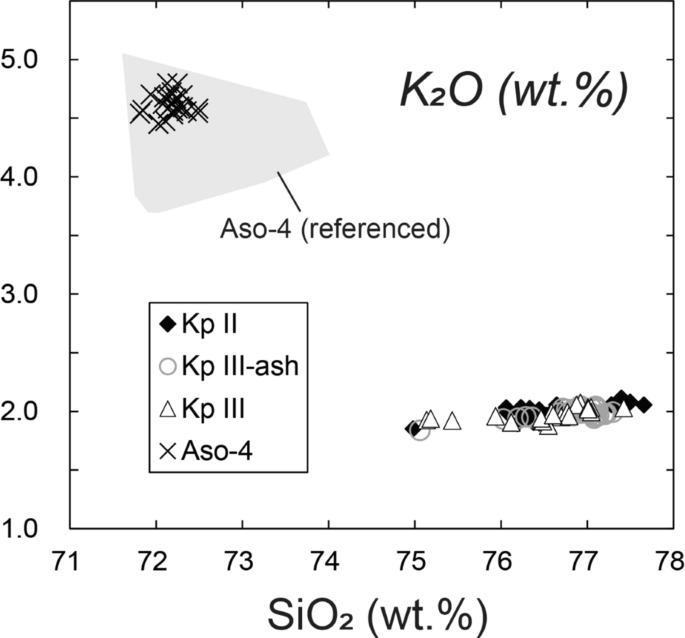
Glass chemical compositions (SiO2-K2O diagram) for juvenile materials analyzed by SEM–EDS. All data are normalized to 100% anhydrous. Compositional ranges presented by shaded pattern is from referenced data; Aso-4: Machida and Arai (2003). See Table S1 in the additional file for more information
4.3 Thermomagnetic analysis
Thermomagnetic curves of each sample are mostly reversible. The cooling curves shift lower and generally display a lower Curie temperature than that observed for the heating curves (Fig. 5a-d). The heating curve of Aso-4 tephra shows that most of the saturation magnetization decreases gradually up to 600 ℃ and then decreases slightly between 600 and 700 ℃ (Fig. 5a). This suggests that the dominant magnetic minerals of Aso-4 tephra are magnetite and titanomagnetite with a small Ti content (Dunlop and Özdemir 1997) and that they have not been affected by low-temperature oxidation (alternation). A decrease in saturation magnetization between 600 and 700 ℃ (Fig. 5a) is likely indicative of the high-temperature oxidation of the original magnetic minerals that have been changed into hematite. Heating curve plots of Kp II/III deposits show two distinct changes in slope between 350 and 380 ℃ and 450–520 ℃ (Fig. 5b-d). The former coincides with the Tc of titanium-rich titanomagnetite, while the latter coincides with the Tc of titanium-poor titanomagnetite (Hunt et al. 1995). These results indicate that the dominant magnetic minerals are common throughout the Kp II/III deposits, perhaps reflecting similarities in magma composition.
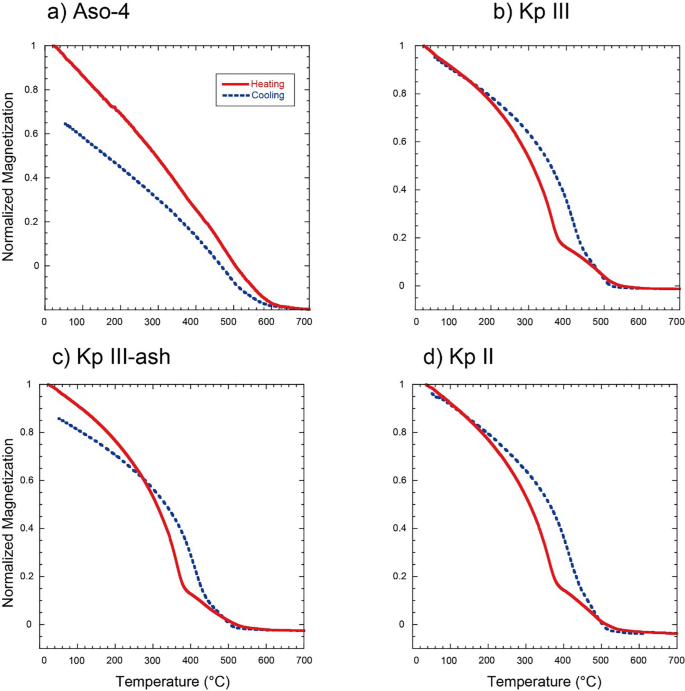
Thermomagnetic curves of selected samples
4.4 Demagnetization behavior
The natural remanent magnetization (NRM) intensities of the Aso-4 tephra and the Kp II/III deposits range from 4.9 × 10⁻² to 1.7 × 10⁻¹ A/m and from 4.9 × 10⁻² to 2.3 × 10⁻¹ A/m, respectively. Ash fall units (Aso-4 tephra and Kp III-ash) were emplaced cold and thus carry a detrital remanent magnetization (DRM), whereas poorly sorted ignimbrites (Kp III and Kp II) were emplaced hot and carry a thermal remanent magnetization (TRM).
During THD, cube samples from Aso-4 tephra show two components, and the remanent magnetization decreases linearly toward the origin from the high-temperature component (generally > 300 ℃) of the vector component plot (Fig. 6a). Low-temperature components showing slightly westward declination than high-temperature components were observed between 200 and 350 ℃ and between a maximum of 200–450 ℃ (Fig. 6b). These low-temperature components are thought to be partial thermoremanent magnetization (pTRM) due to baking by Kp III. The trend of slight westward declination could also be recognized in the low-coercivity component (< 5 mT) in AFD (Fig. 6c). During both THD and AFD, cube samples from the Aso-4 tephra show westward declination in the low-temperature component below 200 ℃ and low-coercivity components, which could be interpreted as both pTRM and possible viscous remanent magnetization (VRM). To eliminate the effect of pTRM and VRM, ChRM was calculated from high-temperature component above 400 ℃ for most cube samples (Table 1). ChRM directions for Aso-4 tephra yield small MADs, mostly below 2.5° (maximum: 5.6°) (Table 1).
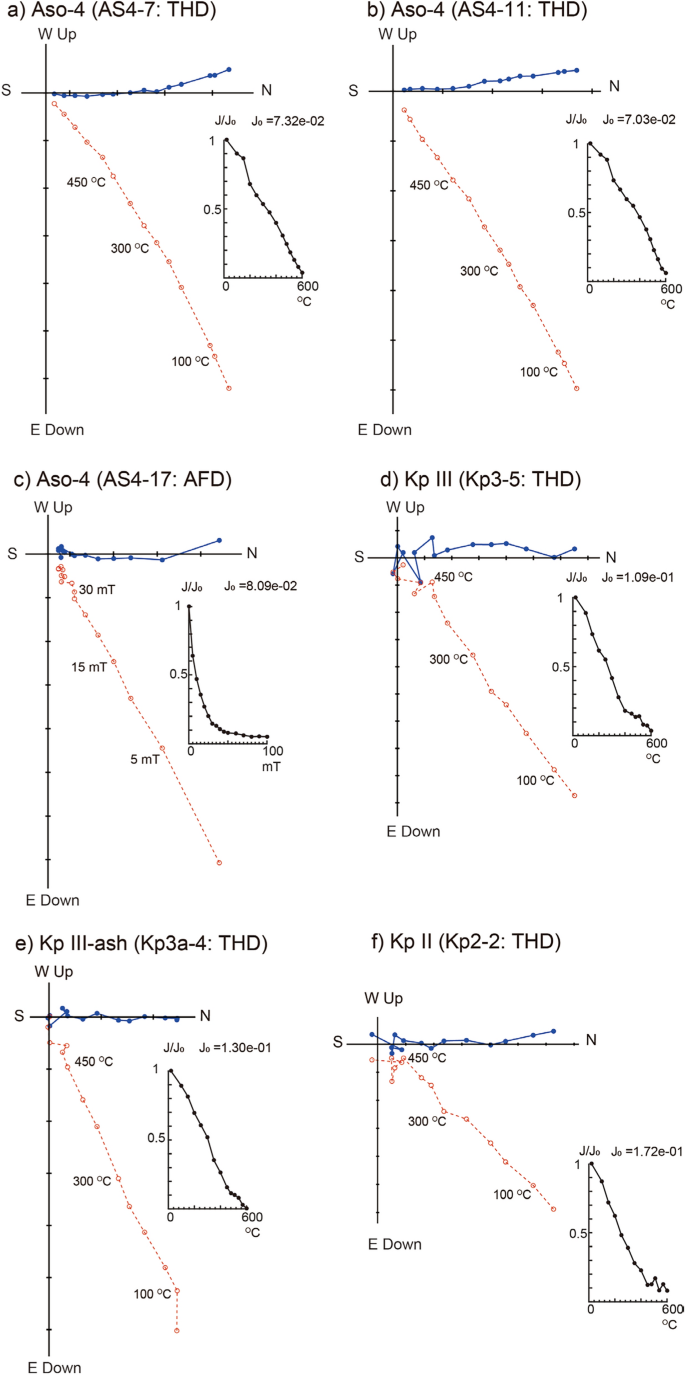
Representative orthogonal vector plots for NRM to the measured samples. Dark blue and red plots are projections onto horizontal and vertical planes, respectively. AS4-17 is a cube sample used for AFD. See Table S2 in the additional file for more information on AFD samples
Cube samples of Kp III-ash show a stable component magnetization from 250 and 480 ℃ with little variability, and magnetizations decrease almost linearly toward the origin of the vector component plot, although at temperatures above 480 ℃, the vector component plots toward the origin with slight scattering (Fig. 6c). Unlike Aso-4 tephra, no obvious low-temperature component was observed in Kp III-ash. For cube samples from the Kp III and Kp II ignimbrites, magnetizations decrease almost linearly toward the origin of the vector component plot in the temperature interval 100–450 ℃, after which their remanent magnetization intensities were 10% or less of the NRM and were almost completely demagnetized by 600 ℃. In both Kp III and Kp II ignimbrites, and similar to Kp III-ash, high-temperature vector components above 480 ℃ are distorted and decrease toward the origin (Fig. 6d-e). Kp II/III deposits display a larger data dispersion than Aso-4 tephra (Fig. 6c-e), yielding MADs mostly above 5.0° (maximum: 9.7°) (Table 1). The large MADs of the Kp II/III samples could be caused by lithic lapilli accidentally incorporated into the cubes during sampling.
4.5 Evaluation of baking effects by overlying ignimbrites
Before calculating the ChRM directions of the samples, we attempt to evaluate the possibility of secondary magnetization for the low-temperature components of Aso-4 tephra and the upper parts of Kp III-ash by the emplacement of overlying hot ignimbrites of Kp III and Kp II. Based on the model of Lerner et al. (2019), we set representative parameters for the thickness of ignimbrites (2.5 m and 3 m), emplacement temperature, and time for the emplacement situations of the ignimbrites. We assumed an initial emplacement temperature of 600 ℃, air and initial temperature of the in-place tephra of 10 ℃, and a value of thermal diffusivity of 4.33 × 10⁻⁷ m2/s as calculated by Keating (2005) for both ignimbrite and underlying tephra. We estimate that the uppermost part of Aso-4 tephra, just below the Kp III contact, heated to a maximum ~ 300 ℃ in 3 days after emplacement of 2.5-m thick Kp III, while the sampling levels of Aso-4 tephra, 15 cm below the base of Kp III, heated to a maximum ~ 230 ℃ in 30 days after the emplacement of Kp III (Fig. 7a). This estimate is consistent with the fact that the low-temperature components of the Aso-4 tephra are observed between 200–300 ℃. Similarly, it is assumed that the uppermost part of Kp III-ash heated to a maximum ~ 300 ℃ in 3 days after emplacement of 3 m thick Kp II, and the sampling levels of Kp III-ash, 45 cm below the base of Kp II, heated a maximum ~ 210 ℃ in 30 days after the emplacement of Kp II (Fig. 7b). If meteoric water sourced from precipitation or groundwater transports significant amounts of heat by liquid, cooling within ignimbrites may be faster than envisioned above (e.g., Randolph-Flagg et al. 2017). Therefore, based on the above model, the effects of the pTRM (baking) of Aso-4 tephra and Kp III-ash are estimated to be 200–300 ℃. However, since no clear low-temperature component was observed for the samples of Kp III-ash, the emplacement temperature of Kp II may have been lower than assumed in the model (i.e., 600 ℃). It should be noted that the above is a simplistic model using dimensionless parameters, and if the actual emplacement temperature is lower than the above estimation, the baking effects would be much smaller than the above estimation.
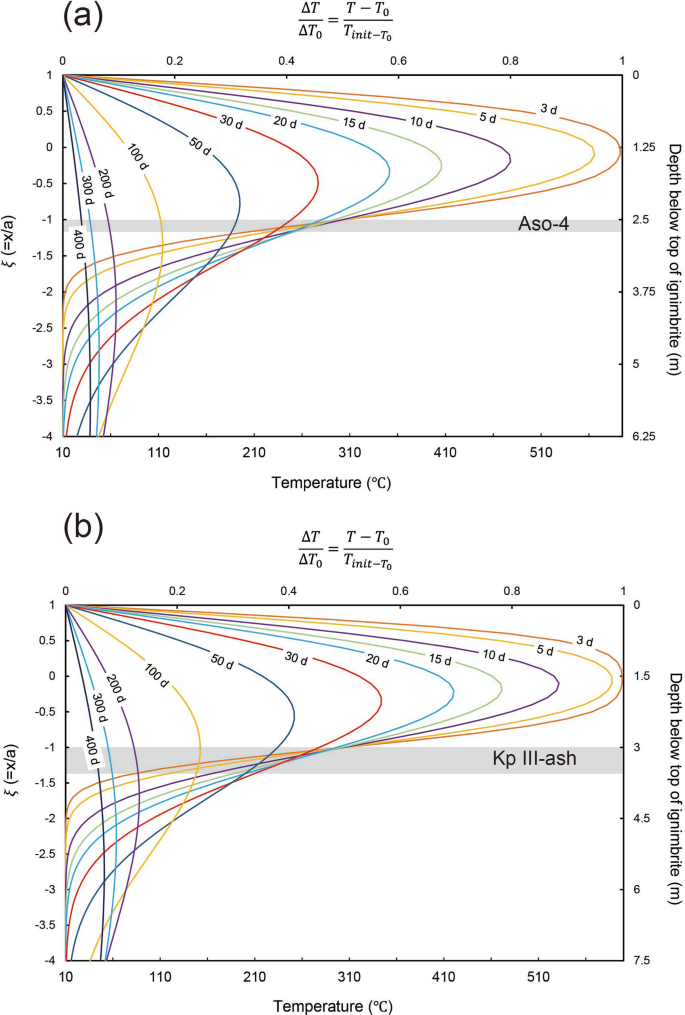
Temperature profiles in the Kp III with 2.5 m thickness (a) and Kp II with 3 m thickness (b) and underlying tephra substrates. The calculation was carried out using the conductive cooling model of Lerner et al. (2019) with initial emplacement temperature of the ignimbrites (), assumed to be 600 ℃, air and initial temperature of the in-place tephra (), assumed to be 10 ℃, and is the actual temperature. The value of thermal diffusivity was set to 4.33 × 10⁻⁷ m2/s. The number of days after ignimbrite emplacement are noted on the temperature profiles. , where is the half thickness of the ignimbrite and is the distance above the mid-point of the ignimbrite
4.6 Mean directions
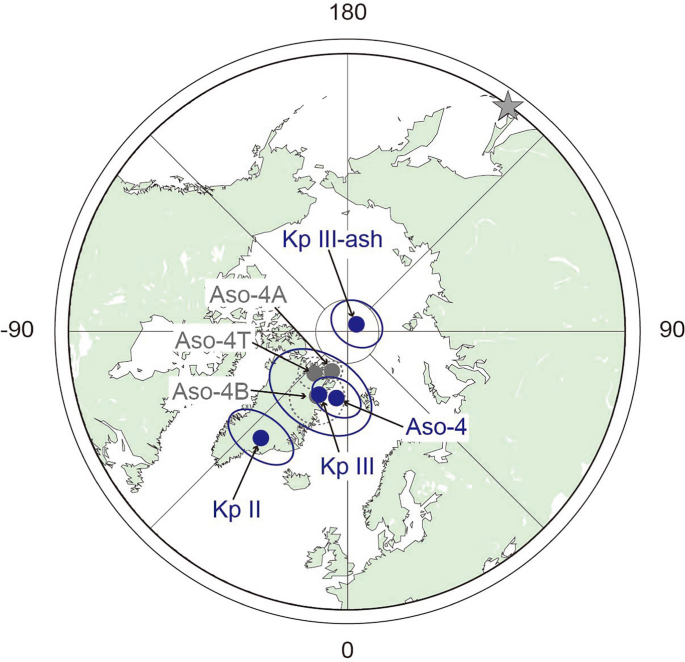
Mean directions for each unit were calculated from ChRM directions obtained from 11 to 15 samples. Table 2 and Fig. 8 summarize mean ChRM directions and 95% confidence limits for all units sampled. The mean paleomagnetic directions of Kp III (Dec = 357.5°, Inc = 52.5°, α95 = 6.3°), Kp III-ash (Dec = 359.3°, Inc = 63.8°, α95 = 2.7°) and Kp II (Dec = 1.4°, Inc = 39°, α95 = 4.8°) are distinct from one another because their α95 circles do not overlap, although they are stratigraphically sequential (Fig. 8, Table 2). The sequence remarkably changes in inclination with stratigraphic height (with the declinations remained nearly constant); that is, the inclination steepened by 11.3° from Kp III to Kp III-ash and subsequently shallowed by 24.8° from Kp-III ash to Kp II. The mean ChRM direction of Aso-4 tephra was well determined with a small 95% confidence limit (α95 = 3.0°). Our mean ChRM direction of Aso-4 tephra is consistent with the previously reported paleomagnetic directions for Aso-tephra in eastern Hokkaido (especially, sites AS9 and AS10 of Fujii et al. 2001); these mean directions are indistinguishable from each other at the 95% confidence limit with the exception of one site (AS11 of Fujii et al. 2001) that has a slightly steeper inclination than the other three (Fig. 8, Table 2). In addition, these mean directions of Aso-4 tephra are indistinguishable from those of the overlying Kp III ignimbrite (Fig. 8, Table 2).
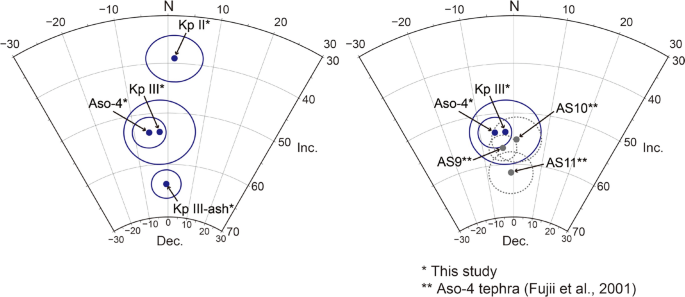
Mean ChRM directions for each deposit with 95% confidence limit (α95). Dark blue circles and rings are site means for Kp III (Dec = 357.5°, Inc = 52.5°, α95 = 6.3°), Kp III-ash (Dec = 359.3°, Inc = 63.8°, α95 = 2.7°), Kp II (Dec = 1.4°, Inc = 39.0°, α95 = 4.8°), Aso-4 tephra (Dec = 354.4°, Inc = 53.7°, α95 = 3.0°) and respective α95s. Gray circles and dashed rings are the previously reported site means for the Aso-4 tephra (AS9, Dec = 356.5°, Inc = 56.5°, α95 = 2.5°; AS10, Dec = 0.9°, Inc = 55.2°, α95 = 4.4°AS11, Dec = 359.0°, Inc = 61.6°, α95 = 4.0°; from Fujii et al. 2001)
5 Discussion
5.1 Evaluating the time gaps in the Kp II/III deposits
Our field observations, as well as previous studies (Katsui and Satoh 1963; Sumita 1988), recognize a geological time gap in the Kp II/III deposits, as indicated by the presence of the thin brown weathered zone between Kp III-ash and Kp II. This evidence is consistent with our new paleomagnetic data. The mean paleomagnetic directions of the Kp II/III deposits, composed of two ignimbrites (Kp III and Kp II) and interbedded ash fall (Kp III-ash) are different, with no overlap between the 95% confidence circles of the mean directions, indicating that there are significant time gaps between them (Fig. 8). Ignimbrite units acquired thermal remanent magnetization while the ash fall unit independently acquired a depositional remanent magnetization. First, we consider the possibility that the deposition of thick ignimbrite (Kp II) may have compacted the underlying ash fall tephra (Kp III-ash) as in depositional remanent magnetization of sedimentary rocks, especially in marine or lake sediment cores, where shallowing inclinations have been reported (e.g., Turner et al. 2015). Shallowing inclinations have also been observed in the laboratory deposition experiments and are particularly evident when the magnetic grains carrying the remanent magnetization have a flattened shape (e.g., Tauxe and Kent 1984; Li and Kodama 2016). However, the remanent magnetization direction of Kp III-ash shows the steepest inclination within the Kp II/III deposits (Fig. 7, Table 2). Therefore, the possibility of a shallowing inclination of Kp III-ash due to compaction from the deposition of thick overlying ignimbrite (Kp II) can be ruled out. Next, we estimate minimum durations of time breaks within the Kp II/III deposits using the fastest changing rate of the archaeomagnetic secular variation curve (Hatakeyama 2013). The fastest changing rate was calculated to be 0.16°/year in angular distance in the 50-year-windows over the past 1600 years from eastern Hokkaido area. The angular distance between Kp III and Kp III-ash and that between Kp III-ash and Kp II are 11.3° and 24.8° respectively. The 95% confidence limits of the mean angle differences are then determined to be ± 5.5° and ± 4.4°, respectively based on the method of error analysis (Hasegawa et al. 2024). To generate a difference of 11.3° ± 5.5° in an angle difference between Kp III and Kp III-ash, it would take at least 71 ± 34 years. Similarly, to generate a difference of 24.8° ± 4.4° between Kp III -ash and Kp II, it would take at least 155 ± 28 years. These results indicate that the Kp II/III deposits were not produced by a single, short-lived eruption. Instead, Kp III and Kp II represent caldera-forming eruptions that occurred episodically, interbedded by a phase of phreatomagmatic activity (Kp III-ash). The combined duration of these events is estimated to be at least several hundred years. Furthermore, the formation of the weathered zone (< 1 cm thick) between Kp III-ash and Kp II would have taken a minimum of 100 years. Our results are consistent with qualitative geological observations by Katsui and Satoh (1963) and Sumita (1988).
5.2 Simultaneity of two caldera-forming eruptions from Aso and Kutcharo calderas
Finally, we evaluate the ChRM direction of Aso-4 tephra obtained for the first time from the THD experiment in this study with previously reported data and discuss the simultaneity of Aso-4 and Kp III eruptions. Summarizing the description of the sampling sites in Fujii et al. (2001), Aso-4 tephra sampled at sites AS9 and AS11 is interbedded with sandy gravel layers, while Aso-4 tephra at site AS10 is overlain by Kp II/III deposits. Furthermore, paleomagnetic directions of Aso-4 tephra overlap with those of Aso-4A welded tuff as mentioned earlier (see details in “Kutcharo and Aso calderas” section). Comparing our paleomagnetic data of the Aso-4 tephra with the data of Fujii et al. (2001), regardless of whether the sampled layer is covered by the Kp II/III deposits or not, the mean directions of AS9 and AS10 show good agreement with our mean direction of Aso-4 and are indistinguishable at 95% confidence level (Fig. 8). Considering the vector plots (Fig. 6a, b) and cooling rate of the overlying ignimbrite (Kp III) based on the time–temperature calculation (Fig. 7a), our samples for Aso-4 tephra were not re-heated enough to overwrite their remanent magnetizations completely. Therefore, the mean direction of Aso-4 tephra is assumed to be a depositional remanent magnetization direction. The mean direction of AS11 shows a slightly steeper inclination than those of the other three sites and is close to the mean direction of Kp III-ash (Fig. 8), but further discussion is difficult because Fujii et al. (2001) did not argue for the steep inclination of AS11, and the detailed sampling conditions are unknown.
The mean ChRM directions of Aso-4 tephra, including previous published data from eastern Hokkaido (Fujii et al. 2001), are consistent with the mean ChRM direction of Kp III (Fig. 8). This suggests that the two caldera-forming eruptions of Aso-4 and Kp III occurred within several decades of each other in the Kyushu and Hokkaido. Our observations show that Aso-4 tephra is directly covered by Kp III (although the upper surface of the Aso-4 tephra is locally partially eroded), and there is no significant reworked deposit or soil between the two These observations strongly point to a short time of emplacement. Machida et al. (1985) pointed out that Aso-4 tephra is typically 12–15 cm thick in eastern Hokkaido, thicker than in Honshu where it is generally 10 cm thick or less. Based on these, Machida et al. (1985) considered that Aso-4 tephra in eastern Hokkaido has been well preserved due to coverage by Kp III shortly after its emplacement and concluded that the thicknesses of Aso-4 tephra in this area represent its original thickness. New ChRM directions reported in this paper provide quantitative evidence in support of Machida et al. (1985).
Such stratigraphically close caldera-forming eruptions are rare globally, but have been reported from the Rotorua and Ohakuri calderas (Taupō Volcanic Zone, in New Zealand) (Gravely et al. 2007) and the Tokachi and Akan calderas (central and eastern Hokkaido) (Hasegawa et al. 2008; Hasegawa and Nakagawa 2016) based on geological and petrological studies. In the former case, the paired Rotorua and Ohakuri calderas are ~ 30 km apart, and the linkage of the two caldera-forming eruptions has been explained by regional tectonic activity in the Taupō Volcanic Zone and the resulting lateral movement of co-silicic magma (Gravely et al. 2007). In the latter case, the Tokachi and Akan calderas are ~ 50 km apart. Hasegawa and Nakagawa (2016) suggested that the linkage of these caldera-forming eruptions is related to the regional co-tectonics of oblique subduction of the southern Kurile arc. In the current case, the Aso and Kutcharo calderas belong to different tectonic settings and have no co-magmatic relation, so it would be difficult to explain the factors behind both caldera-forming eruptions in terms of tectonic activity. The caldera-forming eruptions of Aso-4 and Kp III are independent events that occurred coincidentally but were close in time, possibly within a human lifespan. Examples of similar cases to this one include the two caldera-forming eruptions that occurred in Indonesia in the nineteenth century. The Tambora 1815 eruption and the Krakatau 1883 eruptions are independent caldera-forming eruptions (VEI 6 or more) that occurred several decades apart (Self and Rampino 1981; Sigurdsson and Carey 1989). Both caldera-forming eruptions dispersed large amounts of ash, causing widespread devastation, including global temperature decline (e.g., Rampino and Self 1982; Harvey and Grab 2022), and tsunami in the latter case (Simkin and Fiske 1983).
Although caldera-forming eruptions occurring so close in time are not common and only a few cases have been reported as mentioned above, they probably occurred more frequently in the geological past than initially thought, especially in the case of “longer-duration” eruptions such as Kp II/III deposits. Synchronous caldera-forming eruptions are likely to be part of a random variation in the timing of VEI 6 to 7 eruptions across any given arc. However, it should be noted that if such eruptions happen in time proximity and overlap in their areas of effect, they may increase large-scale volcanic hazards significantly. The case study of Aso-4 and Kp III gives us the opportunity to improve the knowledge of the hazard with significant global impacts posed by synchronous caldera-forming eruptions.
Furthermore, in the case of the Aso-4 eruption, the paleomagnetic directions of the Aso-4A and Aso-4B ignimbrites are clearly different without overlapping in their 95% confidence limits (Fujii et al. 2001). A simple interpretation of these results is that there is also a time break in the Aso-4 eruption. Virtual geomagnetic poles (VGPs) were calculated for each subunit of the Aso-4 (Aso-4A, Aso-4 T, and Aso-4B) and Kp II/III deposits at reference points in central Kyushu and eastern Hokkaido, and their stratigraphic variations are shown in Fig. 8. The VGPs of the subunits of Aso-4 ignimbrites appear to be less variable but show general similarity to VGP in Kp III. In addition, the VGPs of the Kp II/III deposits may reflect paleomagnetic secular variation (PSV). A more detailed investigation comparing the paleomagnetic directions of the Kp II/III deposits and the entire Aso-4 eruption sequence on the Kyushu mainland is expected to provide a higher resolution record of PSV changes and their time scales.
In future work, extending our method to stratigraphically adjacent tephras (i.e., key time marker tephras from the Pleistocene to the Holocene epochs) that are not directly overlapping in their distributions will allow us to verify the time-scale relationship and that simultaneity of explosive caldera-forming eruptions in the tephra stratigraphy. Such information will be useful not only for the spatial and temporal constraints of volcanic hazards but also for chronostratigraphy (Fig. 9).
VGP projection of Kp II/III and Aso-4 eruptions deposits showing unit mean VGP plots with 95% confidence limits from the eastern Hokkaido area and overall unit mean VGP plots with 95% confidence limits from the central Kyushu area. The confidence limits for the Kp II/III deposits and the Aso-4 tephra are indicated by solid ellipses, while those for the Aso-4 ignimbrite (Aso-4A, -4 T, -4B) by dashed ellipses. The confidence limits for the Aso-4 ignimbrite were calculated by using published data from Nakajima and Fujii (1998) and Fujii et al. (2001)
6 Concluding remarks
We obtained the ChRM directions from Aso-4 tephra and Kp II/III deposits, which are stratigraphically close late Pleistocene caldera-forming eruptions in Kyushu and Hokkaido, Japan. The mean ChRM directions of Kp II/III deposits, which contain an intervening thin brown weathered zone (< 1 cm), differ between subunits without overlap at their 95% confidence limits. Based on the fastest changing rate of the PSV curve, the time break within Kp II/III deposits is estimated to be more than a minimum of 100 years. The mean ChRM direction of Aso-4 tephra was determined with a small 95% confidence limit (3.0°) and is consistent with previously reported mean ChRM directions in the eastern Hokkaido area. These mean ChRM directions of Aso-4 tephra are also consistent with the mean ChRM direction of Kp III. Our data suggests that Aso-4 and Kp III eruptions occurred within several decades of each other, possibly even simultaneously. These eruptions can be considered as an example of “synchronous caldera-forming eruptions” that may be rare but have certainly occurred in the past. It should be noted that our data are from two sites from different outcrops, and only one sampling site for each tephra, therefore, we could not evaluate the statistical error within each tephra completely. Sampling from whole sequential tephra (sites) at the same locality was difficult in the current study’s outcrops due to erosion (lacking some tephras) or inaccessible. For a robust comparison, our future work will aim to confirm that same tephra samples from different locations show the same ChRM directions. This will provide more statistical confidence in the data set. Although large-scale eruptions are random events, they can happen close together in space and time. Even if the probability of co-occurrence is low, it is important to consider the cumulative hazards of such geological phenomena. We emphasize that the accumulation of paleomagnetic data from geologically close tephras will allow us to verify the time scale relations of synchronous caldera-forming eruptions.
Availability of data and materials
Almost data needed to evaluate the conclusions in the current study are present in this paper and/or the Supplementary Materials. In addition, the datasets used and/or analyzed during the current study are available from the corresponding author on reasonable request.