Article Content
抽象的
背景
靶向扩增子测序 (TAS) 是一种高通量基因分型方法,可以在所需位置设计标记。然而,TAS 基因分型需要全基因组的引物设计和复杂的测序后分析,这对于不熟悉生物信息学的研究人员来说非常困难。因此,研究人员需要一个能够轻松进行 TAS 基因分型数据分析的环境。
结果
在本研究中,我们开发了引物设计工具 MKDESIGNER 和测序后分析工具 TASEQ。使用这些工具,用户只需三个命令即可完成 TAS 的引物设计流程,并且只需四个命令即可获取基因分析所需的文件。MKDESIGNER 的策略是先设计尽可能多的标记,然后将其精简到所需的数量。这使得用户能够设计出分布更均匀的标记。此外,还可以降低着丝粒周围的标记密度。我们使用这些工具通过 TAS 进行了基因分型,并取得了接近先前研究报告的成功率(约 80%)。
结论
MKDESIGNER 和 TASEQ 有助于在配备新一代测序仪的环境中轻松实现 TAS 基因分型。它们使用 Python 实现,可在 Bioconda 中免费获取。源代码可在 GitHub 上获取。(https://github.com/KChigira/mkdesigner, https://github.com/KChigira/taseq)。
背景
基于DNA的遗传标记已广泛应用于医学、遗传学和分子生物学等生物学领域。基因分型是这些研究的关键,目前已设计出各种方法[13, 25]。
The first generation of genotyping was using restriction fragment length polymorphism (RFLP) or random amplified polymorphic DNA (RAPD) markers [1]. These markers are not frequently in the genome, and the experiments were laborious and time-consuming. In the next stage, genotyping by PCR and electrophoresis using simple sequence repeat (SSR) markers has been commonly performed since 1990’s [18, 26, 31]. Although it has led to many genetic achievements, it is now considered labor intensive in the age of next-generation sequencing (NGS). High-throughput NGS genotyping methods are now available. Because whole-genome sequencing for all genetic analysis populations is expensive, it is common to produce a reduced representation of the genome before sequencing [13]. There are several methods to produce a reduced representation of the genome, such as RAD-seq [3], GBS [16], MIG-seq [32], and GRAS-Di® [17]. However, these methods do not allow prior knowledge of marker locations. SNP genotyping assay using microarray technology can solve this problem [21]. It is commercially available [2], but the cost of design novel SNP array is high compared to the NGS-based methods mentioned above. Targeted amplicon sequencing (TAS) is also a promising method. For genotyping by TAS, the sequences around the targeted polymorphisms are amplified by multiplex PCR, and the amplicons are sequenced via next-generation sequencing (NGS). Therefore, markers can be designed at desired positions. The concept of TAS was first reported more than a decade ago [6]. Similar methods have been reported under different names, such as Genotyping-in-Thousands by sequencing (GT-seq) [9] and Multiplex PCR Targeted Amplicon Sequencing (MTA-Seq) [29]. It is also provided commercially as Ion AmpliSeq technology (Thermo Fisher Scientific, Inc.) [30].
In crop science, bi-parental quantitative trait loci (QTL) analyses are often conducted to identify genomic regions related to agronomically important traits. For this application, it is important to ensure enough markers across the genome while keeping costs as low as possible. TAS has a potential to meet this requirement. However, TAS is currently not frequently used for this application for several reasons. First, a reference genome is required for custom primer design. Second, it is expensive to purchase hundreds or thousands of primers. Third, it requires advanced knowledge and skills in bioinformatics. In recent years, the first problem is not so critical because reference genomes have been established for many crop species [34]. Natsume et al. [28] showed that the second and third problems could be overcome by using cheaper low-concentration mixed primers and developing a free software named V-primer.
The workflow of TAS is roughly divided into three steps (Fig. 1). First, DNA markers are extracted from the NGS data of the parental lines, and primers are designed. Second, the NGS library is constructed using the designed primers, and sequencing is performed. Third, the data obtained by NGS are analyzed, and the genotypes at each DNA marker of each line are determined. The first and third steps require specialized bioinformatics analysis.
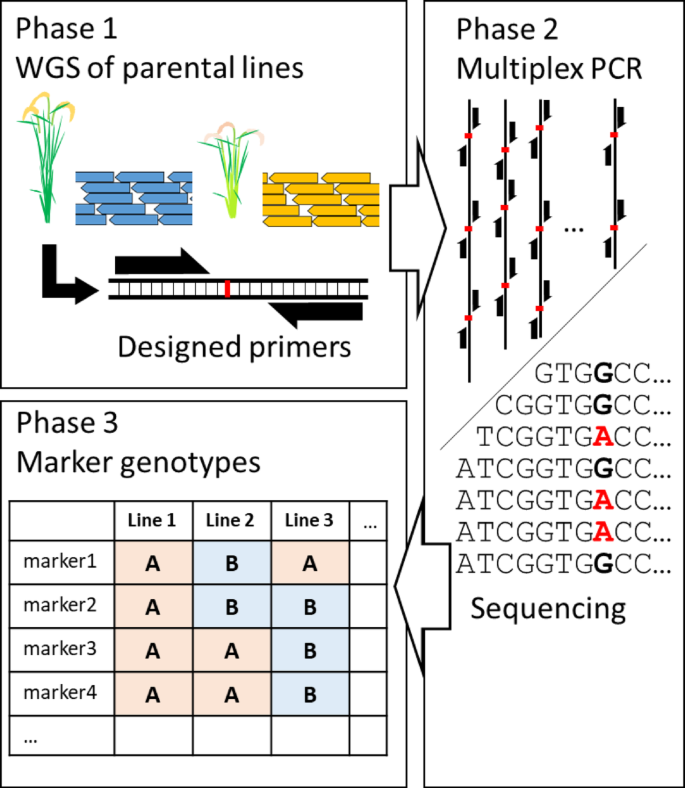
Schematic diagram of genotyping by targeted amplicon sequencing workflow
V-primer [28] can perform the first step, DNA marker extraction and high-throughput primer design, at once. However, no integrated pipelines have been developed to handle the third step, analysis after sequencing. There is also room for improvement in primer design strategies. To make TAS more generally available, it is necessary to establish user-friendly pipelines that covers whole the experiments.
In this study, we developed a novel genome-wide primer design tool, MKDESIGNER, which implements specialized functions for genotyping by TAS. We also developed the post-sequencing analysis tool TASEQ. This tool is a pipeline that takes FASTQ files as input and outputs genotype files in a format that can be used directly for QTL analysis. By implementing these tools, genotyping by TAS for populations which are derived from cross among two to several fixed parental lines can be done easily.
In this paper, we explain how MKDESIGNER and TASEQ work and provide a practical example of genotyping by TAS in rice using these tools.
Implementation
Overview of the tool
MKDESIGNER and TASEQ are command line interface tools that have been verified to work on Ubuntu 20.04 and later. The source codes are written in Python and are available at GitHub (https://github.com/KChigira/mkdesigner, https://github.com/KChigira/taseq)
They can be installed via Bioconda, including their dependencies. The workflow is shown in Fig. 2. MKDESIGNER has three commands, and TASEQ has four commands. The role of each command and the external tools used are described in the following sections.
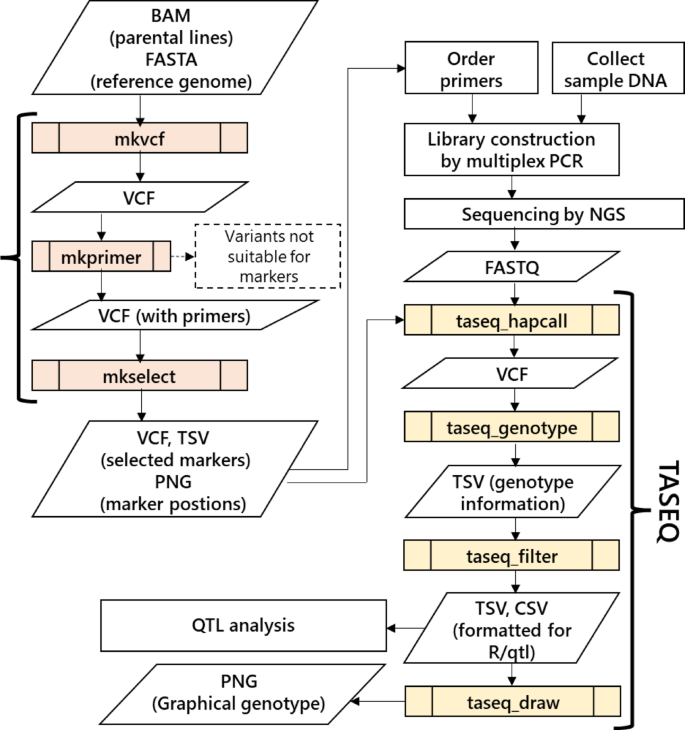
Workflow of genotyping by TAS with automated data analysis using MKDESIGNER and TASEQ
‘mkvcf’
This command is responsible for creating a VCF file from the NGS data of the parent varieties. It requires BAM-formatted NGS data from two or more parental lines and a FASTA-formatted reference genome as input. This command produces a VCF file using GATK HaplotypeCaller [27] and BCFtools [12]. Pre-created VCF files can also be used for subsequent analysis, but they may lack the information necessary for primer design (ex. sequence depth of each polymorphism). Therefore, we provide a command to create a VCF in a format suitable for subsequent analysis.
‘mkprimer’
This command is responsible for designing primers that amplify around polymorphisms. To prepare markers, polymorphisms suitable for primer design are selected from the input VCF table according to the following criteria:
- (1)Genotypes differ between parental lines. For example, the GT fields of parental lines A and B in the input VCF are ‘0/0’ and ‘1/1’, respectively.
- (2)The reliability of polymorphism calling is high (passes GATK VariantFiltration: QD < 20.0 and FS > 200.0 and SOR > 10.0, fixed values).
- (3)The sequence depth is within the specified range (default: 2 ~ 200, modifiable).
The primers used were designed using Primer3 software [33]. The primers used are designed so that they do not overlap other DNA mutations and are in accordance with other specified conditions (Supplementary Fig. 1). The designed primers were checked to determine whether their amplicons were specific to the genome via BLAST software [8]. The BLAST condition is based on the settings described in the report of Primer-BLAST software [35]. By default, ‘mkprimer’ explores as many markers as possible (Fig. 3a). If users want to save time, the number of polymorphisms to search for primers can be reduced by selecting the appropriate options. Finally, a VCF-formatted file containing the sequences of the designed primers added to the ‘INFO’ column is output.
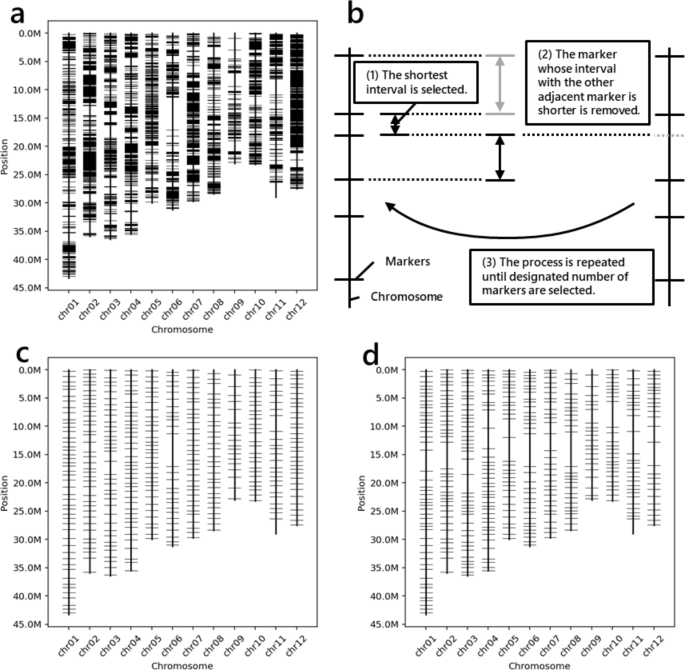
Example for the output of MKDESIGNER. a Genome-wide markers made by the ‘mkprimer’ command. b The strategy selecting markers in the ‘mkselect’ command. a Normally selected 384 markers using the ‘mkselect’ command. d 384 markers selected by the ‘mkselect’ command using the ‘–density’ option to reduce markers near the centromeres
‘mkselect’
This command narrows the markers to a specified number at equal intervals. The ‘mkselect’ works according to the following algorithm (Fig. 3b):
- (1)The physical distance between all the DNA markers is calculated, and the pair of markers with the narrowest spacing is identified.
- (2)For that pair of markers, the physical distance to the other adjacent markers is calculated. The marker with the smaller distance is removed.
- (3)These steps are repeated until the specified number of markers is reached.
The output files are a VCF file containing only the selected markers, a TSV file containing primer information, and a PNG file illustrating the physical positions of the selected markers (Fig. 3c).
In linkage mapping, physical distances among markers are not proportional to genetic distances, especially near centromeres. ‘mkselect’ can adjust the marker density of such regions by adding a tab-delimited file of the specified format to the ‘–density’ option (Fig. 3d).
`taseq_hapcall’
The following commands belong to TASEQ, which is responsible for post-sequencing analysis. The graphical workflow is provided in Supplementary Fig. 2. The first command is responsible for extracting target polymorphisms from raw sequence data (FASTQ) of multiplex PCR amplicons. First, the sequence reads in the input FASTQ files are trimmed using Trimmomatic [4] (a). Moreover, a list of sequences before and after the target polymorphism was generated using SAMtools in FASTA format (b). Second, the reads in (a) are mapped to (b) using BWA [24]. Third, the genotypes of the markers are determined using GATK HaplotypeCaller. Finally, the results for all the lines are combined and output as a VCF file.
‘taseq_genotype’
This command determines which genotype of each line, and each marker is homozygous for parent A (A), homozygous for parent B (B), heterozygous (H), or missing (-). The algorithm proceeds as follows:
- (1)Markers with a sequence depth less than 10 (default, modifiable) are considered missing (-).
- (2)If the proportion of minor alleles is less than 10% (default, modifiable), the marker genotype is homozygous for the major allele (A or B).
- (3)If the marker genotype is not determined in (2), the chi-square value is calculated for the ratio of the number of reference alleles and alternative alleles. If the p-value of chi-squared test is greater than 0.05 (modifiable), the marker genotype is missing (-); otherwise, it is heterozygous (H).
The genotypes of each line and marker are output as a TSV file.
‘taseq_filter’
This command removes markers with a specified percentage of missing data or less than a specified minor allele frequency. If parental lines are included in genotyping, only markers that are supported by the marker genotypes of the parental lines can be selected. The output CSV file is formatted to be used directly as genotype data in R/qtl [5].
‘taseq_draw’
This command visualizes marker genotypes at the chromosomal level for each line. It outputs PNG files for the number of lines in the output directory.
Results
Demonstration
To demonstrate the utility of MKDESIGNER and TASEQ for genotyping experiments, we apply the software to real genotyping of the population derived from crosses among temperate japonica rice cultivars. The population is composed of three subgroups derived from different cross combinations: (a) KM × KS BC2F2 (84 plants), (b) NK × KS BC2F2 (84 plants), and (c) OM × KS BC5F2 (60 plants). KM, NK, OM, and KS indicate the japonica rice cultivars named ‘Kameji’, ‘Nakate-Shinsenbon’, ‘Omachi’, and ‘Koshihikari’, respectively. The breeding processes of these lines are illustrated in Supplementary Fig. 3.
- (1)Preparation of input data.
Illumina paired end sequence data of KM, NK, OM, and KS were obtained from the European Nucleotide Archive; ID: DRX002961, DRX139945, DRX000450, and DRX002963, respectively. Low-quality bases and adaptors in sequence reads were trimmed with Trimmomatic software [4]. The trimmed reads were mapped to the reference sequence, IRGSP-1.0 using BWA software [24]. The mapped reads were sorted, and PCR duplications were marked using GATK software [27]. This process produced BAM files for each cultivar.
- (2)Primer design using MKDESIGNER.
The primer sets for TAS are expensive, so designing a marker set that can be applied to genotype multiple different populations helps reduce costs. In this demonstration, we attempt to create a marker set that can be used for three different cross-combinations. The commands used are described in Supplementary note 1. Through ‘mkvcf’ and ‘mkprimer’, we obtained 4,308 SNP markers that can distinguish the genotypes of KM × KS, NK × KS, and OM × KS (common markers) (Supplementary figure 4). Using ‘mkselect’, we chose 384 common markers (Supplementary figure 4). Of course, we could have used this primer set as is, but there were no common markers for some chromosomal regions. To fill these regions, we applied the ‘mkprimer’ command to each cultivar combination (Supplementary figure 4). From the combination of specific markers, 30 markers were manually selected. We added these markers to the primer set and thinned out the same number of common markers located near the centromere manually. We defined these 384 markers as the final version (Fig. 4a).
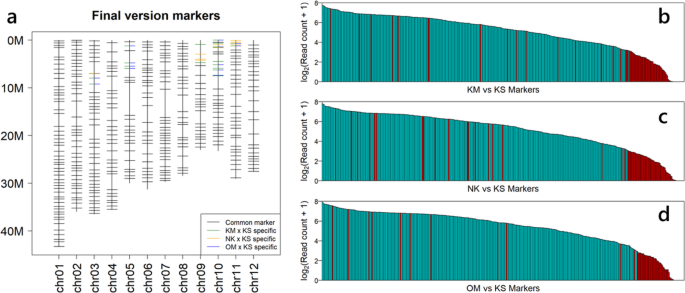
Demonstration of genotyping by TAS using MKDESIGNER and TASEQ. a The final version marker set allowing triple genotyping (KM vs KS, NK vs KS, OM vs KS) with one primer set designed by MKDESIGNER. b–d Number of reads obtained for each marker. Blue and red bar indicate successful and unsuccessful markers, respectively. b KM × KS BC2F2. c NK × KS BC2F2. d OM × KS BC5F2
- (3)Targeted amplicon sequencing.
We ordered the final version primer set, constructed a library, and sequenced it via a next-generation sequencer. The method of this phase is described in Supplementary note 2.
- (4)Post-sequencing analysis using TASEQ.
We obtained over 3.5 M reads for each subgroup. To analyze the genotypes of each line, we used the ‘taseq_hapcall’, ‘taseq_genotype’, and ‘taseq_filter’ commands. Within each subgroup, markers that were successfully genotyped in 80% or more lines were defined as successful markers. There were 298 (79.7%), 287 (79.1%) and 308 (83.7%) markers for KM × KS BC2F2, NK × KS BC2F2 and OM × KS BC5F2, respectively (Table 1). The number of reads mapped to each marker varied widely across the markers (Fig. 4b–d). Most of the unsuccessful markers had low numbers of mapped reads (Fig. 4b-d). Some examples of graphical genotypes obtained via TASEQ software are shown in Figure 5.
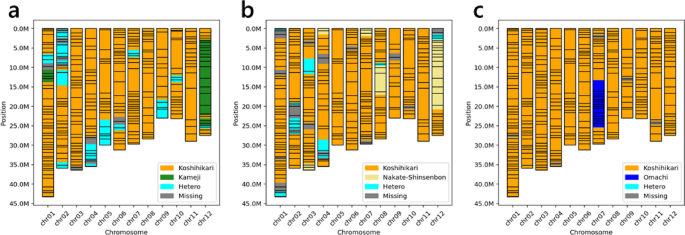
Example of the graphical genotypes obtained using TASEQ software. a One of KM × KS BC2F2 lines. b One of NK × KS BC2F2 lines. c One of OM × KS BC5F2 lines
Comparison with existing tools
To evaluate the performance of MKDESIGNER, we compared running time, the number of designable markers, and maximum memory usage with V-primer, an existing marker design tool for TAS. Options that can be changed by commands are set as identically as possible between the software. Input commands are shown in Supplementary note 3. The running time of mkprimer was longer than similar search with V-primer (Table 2). The number of markers designed by mkprimer was smaller than by V-primer (Table 2). Of the markers designed with mkprimer, 5,291 markers were also designed with V-primer, accounting for 78.8% of the total (Supplementary Fig. 5). In addition, mkprimer has a function to thin out the SNPs to be searched in advance. When the SNPs to be searched were thinned out to 1,000, the running time was about 9 min (Table 2).
Discussion
[Strategies of MKDESIGNER]
The first free software used to create genome-wide SNP markers applicable to genotyping by targeted amplicon sequencing (TAS) was the V-primer [28]. The V-primer considers the occurrence of hetero dimers for all combinations of primers used in multiplex PCR. This was expected to improve the amplification efficiency of multiplex PCR. However, the number of markers that can take heterodimers into account is limited. V-primer supports searches after thinning out markers to intervals of 1 Mb or more. In contrast, MKDESIGNER does not consider the presence of hetero dimers (Fig. 2). MKDESIGNER designs as many markers as possible from the polymorphisms of the parents’ genome, and finally, the thinning program adjusts the number of markers to the desired number (Fig. 3). This strategy is superior in creating a larger number of markers at more even intervals. It also allows for the implementation of a function to reduce the marker density in regions that are less important for genetic analysis, such as those near centromeres (Fig. 3). However, there is a concern that the presence of hetero dimers may adversely affect the results.
[Effect of not taking heterodimers into account was little]
Whether our strategy is successful can be revealed only by real experiments. In this study, we performed genotyping by TAS using 384 primer pairs designed by MKDESIGNER and investigated the success rate of each marker. Approximately 80% of the markers were successfully genotyped (Table 1). In previous studies considering heterodimers, 149 out of 183 markers (81.4%) were successful [28]. The distributions of the number of reads obtained per marker in this study (Fig. 4) were also similar to the results of Natsume et al. [28]. Therefore, it appears that not taking heterodimers into account has little effect on the success rate of genotyping. However, further data of real genotyping using these software are needed to accurately discuss the success rate.
[Limits of MKDESIGNER]
For primer designing, the running time and the maximum memory usage of mkprimer were larger than that of V-primer (Table 2). Both are written in Python and rely on the same tools (Primer3, BLAST, etc.), so there is room for improvement in the algorithm of mkprimer. In addition, the number of markers obtained was greater with V-primer than with mkprimer. This might be because the criteria for determining primer specificity in mkprimer are too strict, and there is also room for improvement. However, mkprimer has a function to narrow down polymorphisms to desired number in advance, in which case markers can be designed relatively quickly (Table 2).
[Future development]
Large variation in the number of reads per marker was observed in this study (Fig. 4), as in a previous study [28]. In multiplex PCR, the degree of PCR amplification varies depending on the target [15]. If this bias can be overcome, genotyping by TAS will be more efficient. We will try to improve the tool for designing primer sets that would solve this problem in the future. In recent years, long-read sequencing makes it possible to construct chromosome level pan-genomes that include structural variations [19]. Such data may be used to further refine primer design.
In this study, we demonstrated the use of genotyping with our tools for rice populations. Currently, our tool is only applicable to progenies of pure parent varieties. However, genetic analysis of plants with highly heterogeneous genomes, such as fruit trees, has also been actively conducted in recent years [7, 10, 23]. There is also a demand for genotyping of natural populations to conduct genome-wide association studies, genomic selection, and research of genetic diversity [20, 22]. In the future, we will improve our tool to address TAS in highly heterozygous species and to make TAS markers which are able to use for genotyping of natural populations.
[Development of TASEQ]
Some pipelines for post-sequencing data analysis of other NGS-based genotyping methods have been developed. For example, Stacks is popular for post-sequencing data analysis tool for RAD-seq or other restriction enzyme–based genotyping [11]. There are several tools for post-sequencing analysis for RAD-seq [14]. In contrast, TAS did not have an integrated pipeline freely available. That was one of motivations of our study. TASEQ is the first one-stop pipeline for post-sequencing analysis of genotyping by TAS. TASEQ uses the marker information file output by MKDESIGNER as input (Fig. 2). It allows mapping limited to the target chromosomal region and determination of the marker genotype of each line from the raw sequence data (FASTQ). In genotyping for QTL analysis, it is helpful that genotype files compatible with R/qtl software are output with the ‘taseq_filter’ command (Fig. 2). In addition, the graphical genotypes that can be drawn with the ‘taseq_draw’ command are useful for visually understanding the genotypes of each line (Fig. 5).
MKDESIGNER and TASEQ are command line interface tools, so some knowledge of Linux and file formats used in bioinformatics are required. However, its operation is simple for a wide range of researchers.
Conclusion
MKDESIGNER and TASEQ are useful tools for genotyping by targeted amplicon sequencing (TAS), which is freely available and can be installed via Bioconda. Although MKDESIGNER designs a genome-wide marker set without taking hetero dimers into account, we achieved a success rate that was comparable to that of previous studies. TASEQ is the first one-stop pipeline for post-sequencing analysis of genotyping by TAS. We plan to improve it further by adding more helpful functions.