Article Content
1 Introduction
Oxidative phosphorylation in mitochondria and cytosolic glycolysis are key processes driving the survival and proliferation of cancer cells. The balance between these metabolic pathways significantly shapes cancer metabolism (Gooz and Maldonado 2023). Within the mitochondria, the Krebs cycle plays a central role by generating reduced nicotinamide adenine dinucleotide (NADH), which serves the primary electron donor to the electron transport chain. Flavins, such as flavin adenine dinucleotide (FAD), participate in redox reactions. Additionally, nicotinamide adenine dinucleotide phosphate (NADPH) functions as a critical cofactor for enzymes involved in mitigating oxidative stress, preventing cell aging, and promoting cell survival. In certain cancers, NADPH is indispensable for sustaining cellular proliferation and resisting apoptosis (Cao et al. 2020; Gooz and Maldonado 2023; Hühner et al. 2015; Jones et al. 2018; Meleshina et al. 2017; Qin and Xia 2021).
NADH, NADPH, and FAD exhibit intrinsic autofluorescence, with NADH and NADPH sharing identical excitation and emission spectra. Due to this spectral similarity, their combined autofluorescence is commonly referred to as NAD(P)H (Benninger and Piston 2013; Cao et al. 2020).
The concentrations of NAD(P)H and FAD respond inversely to changes in mitochondrial metabolic states, and the ratio of their fluorescence intensities, termed the metabolic or redox ratio (NAD(P)H/FAD), serves as a crucial indicator of cellular metabolism. This ratio effectively differentiates proliferating, quiescent, and apoptotic cells by correlating metabolic state with cell cycle progression and cell proliferation. Importantly, it enables the study of cancer heterogeneity, the in-situ identification of cancerous versus non-cancerous cells prior to observable morphological changes, and the assessment of chemotherapy responses (Cao et al. 2020; Cicchi et al. 2013; Gooz and Maldonado 2023; Hong et al. 2019; Stringari et al. 2012; Zhuo et al. 2011).
Hong et al. (Hong et al. 2019) demonstrated an increased redox ratio in human colorectal cancer (CRC) tissues, characterized by higher NAD(P)H fluorescence intensity and lower FAD fluorescence intensity in tumor tissues compared to non-tumor tissues. In this study, NAD(P)H and FAD fluorescence emissions were detected by two-photon excitation fluorescence (TPEF) (Hong et al. 2019). Similarly, elevated redox ratios have been reported in other cancers, including breast and bladder cancers, further validating the utility of NAD(P)H/FAD analysis in cancer diagnostics and research (Lukina et al. 2016).
Multiphoton microscopy (MPM) is an advanced imaging technique that enables high-resolution, three-dimensional visualization of tissues. It integrates two powerful modalities: (1) multiphoton non-linear excitation fluorescence, such as TPEF, which facilitates the autofluorescence of intrinsic fluorophores like NAD(P)H and FAD in living tissues; and (2) second harmonic generation (SHG), which detects non-centrosymmetric structures, such as collagen fibers (Benninger et al. 2008; Georgakoudi and Quinn 2023; Helmchen and Denk 2005; Lefort 2017; Sidani et al. 2006; Treacy et al. 2023).
The majority of MPM-based studies on cellular metabolism utilize TPEF to image NAD(P)H and FAD, key indicators of metabolic activity. MPM offers several significant advantages over traditional fluorescence microscopy techniques, providing deeper tissue penetration, minimizing out-of-focus background signal, and reducing photodamage to tissues by confining excitation to the focal point. (Benninger et al. 2008; Georgakoudi and Quinn 2023; Gooz and Maldonado 2023; Helmchen and Denk 2005; Lefort 2017; Rubart 2004; Sidani et al. 2006; Treacy et al. 2023).
The fluorophore emission spectrum remains largely identical for both one-photon and multiphoton excitation because fluorescence emission originates from the same excited electronic state regardless of how the fluorophore is excited (Lakowicz 2006). In contrast, the excitation spectra for one-photon and two-photon excitation differ significantly. Two-photon excitation typically occurs at wavelengths roughly twice as long as those for one-photon excitation, though a slight blue shift and broader peaks are often observed due to differences in energy absorption mechanisms (Benninger and Piston 2013; Lakowicz 2006; Rubart 2004).
NAD(P)H exhibits a one-photon excitation peak at 340 nm and an emission peak at 460 nm, while FAD exhibits a one-photon excitation peak at 450 nm and an emission peak at 525 nm (Benninger et al. 2008; Benninger and Piston 2013; Denk et al. 1990; Lakowicz 2006). Using this data and the relationship between emission and excitation spectra for one-photon and two-photon excitation, the corresponding spectra for two-photon excitation can be estimated. However, the broad excitation spectra of NAD(P)H and FAD, coupled with potential crosstalk when these fluorophores are simultaneously excited, complicates the selection of optimal wavelengths. Reviewing the literature, one notes a wide variability in reported values for the two-photon excitation and emission wavelengths of NAD(P)H and FAD as highlighted in Table 1. Therefore, a careful evaluation is critical to identify the most suitable parameters for the specific application addressed in this study.
The ultimate goal of this work is to integrate TPEF technology into conventional colonoscopy systems to enhance cancer diagnostics. Achieving this goal requires the miniaturization and optimization of the optical components in standard TPEF setups. A key focus is the development and implementation of highly selective optical filters tailored to the fluorescence emission wavelengths of NAD(P)H and FAD.
In our previous work (Freitas et al. 2024), we designed, simulated, and fabricated a highly selective optical filter specifically for detecting NAD(P)H fluorescence using TPEF. Building on that foundation, this study introduces two advanced optical filters engineered for precise simultaneous detection of NAD(P)H and FAD fluorescence emission. Important to notice that the only difference between the fabrication of the NAD(P)H filter and the FAD filter lies in the adjustment of the layer thicknesses to achieve the desired target wavelengths. This work also provides an in-depth analysis of the excitation and emission properties of NAD(P)H and FAD under near-infrared (near-IR) excitation using normal and tumoral tissue phantoms, comparing these findings with conventional one-photon excitation fluorescence methods.
2 Methods
2.1 NAD(P)H phantom
To accurately simulate real tissue conditions in a phantom model, it is essential to determine the NAD(P)H concentration in both normal and cancer colorectal tissues. This information ensures that the phantom closely mimics the biochemical environment of the tissues being studied.
Villette et al. (2006) smeasured the NAD(P)H concentration in normal esophageal cells using microspectrofluorimetry, reporting a value of 90 µM. Given that the esophagus is part of the digestive system, it is assumed that this measurement provides a reasonable approximation for the NAD(P)H concentration in normal colorectal tissue. Additionally, Hong et al. found that the NAD(P)H concentration in colorectal cancer tissues was 1.4 to 1.6 times higher than in normal colorectal tissues (Hong et al. 2019). Therefore, the expected NAD(P)H concentration in colorectal cancer tissues is estimated to range between 126 and 144 µM.
The phantom used in this study consists of NADH (N6005, Sigma-Aldrich) dissolved in a 0.01 M sodium hydroxide solution (Merck 160309) (Sigma-Aldrich Co 2012). To prepare 3 ml (cuvette volume) of this phantom solution, the required mass of NADH [molar mass of 709.40 g/mol (Sigma-Aldrich Co 2012)] was calculated. To achieve a concentration comparable to that in normal tissues, 0.192 mg of NADH is required. For a concentration mimicking colorectal cancer tissues, a mass between 0.268 mg and 0.306 mg of NADH is required. Given this range, 0.268 mg of NADH was the selected mass for the tumoral phantom preparation.
2.2 FAD phantom
Similarly to the NAD(P)H phantom, it is essential to determine the FAD concentration in both normal and cancer tissues.
Zhuo et al. (2011) studied the concentration ratio between FAD and NAD(P)H and concluded that in normal tissues, the FAD concentration is 1.82 times lower than the concentration of NAD(P)H, resulting in a FAD concentration of 49.45 µM. For colorectal cancer tissues, they verified a ratio (FAD/NAD(P)H) of 0.307, leading to an FAD concentration between 38.68 and 44.21 µM (Zhuo et al. 2011).
The phantom solution was prepared using FAD (F6625, Sigma-Aldrich) dissolved in pure water (Sigma-Aldrich Co 2025). To prepare 3 ml (cuvette volume) of this solution, the molar mass of FAD (829.51 g/mol) (Sigma-Aldrich Co 2025) was used to calculate the required mass. To achieve a concentration representative of normal tissues, 0.123 mg of FAD was required. For a concentration representative of colorectal cancer tissues, a FAD mass range between 0.096 mg and 0.110 mg is obtained. Based on this, a mass of 0.096 mg was chosen.
2.3 NAD(P)H and FAD phantom
Using the concentrations of NAD(P)H and FAD in normal and colorectal cancer tissues estimated in the previous section, normal and cancerous phantoms were assembled containing both compounds.
To prepare a phantom mimicking the normal tissue conditions, 0.123 mg of FAD was dissolved in 0.5 ml of pure water. Separately, 0.192 mg of NADH was dissolved in 0.5 ml of a 0.01N sodium hydroxide solution. Then, the two solutions were combined, followed by the addition of 2 ml of pure water.
To prepare a similar phantom but mimicking colorectal cancer tissue conditions, the same procedure was followed, using 0.096 mg of FAD and 0.268 mg of NADH.
2.4 Two-photon fluorescence setup
The TPEF measurements were carried out using the same experimental setup that is presented by Freitas et al. in (Freitas et al. 2024) and schematized in Fig. 1. The phantom was placed in a cuvette and inserted into the piezo-controlled translation stage. The cuvette position was adjusted to maximize the intensity of the fluorescence signal. The fluorescence signal was acquired using the following protocol. A Ti:Sapphire mode locked laser (Mira 900-F, Coherent Inc.) excited the phantoms with an average incident power of 100 mW or 150 mW. The laser operated at a 76 MHz repetition rate and the full-width half maximum pulse duration was roughly 120 fs at the focus. The fluorescence was collimated and then focused into an optical fiber bundle connected a 0.3-m imaging spectrograph (Andor, Shamrock) and detected using a cooled CCD camera (Andor, Newton). The CCD signal was integrated for 30 or 60 s; the background signal was subtracted from the acquired fluorescence spectra, followed by an algorithmic filtering process to remove sharp peaks caused by cosmic rays; lastly, a Savitzky Golay filter was applied to further smooth the high-frequency noise present in the signal.
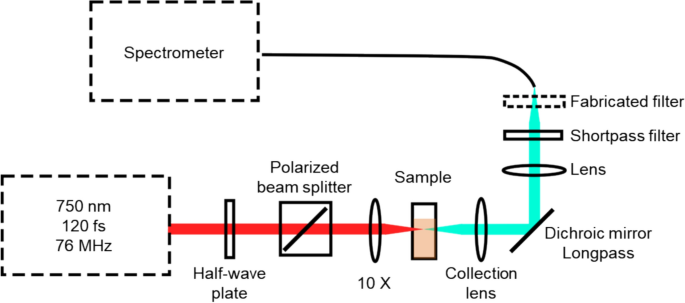
TPEF setup layout. The transmission axis of the polarized beam splitter is aligned vertically in this schematic
3 Experimental data
3.1 One-photon excitation spectrum
In an initial test, the one-photon excitation spectra of FAD and NAD(P)H phantoms were studied. Two different phantoms were prepared, one with FAD at normal tissue concentration and another with NAD(P)H at normal tissue concentration. Both phantoms were placed in a cuvette, and the test was conducted using a Shimadzu UV 3101PC spectrometer. The obtained results are presented in Fig. 2.
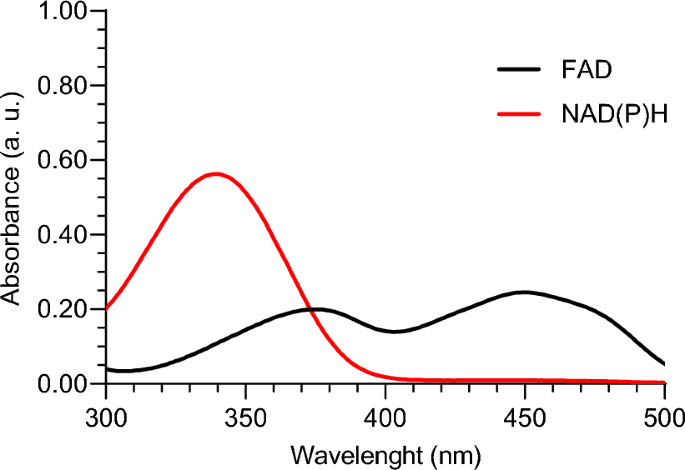
One-photon excitation spectra of FAD and NAD(P)H phantoms
From this study, we conclude that for one-photon excitation, a wavelength in the 300–400 nm range is necessary to successfully excite both FAD and NAD(P)H simultaneously. Since the goal of this work is to achieve excitation using two-photon excitation, we can extrapolate that a wavelength in the 600–800 nm range would be required for two-photon excitation. As discussed in the Introduction section, this is an approximation, as the two-photon excitation spectrum is not exactly double that of the one-photon excitation spectrum.
3.2 One-photon emission spectrum
The one-photon emission spectra of FAD and NAD(P)H phantoms were analyzed to investigate their fluorescence behavior at different excitation wavelengths. Given that the mode-locked Ti:sapphire laser (Mira 900-F, Coherent Inc.), later used for two-photon fluorescence excitation, is tunable between 700 and 900 nm with peak performance near 800 nm, we selected 400 nm as an excitation wavelength for the one-photon fluorescence study. This choice ensures compatibility with the laser’s optimal operating range for two-photon excitation. Additionally, we included excitation at 375 nm, as this wavelength aligns with a region where both fluorophores exhibit similar absorbance (see Fig. 2). This selection allows for efficient two-photon excitation at 750 nm (double the 375 nm wavelength) while maintaining strong laser output power.
For this study, the phantoms were placed in a cuvette and the test was carried out in a SPEX Fluorolog 2 Fluorescence Spectrometer. The obtained results are presented in Fig. 3a and b.
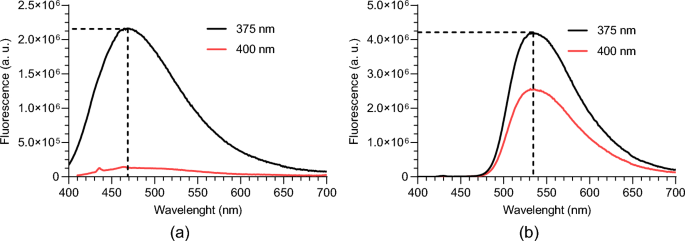
One-photon emission spectrum for 375 nm and 400 nm excitation wavelengths of: a NAD(P)H; b FAD
As expected from the excitation spectrum, at 400 nm of excitation wavelength the FAD emission reduces, and in the NAD(P)H phantom, the emission is almost inexistent. So, we can conclude that to see the emission of the two solutions with the same excitation wavelength the value for one-photon excitation should be 375 nm. This will correspond to a two-photon excitation wavelength of around 750 nm.
The emission peak is approximately 470 nm for NAD(P)H and 535 nm for FAD. These values are consistent with those reported in the literature, where the emission peak for the NAD(P)H is 460 nm and for FAD is 525 nm (Benninger et al. 2008; Benninger and Piston 2013; Denk et al. 1990; Lakowicz 2006).
To capture the fluorescence emission of both fluorophores individually while minimizing crosstalk between them, we conclude that two-band pass optical filters are crucial in the detection system. This approach ensures a strong signal for the target fluorophore, while the signal from the other fluorophore is sufficiently attenuated, reducing interference in the acquired data.
4 Results and discussion
4.1 Two-photon emission spectra (different wavelengths at excitation)
Since the behavior of a fluorophore differs between one-photon and two-photon excitation, a similar test using two-photon excitation was conducted to validate the conclusions from the initial experiment and to investigate the differences between the two excitation methods.
4.1.1 NAD(P)H
The two-photon fluorescence spectrum of a normal tissue NAD(P)H phantom was measured and is shown in Fig. 4a. For this test, an average incident power of 100 mW, an integration time of 60 s, and two different excitation wavelengths were used: 800 nm and 750 nm. The full-width half-maximum bandwidth of the incident laser was slightly greater than 10 nm in each case.
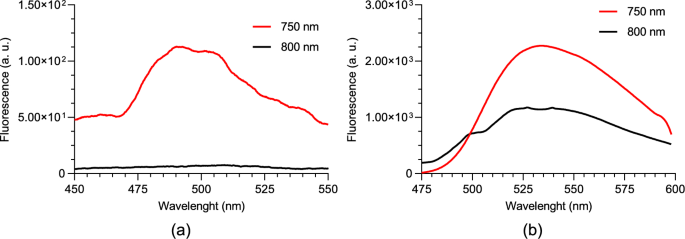
Two-photon fluorescence spectrum for 750 nm and 800 nm excitation wavelengths of; a NAD(P)H; b FAD
The fluorescence spectrum differs from that observed in one-photon fluorescence. Particularly, the peak emission in the two-photon fluorescence is around 490 nm, compared to approximately 470 nm in one-photon fluorescence.
The behavior observed with one-photon fluorescence for the two different excitation wavelengths is also confirmed in the two-photon fluorescence experiments. With an excitation wavelength of 750 nm, fluorescence is detectable, whereas shifting the excitation to 800 nm results in a barely detectable signal.
4.1.2 FAD
The two-photon fluorescence spectrum of a normal tissue FAD phantom was measured and is shown in Fig. 4b. As in the NAD(P)H experiment, an average incident power of 100 mW, an integration time of 60 s, and two different excitation wavelengths were used: 800 nm and 750 nm. The full-width half-maximum bandwidth of the incident laser was slightly greater than 10 nm in each case.
The fluorescence spectrum is similar to the observed in one-photon fluorescence. Particularly, the peak emission in the two-photon fluorescence and one-photon fluorescence is around 535 nm.
The behavior observed with one-photon fluorescence for the two different excitation wavelengths is also confirmed in the two-photon fluorescence experiments. With an excitation wavelength centered at 750 nm, fluorescence is stronger than when exciting at 800 nm.
4.1.2.1 Comparison between NAD(P)H phantom and FAD phantom at 750 nm excitation
Figure 5 presents the two-photon fluorescence spectra of normal tissue NAD(P)H and FAD phantoms, excited at 750 nm with an average incident power of 100 mW, integrated during 60 s, and normalized to their respective maximum intensities. As previously discussed, the results show that the emission peaks occur at 490 nm for NAD(P)H and 535 nm for FAD. At the NAD(P)H emission peak, the intensity of FAD is approximately 15% of its maximum, while at the FAD emission peak, NAD(P)H reaches about 50% of its maximum intensity. Notably, Fig. 4a and b reveal that the maximum emission intensity of FAD is approximately 15 times higher than that of NAD(P)H. This indicates that NAD(P)H contributes minimally at the FAD emission peak, whereas FAD significantly contributes at the NAD(P)H emission peak. To address this overlap, a filter was designed with a peak transmittance at 535 nm to optimize detection for FAD. For NAD(P)H, a filter with peak transmittance at 485 nm, just below its emission peak, was selected. This configuration allows for nearly maximal NAD(P)H emission while reducing the FAD contribution to just 10% of its maximum intensity.
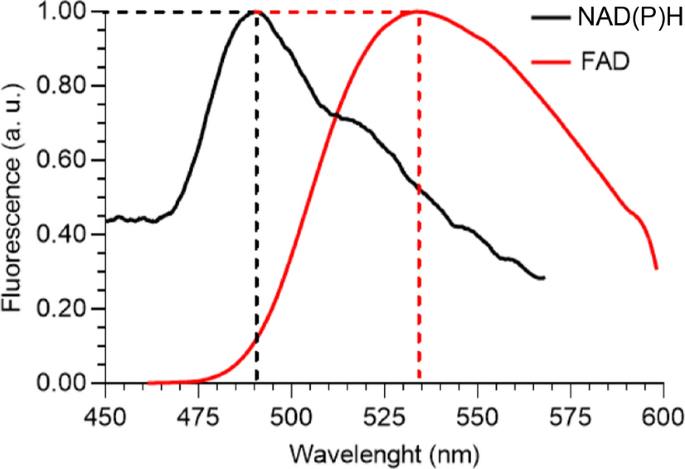
Normalized two-photon fluorescence spectra of NAD(P)H and FAD, for 750 nm excitation wavelength. Note the normalization is different for the two spectra and in absolute terms the FAD spectral peak is roughly 15 times greater than the NAD(P)H spectral peak
As referred before, the simulation, optimization, and fabrication of the optical filters are described in detail in Freitas et al. in 2024 (Freitas et al. 2024). This reference only focuses on the NAD(P)H optical filter, but an analogous procedure was carried out to fabricate the FAD filter.
4.2 Two-photon emission spectra (with vs without filter)
Figure 6a and b demonstrate the performance of the fabricated filters. The signals were acquired from normal tissue NAD(P)H and FAD phantoms, with an average incident power of 100 mW and an integration time of 60 s. As expected, the curves show that the filters exhibit peak transmittance near the desired wavelengths, while the intensity at other wavelengths is significantly reduced. Although the filters are not perfect, and the peak transmittance does not reach 1, the loss of intensity at the target wavelengths is minimal and does not significantly impact the performance. The difference in the FWHM values between the two filters arises from constraints in the fabrication process, specifically variations in the thicknesses and refractive indices of the thin-films.
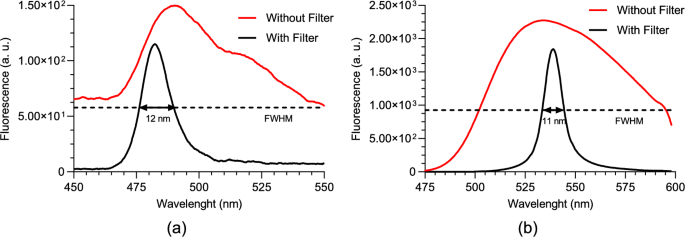
Two-photon fluorescence spectra for 750 nm excitation wavelength, without and with the fabricated optical filter of: a NAD(P)H; b FAD
4.3 Two-photon emission spectra (normal vs tumoral)
After selecting the excitation wavelength and emission filters, and confirming their performance, the next step is to evaluate the filters’ ability to distinguish between normal and tumoral phantoms. Initially, NAD(P)H and FAD phantoms with normal and tumoral concentrations were tested individually, followed by tests using phantoms containing both fluorophores simultaneously.
4.3.1 NAD(P)H
Two NAD(P)H phantoms were used, one representing a normal concentration and the other a tumoral concentration. Each phantom underwent two separate tests using our custom two-photon optical setup. Both tests were performed under an average incident laser power of 150 mW, and the signal was integrated for 60 s. The results are displayed in Fig. 7, with each curve representing the mean of 3 runs.
Two-photon fluorescence spectra of normal and tumoral NAD(P)H phantoms, for 750 nm excitation wavelength and with the fabricated optical filter
From the curves shown in Fig. 7, a clear distinction between the normal and tumoral phantoms is evident. As expected, the tumoral phantom exhibits a higher fluorescence intensity due to its elevated NAD(P)H concentration compared to the normal phantom.
4.3.2 FAD
Two FAD phantoms were used, one with normal concentration and the other with tumoral concentration. As in the previous result, each phantom underwent two tests using our custom two-photon optical setup, both tests were performed under an average incident laser power of 150 mW, and the signal was integrated during 60 s. The results are shown in Fig. 8 with each curve representing the mean of 3 runs.
Two-photon fluorescence spectra of normal and tumoral FAD phantoms, for 750 nm excitation wavelength and with the fabricated optical filter
The curves in Fig. 8 reveal a clear distinction between the normal and tumoral phantoms. As expected, the normal phantom shows higher fluorescence intensity, consistent with its higher FAD concentration compared to the tumoral phantom. It is possible to observe some differences between the curves obtained from the tumoral phantom. These differences may be attributed to slight variations in the setup alignment between the two measurements.
4.3.3 NAD(P)H + FAD
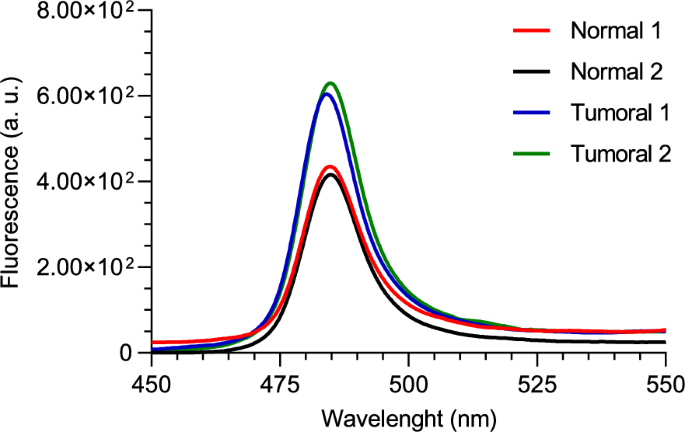
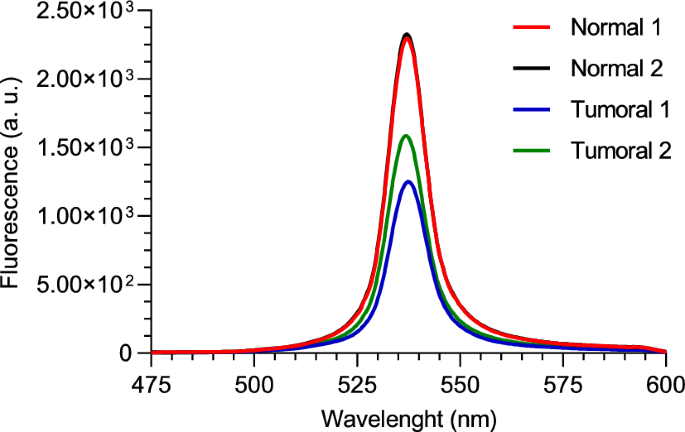
Given the crosstalk between the two fluorophores and the fact that both are present simultaneously in real tissues, it is important to determine whether the differences observed in the previous tests can still be distinguished when both fluorophores are present together. To investigate this, two phantoms containing both NAD(P)H and FAD, with normal and tumoral concentrations, were used for this test. Each phantom underwent three separate tests using our custom two-photon optical setup. Both tests were performed under an average incident laser power of 150 mW, and the signal was integrated for 30 s. The results are displayed in Fig. 9a and b, with each curve representing the mean of 3 runs. From the analysis of the figures, it can be concluded that even when both fluorophores are present at the selected wavelengths, differences between the two phantoms can still be observed. In Fig. 9a, the tumoral phantom exhibits more intense fluorescence compared to the normal phantom. This difference is due to the higher concentration of NAD(P)H in the tumoral phantom, which emits more strongly around 485 nm. The long rising red-shifted tail is due to the combination of cross talk from the FAD excited in the phantoms and out-of-band transmission of the fabricated 485 nm filter. Conversely, in Fig. 9b, the normal phantom displays greater fluorescence intensity at 530 nm. This result is attributed to the higher concentration of FAD in the normal phantom, which emits prominently at this wavelength.
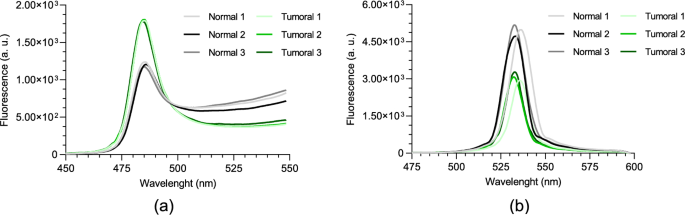
Two-photon fluorescence spectra of normal and tumoral NAD(P)H + FAD phantoms, for 750 nm excitation wavelength with: a 485 nm band-pass filter; b 530 nm band-pass filter
A peak shift is observed in one of the spectra in Fig. 9b. This is likely caused by slight variations in phantom positioning and setup alignment during measurements. Since the system is custom-built and manually adjusted, small differences in cuvette placement can affect the detection path, and because the optical filters were fabricated on a large substrate to allow easy integration into the optical setup, minor non-uniformities in thin-film thickness may occur. As a result, different regions of the filter can have slightly different peak transmittance wavelengths, leading to small spectral shifts when the signal passes through different areas.
4.3.4 Redox ratio
An important step toward enabling the automated classification of normal and tumoral tissues using the fabricated optical filters is the evaluation of the redox ratio derived from the fluorescence curves presented in Sect. 4.3.3. The redox ratio, a widely metabolic marker in tissue diagnostics, is defined in Eq. (1) (Hong et al. 2019).
To calculate the redox ratio, the fluorescence intensity was integrated across the full emission spectrum for each curve. This method provides a comprehensive and robust estimate of the total contribution of each fluorophore. Importantly, this approach is not limited to spectrometer-based systems, it can also be readily applied to setups employing broadband detectors, such as photomultiplier tubes, thereby extending its applicability across different optical detection platforms.
The calculated redox ratios for both normal and tumoral phantoms are shown in Fig. 10, with the corresponding mean and standard deviation values summarized in Table 2.
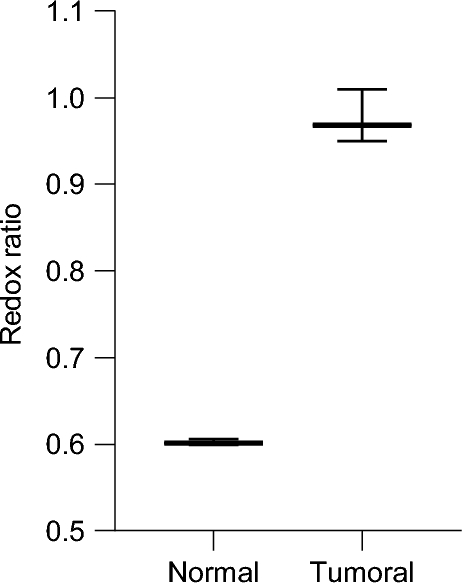
Redox ratio for normal and tumoral phantoms calculated from integrated fluorescence signals
As is possible to see in Fig. 10 and Table 2, there is a notable difference between the redox ratios of the normal and tumoral phantoms. As expected, the tumoral phantom exhibits a higher redox ratio, reflecting its higher concentration of NAD(P)H and a lower concentration of FAD compared to the normal tissue phantom. This finding aligns with previously reported observations in cancer metabolism studies, where elevated NAD(P)H/FAD ratios have been linked to increased glycolytic activity and cellular proliferation (Hong et al. 2019).
Despite some spectral overlap and the presence of a red-shifted tail in the 485 nm filter measurements due to FAD emission, the calculated redox ratios remain robust. The fabricated filters effectively minimize this crosstalk, enabling reliable quantification. These results confirm that the optical system, even in its current prototype form, is capable of supporting meaningful metabolic measurements and distinguishing between tissue states based on intrinsic fluorescence.
This analysis demonstrates strong potential for using these filters and wavelengths in future miniaturized diagnostic systems for colorectal cancer detection, where the redox ratio could serve as an autonomous metric for tissue classification. These filters are an essential part for the miniaturization of optical components and for introducing TPEF technology into colonoscopy systems. The compact multilayer dielectric filters presented here are suited for integration into miniaturized optical systems. Their thin-film structure, custom spectral selectivity, and compatibility with small holders or fiber optic assemblies make them advantageous for space-constrained environments. Furthermore, the ability to fabricate such filters with high spectral precision supports their application in multi-channel fluorescence detection, which is an important factor in the analysis of colorectal tissues, as seen in the analysis of the redox ratio of normal and tumoral phantoms.
5 Conclusion
We have presented an innovative approach to improving colorectal cancer detection by integrating TPEF with highly selective optical filters for NAD(P)H and FAD fluorescence. The custom-designed filters effectively minimize signal interference between these fluorophores, enabling accurate differentiation between normal and cancerous tissues phantoms. Experimental results demonstrate that the filters’ optimal peak transmittance wavelengths (485 nm and 535 nm) and excitation wavelength (750 nm) successfully excite the target fluorophores, allowing for clear detection of concentration differences between normal and cancerous tissue phantoms. The analysis of the redox ratio in phantoms containing NAD(P)H and FAD revealed a clear distinction between tumoral and normal samples, confirming the potential of these filters for colorectal cancer research in miniaturized systems. It is also important to note that the phantoms used in this study only considered the NAD(P)H and FAD fluorescence characteristics of tissues to facilitate signal detection and validate the optical filters used in a TFEF experimental setup. Future studies can employ more robust phantoms that also replicate tissue absorption and scattering properties to mimic a real scenario application.
These findings highlight the potential of incorporating TPEF into conventional colonoscopy for early cancer diagnosis, with significant implications for improving patient outcomes. Future research should focus on further miniaturizing the TPEF system to facilitate its clinical implementation and enhance fluorescence detection specificity in complex tissue environments.