Article Content
1 Introduction
Supercontinuum generation (SCG) is a nonlinear optical phenomenon occurring when ultrashort, intense (high-power) optical pulses propagate through a nonlinear medium. It is generated through the interplay of a series of linear and nonlinear optical effects that act together on the input pulses, and cause the bandwidth of the output pulses to experience a spectral broadening (Dudley et al. 2006; Agrawal 2013). In linear effects, such as dispersion and attenuation, the wave intensities can be amplified or attenuated. In the case of high intensity light, the material starts behaving in a non-linear way, and new frequencies can be generated, which change the spectrum of the laser pulse. So, to successfully generate supercontinuum (SC) spectrum in optical waveguides, we need to pump very short (femtosecond) and high peak power laser pulses. For these ultrafast and ultra-high pulses, a dramatic spectral broadening takes place even over short propagation distances (Dudley et al. 2006; Agrawal 2013).
SCG was observed for the first time in 1970 when Alfano and Shapiro powered picosecond pulses through a bulk borosilicate glass (Alfano and Shapiro 1970). They demonstrated the generation of visible SC (400 to 700 nm bandwidth) achieved by pumping peak power of 5 mJ with picosecond duration pulses at 530 nm. Since then, a number of waveguides have been proposed for the SCG like bulk media, conventional fibers and Photonic Crystal Fibers (PCFs) (Dudley et al. 2006). For conventional fibers, the generation of SCG between with femtosecond pulses duration has been reported (Islam et al. 1989). Also, SCG ranging from by a mode-locked femtosecond laser has been demonstrated using a highly nonlinear single mode fiber (SMF) (Nicholson et al. 2004). However, the use of PCFs gives us the better performance due to their features and design characteristics freedom. We can realize smaller core size and smaller effective core area which increase nonlinearity. This nonlinearity plays the most important role for the SCG phenomena, and the higher its value, the lower value of the threshold power is required (Dudley et al. 2006; Ranka et al. 2000). Also, it allows group velocity dispersion (GVD) to be tailored to maximize SCG for a given pump wavelength and to be observed over a much wider range of wavelengths. SCG in PCF was demonstrated for the first time in 1999 by Ranka et al., they reported that the PCF can exhibit anomalous dispersion at visible region and obtained an ultrabroadband continuum generation from 400 to 1600 nm by injecting a femtosecond pulse into a 75 cm section PCF (Ranka et al. 2000).
The SCG has been studied in various nonlinear media like glasses, liquids, gases and crystals. For example, a mid-infrared (MIR) SCG has been achieved in ZBLAN fluoride fibers out to 4.5 µm with nanosecond laser pumping (Xia et al. 2006). Fluoride materials have the lowest attenuation coefficients in MIR fibers region (2–5 µm) (Xia et al. 2006). Also, being an effective excitation source due to stimulated emission, the rare-earth-doped fiber amplifiers (e.g. ytterbium) have been demonstrated for SCG (Schreiber et al. 2003). The highly nonlinear tellurite materials have also been used in SCG, demonstrating over 4000 nm bandwidth for an 8 mm length of PCF (Domachuk et al. 2008). Another SCG of 700 nm (900–1400 nm) is achieved in liquid-filled PCF (Tian et al. 2015). Raei et al. also demonstrated broadband SCG in a 1 cm long organic liquid–liquid core–cladding PCF, achieving a 2 µm wide spectrum (0.5–2.5 µm) using 50 fs pulses at 1032 nm and 1560 nm with 10 kW peak power (Raei et al. 2018). Ebnali-Heidari et al. also reported a low-noise SCG source spanning 1.2–1.8 µm using a tellurite MOF pumped at 1.55 µm with 100 fs pulses (Ghanbari et al. 2017).
The chalcogenide Glasses which are among the most nonlinear materials acquired an increasing interest for SCG. These glasses are based on chalcogens (S, Se and/or Te) elements and can be associated with other elements like germanium and arsenic to increase stability and robustness for fiber fabrication (Dantanarayana et al. 2014). They combine Kerr nonlinearities up to about 1000 times larger than that of fused silica. This enables nonlinear optical processes to occur over significantly shorter length and lower powers than in silica-based materials. Also, compared to silica, which has an exponentially increasing loss for wavelengths beyond 2.5 μm, chalcogenides have relatively constant loss over a wide transmission window up to 10 μm (Sanghera et al. 2008; Pureza et al. 2006). A coherent SCG spanning 2–5 µm in PCF has been reported by P. Yan et al. (Yan et al. 2013), achieved by pumping 50 fs duration pulses with 610 W peak power in 2 cm length of fiber. Another all-normal dispersion fibers (ANDi) coherent MIR SCG from 2.2 to 3.3 µm was demonstrated in by pumping at a wavelength of 2.7 µm through 2 cm of multi-material fiber (Liu et al. 2016). A flat, coherent MIR SCG (2.9–4.57 µm) was reported in PCF, achieved by launching 50 fs optical pulses with 0.88 kW peak power at a central wavelength of 3.7 μm through a 5 cm long fiber(Diouf, et al. 2017). In another study, Saghaei et al. demonstrated ripple-free MIR SCG spanning from 3.0 to 6.86 µm in a hybrid As₂Se₃–As₂S₃ PCF, pumped with 50 fs pulses at 4.6 µm and 10 kW peak power (Saghaei et al. 2015). Additionally, Saghaei (Saghaei 2018) reported an MIR SCG spanning from 3.6 to 13.9 µm in MOF-B by pumping 100 fs pulses at 6.2 µm with a peak power of 2 kW, generated within a 10 cm-long MOF. This performance was achieved through dispersion engineering using -filled structures. Kalantari et al. reported an ultra-wide MIR SCG from 1 to 10 µm using a 10 mm PCF filled with PBG-08 glass rods, pumped with 100 fs pulses at a central wavelength of 2.5 µm and peak power of 20 kW, demonstrating ripple-free broadening suitable for molecular fingerprinting applications (Kalantari et al. 2018).
The SCG has attracted considerable research due to its variety of applications in different fields, such as optical metrology, frequency comb generation for precise measurement of optical frequencies, MIR SCG for spectroscopy, optical coherence tomography (OCT) for biomedical imaging, and wavelength division multiplexing (WDM) communication systems (Hartl et al. 2001; Holzwarth et al. 2000; Diddams et al. 2000; Washburn et al. 2004; Guo et al. 2021; Udem et al. 2002; Fercher et al. 2003; Petersen et al. 2018; Takara et al. 2000). In this work we generate our SCG spectrum to be used in telecommunications optical bands O-, E-, S-, C- and L-bands from 1260 to 1640 nm for WDM applications like CWDM and DWDM. WDM refers to a technology that allows multiple optical signals at multiple channels to transmit over one optical fiber. WDM technology is essential to utilize the huge bandwidth resources of optical fibers. The generated SCG spectrum can be demultiplexed and separated into multiple signal channels using well know optical multiplexer and demultiplexer techniques. These techniques include optical filters like thin film filters (TFF) and arrayed waveguide gratings (AWG). The AWG supports many multiplexed channels with 50/100 GHz channel spacing complies with the ITU-T G.698.1 standard, making it very suitable for both even and odd large-capacity DWDM systems (G.694.1.: Spectral grids for WDM applications: DWDM frequency grid. Available from: https://www.itu.int/rec/T-REC-G.694.1/en; G.698.1.: Multichannel DWDM applications with single-channel optical interfaces. Available from: https://www.itu.int/rec/T-REC-G.698.1-202306-I/en). The WDM technology also simplify the networks; adding and dropping various services can be achieved by simply adjusting the wavelengths of the corresponding optical signals.
In our proposed design, we select the PCF core material to be made of chalcogenide glass . For numerically investigating the PCF optical parameters, the structure simulation was implemented in COMSOL multiphysics using a full-vectorial finite element method (FEM) associated with the perfectly match layer (PML) circular boundary condition for ensuring near zero reflection (COMSOL Multiphysics software Version 5.5. Available from: https://www.comsol.com/). Also, we consider the generalized nonlinear Schrödinger equation (GNLSE) for pulse propagation modelling inside the PCF. This equation doesn’t have any analytical solution and usually it has to be solved by a numerical method called split-step Fourier method (SSFM). In this work, we employed a faster integration procedure, which is called the fourth-order Runge–Kutta in the Interaction Picture (RK4IP). This model is related to the SSFM and was first developed for the study of Bose–Einstein condensates (Hult 2007; Rieznik et al. 2012). The GNLSE-based supercontinuum generation (SCG) simulations were implemented in MATLAB.
2 Design and theory
The refractive index of chalcogenide glass medium which is wavelength dependent, is calculated using Sellmeier equation (Dantanarayana et al. 2014):
where and are dimensionless coefficients; are the material resonant wavelengths, λ is wavelength, and is the number of resonance terms. For the Sellmeier model, two terms and are sufficient to accurately represent the refractive index of chalcogenide glass across this transparent window. The coefficient is associated with the optical bandgap absorption in visible/near-infrared regions, whereas is associated with vibrational band resonant absorption in the far-infrared region. The values obtained for the coefficients are (Dantanarayana et al. 2014): , , , μ and μ. The refractive index of the air holes is set to 1.
2.1 The generalized nonlinear Schrödinger equation (GNLSE)
Understanding the media in which the supercontinuum is generated is essential for simulating the supercontinuum formation. The time-domain GNLSE (Agrawal 2013, 2000; Blow and Wood 1989) can be used to characterize the impact of both linear and nonlinear effects on the envelope of the electric field of an optical pulse traveling along the optical fiber as following:
where is the electric field amplitude, is the electric field envelope in spatial position z and in time t, is the dispersion coefficient at the central frequency , is the nonlinear coefficient, is the Raman response function and is the attenuation coefficient of the fiber. Equation (2) can also be written in the frequency domain , where:
The first two terms on the right-hand side of Eq. (2) take into account the linear propagation effect. The first term represents the power losses (attenuation) in the fiber as the light travels through it. For SCG applications, the length of the used fiber is very small, so these losses can be neglected in the numerical simulation . The second term is related to the chromatic dispersion. The propagation constant varies with the refractive index , and the angular frequency of light . We can understand it using the Taylor expansion of the propagation constant , as a function of the angular frequency , around center frequency . It can be mathematically expressed as (Agrawal 2012):
and,
where represents the higher order dispersion coefficients. We often use the dispersion coefficient in in place of with optical fiber. It is related to by Allam et al. (2024):
where is the speed of light and is the effective refractive index of the PCF. The nonlinear coefficient, , can be calculated by the following equation (Agrawal 2012; Allam et al. 2024):
The effective mode area in μ can be calculated from the following equation (Namihira 1994):
where is the electric field distribution of the fundamental mode in the fiber, is the nonlinearity index that can be estimated for the chalcogenide glass medium from Kramers–Kronig transformation equation (Yuan 2013; Slusher et al. 2004):
where is the anion–cation bond length of the bonds (can be estimated to be ), is the Sellmeier gap (4.1 eV), is the refractive index of the (calculated from Eq. (1)), is the photon energy, is the band gap energy for (1.78 eV), and is the Kerr coefficient dispersion function (Yuan 2013). From Eq. (9) we calculate the nonlinear index at a wavelength of 2.8 µm, and at a wavelength of 1.45 µm. That is much higher than the nonlinear index of which is about at 1.55 µm (Le et al. 2021a). The fourth term is the total response function of the medium including the instantaneous electronic and the vibrational Raman contributions (Blow and Wood 1989; Salem, et al. 2011):
where is Dirac delta function that defines instantaneous electronic response, and the is the fractional contribution of the delayed Raman response function From Kramers-Kroning relation, the fraction can be estimated to be about 0.148 (Cherif and Zghal 2013). The delayed Raman response is specified according to experimental attempts and expressed through the Green’s function of the damped harmonic oscillator (Stolen et al. 1989):
where and are two adjustable parameters and are chosen to provide a good fit to the actual Raman-gain spectrum. The values of and are specified to be 23 fs and 164.5 fs respectively (Cherif and Zghal 2013). The Raman response function Eq. (11) is depicted in Fig. 1a for both silica and chalcogenide materials. It shows that the chalcogenide glass has a temporal Raman response longer than silica. The function is related to the Raman gain spectrum by Kärtner et al. (1994):
where is the pump frequency and is the imaginary part of the Fourier transform of . The Raman gain spectrum is depicted in Fig. 1.(b) for both silica and materials. The silica has a very broad spectrum spreading up to 40 THz with a peak value obtained approximately at 13.2 THz (Agrawal 2013), which is greater than that of glass (≈ 6.9 THz) (Salem, et al. 2011).
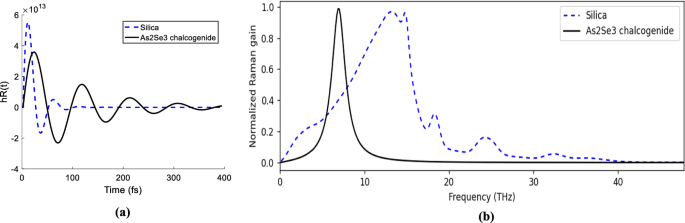
a Raman response functions variation with time and b the corresponding normalized Raman gain spectra of silica (dashed line) and chalcogenide (solid line), showing silica’s broader and higher-frequency peak near 13.2 THz compared to ‘s peak at 6.9 THz
The input pulse propagating along the fibers can be described with an ideal Gaussian pulse or a squared hyperbolic secant (sech) function without any chirp as
where, represents the peak power of the incident pulse, is soliton order of the input source pump, and is the pulse duration and related to (Full width at half maximum) of the pulse as
The soliton order is equal to:
where is the dispersion length and is equal to , and is the nonlinear length and is equal to . During propagation, the nonlinear effects dominate if , while the linear dispersive effects dominate if . The pulse width and peak power can be adjusted so that , for (or D > 0), and the soliton order . This case is known as the fundamental soliton, which happens at the proper balance between linear dispersion and nonlinear self-phase modulation (SPM). In this case, the power distribution does not change during the pulse propagation, so it can be employed in long haul digital transmission systems (Manukure and Booker 2021).
2.2 The proposed PCF design
Figure 2 displays the proposed PCF’s cross-section. The microstructured cladding is composed of six rings of circular air holes forming a hexagonal lattice in a chalcogenide () glass background. The geometric parameters are the air hole diameter (d), and a constant pitch (μ) for hole-to-hole spacing.
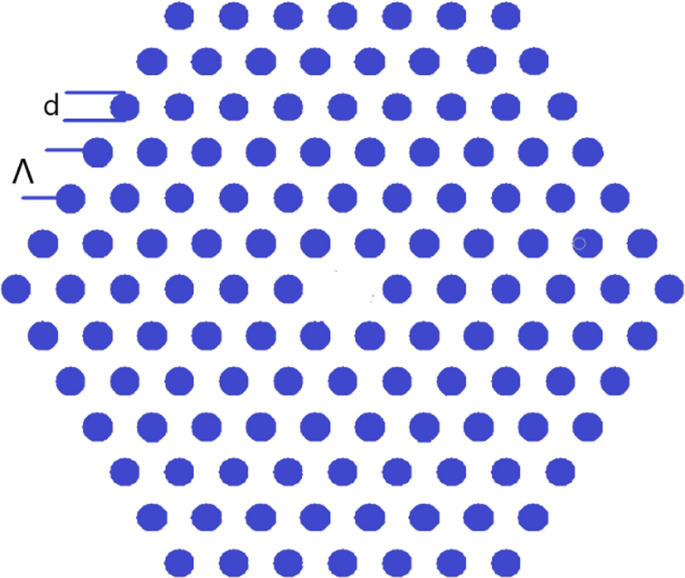
The purposed structure of the hexagonal PCF
3 The numerical simulation and analysis
3.1 The ANDi and anomalous regimes
The SCG spectral broadening should consider the dispersion value. Two dispersion regimes exist: (a) the standard dispersion regime or the All-Normal Dispersion (ANDi) for > 0, or (D < 0), and (b) the anomalous dispersion regime for < 0, or (D > 0), our design can be engineered to work and considering SCG in both regimes. In the anomalous dispersion regime, supercontinuum generation (SCG) is primarily governed by soliton-related phenomena, such as soliton fission, Raman soliton self-frequency shifting (SSFS), and dispersive wave (DW) generation. These effects typically enable broader spectral bandwidths. However, they are also highly sensitive to input noise, pulse fluctuations, and dispersion variations, which can result in degraded coherence and spectral instability (Dudley et al. 2006). By contrast, the all-normal dispersion (ANDi) regime enables SCG through deterministic nonlinear processes like self-phase modulation (SPM) and optical wave breaking (OWB), which do not rely on soliton dynamics (Heidt et al. 2011). This makes the output spectrum smoother and significantly more coherent (Heidt 2010). The ANDi regime thus supports flat-top supercontinuum profiles with low amplitude and phase noise, which is especially advantageous in coherence-critical applications such as optical coherence tomography (OCT), coherent anti-Stokes Raman scattering (CARS), frequency comb generation, and MIR wavelength-division multiplexing systems (Hartl et al. 2001; Holzwarth et al. 2000; Diddams et al. 2000; Washburn et al. 2004; Guo et al. 2021; Udem et al. 2002; Fercher et al. 2003; Petersen et al. 2018; Takara et al. 2000). In these applications, spectral flatness and temporal coherence are essential for high-resolution imaging, precise multiplexing, and signal integrity across wide bandwidths.
3.2 The numerical results
The variation in the effective refractive index in accordance to the wavelength of the proposed design fiber is plotted in Fig. 3a. It is shown that as the wavelength increases, decreases. This indicates that at higher wavelengths the confined power inside the core decreases and the confinement loss increases. Figure 3b shows the dispersion curves as a function of wavelength. For the hole diameter the chromatic dispersion curve is in the all normal flat-top (ANFT) regime. By adjusting the pitch (Λ) and the air hole diameter so that , a flat chromatic dispersion profile in the anomalous dispersion region, with two Zero Dispersion Wavelengths (ZDW). The two ZDW numbers are important for the anomalous dispersion regime to maximize the generated bandwidths of the SCG. We pump pulses with sufficient power and choose the optimized pump wavelength () of each structure to be close to the ZDW. This is to achieve the solitonic fission and remove the effect of four-wave mixing and amplification of higher-order dispersive waves (Cherif and Zghal 2013), as well as to reduce the temporal walk-off effect at the time of spectral boarding process (Yuan 2013).
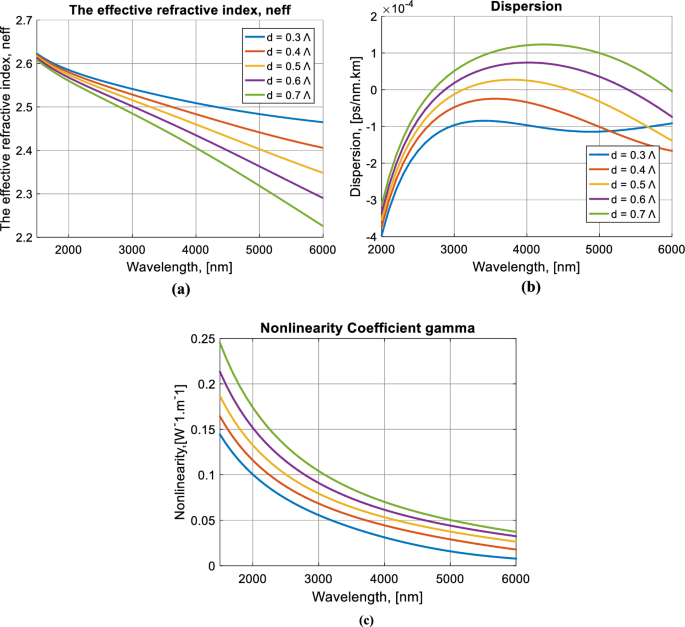
The variation of a the effective refractive index, b the chromatic dispersion, and c the nonlinearity in accordance to wavelengths for the proposed design (Λ = 2 µm)
We investigate and compare the SCG in 2 cm length of the PCF in both ANDi and anomalous regimes. The properties of SCG are sensitively dependent on both fiber and pump source parameters. We start our study by selecting these parameters in the anomalous regime (PCF A, d = 0.7 µm) and ANDi regime (PCF B, d = 0.3 µm). We consider an optical hyperbolic secant initial pumping pulse, as described by Eq. (13). For the two regimes, we set a pump wavelength λ to 2.8 µm very close to the ZDW with a total power of 10 kW and time duration of 28.4 fs. We can obtain these optical pulses by employing MIR femtosecond laser fiber system (Anashkina et al. 2016). Both structures are summarized in Table 1. Also, the Taylor series expansion (the coefficients) computed at the operating wavelength () are shown in Table 2. We will study the femtosecond pulse propagation and SCG in the proposed PCF through the GNLSE given by Eq. (2).
Figure 4a shows the differences between the SCGs generated in ANDi and anomalous regimes. Also, the evolution of the output SC spectrum over a different length of 0.1, 0.3, 1, 5 and 20 mm is depicted in b. As we see, the anomalous regime often allows a broader spectrum in comparison with the ANDi regime. The anomalous regime goes from 1.6 μm up to 7.8 μm in the MIR, and exhibits strong fluctuations even with small propagation lengths. In contrast, the ANDi regime generates high flatness SC spectra and smooth profile in the MIR range extending from 2 to 4 µm, with reduced fluctuations within a spectral level of less than 6 dB. To investigate the difference in the SC generation between the two regimes, we take a deeper look at both of them.
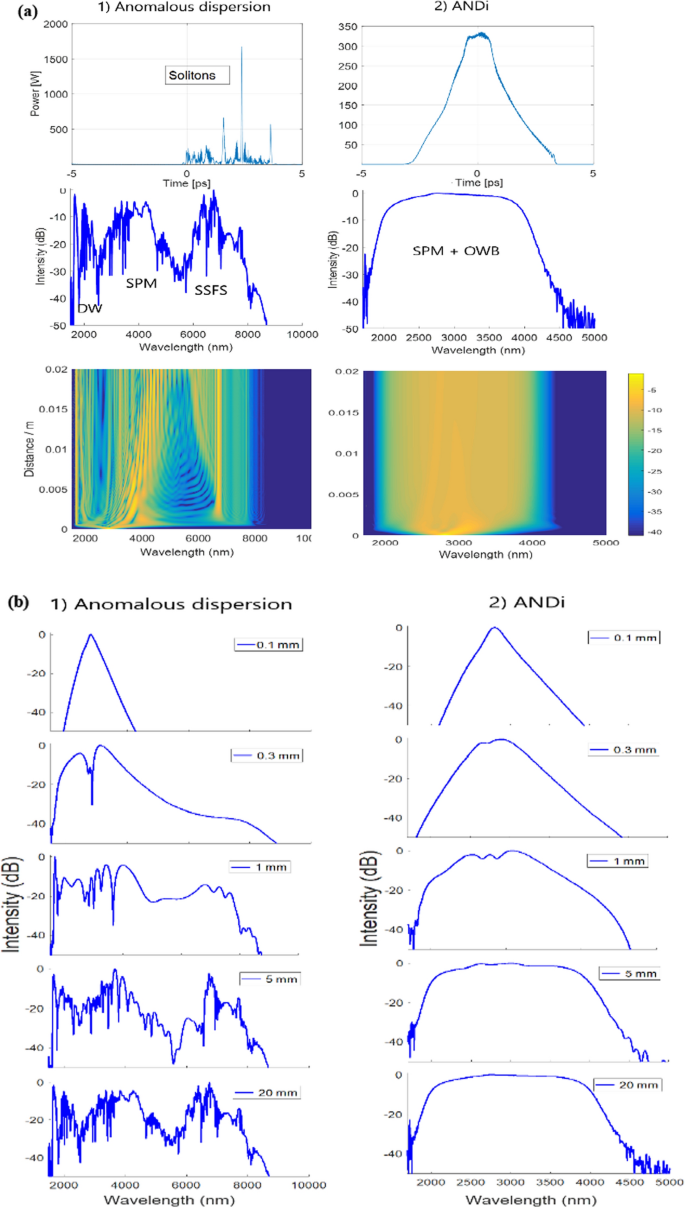
a Numerical simulations of (1) anomalous and (2) ANDi SC evolution as a function of propagation distance in the fiber. The input parameters are: 28.4 fs input pulse duration at 2800 nm with 10 kW. b SC spectrum for different fiber lengths in (1) anomalous and (2) ANDi SC of a 28.4 fs optical pulse with = 10 kW peak power and center wavelength of λ = 2.8 μm
In the anomalous dispersion region, the dispersion and the SPM can balance each other forming solitons of order as in Eq. (15). However, the presence of higher-order dispersion and stimulated Raman scattering perturbs their ideal periodic evolution, and the pulses break up (Heidt et al. 2011; Mitschke and Mollenauer 1986). This process is known as “soliton fission”. It causes the emission of dispersive waves in the lower wavelengths and self-frequency shift towards the higher wavelengths (Dudley et al. 2006). These dynamics are visualized in.
Figure 4A on the other hand, these soliton dynamics are completely suppressed in the ANDi fiber. To have a further understanding of the ANDi SC generation dynamics, we will investigate the time–frequency representation of optical pulses (optical spectrograms) by applying Fourier Transform to time gated parts of their electric component as following (Medjouri and Abed 2019):
where is the gate function. Figure 5. shows the evolution of an optical pulse in a spectrogram representation over different lengths of propagation. The pulse has a duration of fs, a peak power of = 10 kW, and a center wavelength of 2.8 μm. In the initial stage of propagation, the ultrashort pulse broadens in a symmetrical fashion, due to the SPM mechanism (Heidt et al. 2011). The spectrogram exhibits the SPM-characteristic “S”-shaped feature with a red-shift for the leading and a blue-shift for the trailing edge, as shown in Fig. 5. Next, the OWB process affects the pulse leading and trailing edges. Associated with Four Wave Mixing (FWM), they generate new frequencies by overlapping different spectral components of the pulse and induce a sinusoidal beating between them (Finot et al. 2008). The estimated distance at which the OWB is first observed for the sech-shaped pulse is given by Medjouri and Abed (2019); Salem et al. 2016):
where , , and is the OWB distance, which is found to be 1.59 mm. We can see the onset of the OWB effect from the dashed line in Fig. 6. As illustrated, the initial stage of the SCG is SPM. By reaching 1 mm propagation length, the effect of OWB starts to appear leading to the spectral side-lobes broadening toward shorter and longer wavelength regions.
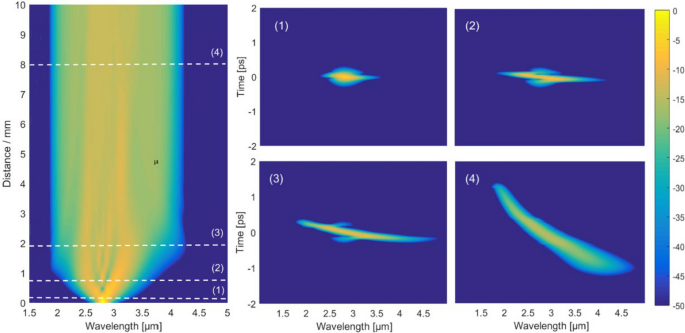
The spectral evolution of the pulse in a spectrogram representation inside the ANDi PCF over a different length of 0.1 mm, 0.8 mm, 2 mm and 8 mm of propagation of a of 28.4 fs duration, = 10 kW peak power and center wavelength of 2.8 μm. The spectrograms (1–4) correspond to the positions marked by the lines in the top figure
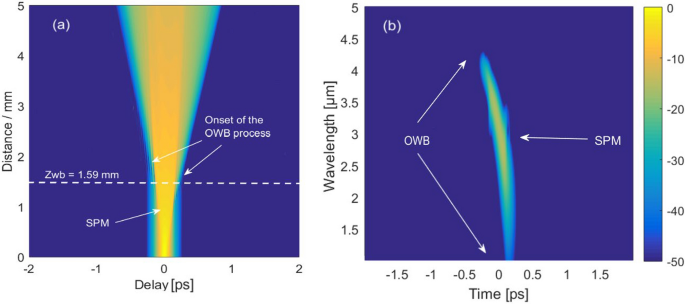
a The pulse evolution along 5 mm of PCF length, the dashed line indicates the onset of the OWB process. b The pulse spectrogram computed at the distance of 1.59 mm
3.3 The coherence
The coherence property of the SCG is an important parameter that can be used to evaluate the phase stability across the spectrum from one pulse to another. It is affected by the existence of the noise of the pulse including input pulse shot noise and spontaneous Raman noise. To evaluate the coherence properties of the generated supercontinuum, we can investigate the noise sensitivity numerically by including quantum noise in the form of one-photon-per-mode fluctuations added to the input pulse. These fluctuations introduce random phase and amplitude perturbations that simulate the spontaneous emission noise present in real systems. The coherence of the generated spectrum was then quantified using the first-order mutual coherence function, , calculated from multiple independent noise realizations. This approach allows us to assess the impact of quantum noise on spectral stability and coherence degradation across the supercontinuum bandwidth. The results indicate that the ANDi regime offers significantly improved coherence over the anomalous dispersion regime, particularly in the mid-infrared range. The first order of mutual coherence , defined as follows (Dudley et al. 2006):
where and are the amplitudes of the electric field for two successive generated spectra, and the angular brackets indicate the ensemble average over with random input noise. We take for the wavelength dependence of the coherence. At a given wavelength we have , where indicates completely coherent spectrum with good stability in amplitude and phase, and for entirely incoherent light.
The SPM and OWB process that dominates The SCG in ANDi generate new frequency components which is in a phase relation with the injected pulse, this causes the resulting spectrum to maintain high coherence. The perfect coherence and noise properties for ANDi regime output spectrum are verified in Fig. 7a which exhibits (). Figure 7b shows the calculated coherence in the anomalous dispersion regime, which shows good coherence with random single-photon-per-made noise. However, this coherence generates with soliton fission dynamics and comes at a cost of complex temporal structure of the pulse. Also, the noise amplification is strongly amplified in the anomalous dispersion region, and the coherent of SC spectral will decrease when input peak power increasing (Le et al. 2021b), and exhibit poor coherence properties for pump pulse durations above 100 fs (Gu et al. 2003). This is different to SCs generated for ANDi which the generated spectrum coherence does not degrade with increasing pump pulse duration (Heidt 2010).