Article Content
Abstract
RNA-binding proteins (RBPs) play crucial roles in gene regulation. Their dysregulation has been increasingly linked to neurodegenerative diseases, liver cancer, and lung cancer. Although experimental methods like CLIP-seq accurately identify RNA–protein binding sites, they are time-consuming and costly. To address this, we propose RMDNet—a deep learning framework that integrates CNN, CNN-Transformer, and ResNet branches to capture features at multiple sequence scales. These features are fused with structural representations derived from RNA secondary structure graphs. The graphs are processed using a graph neural network with DiffPool. To optimize feature integration, we incorporate an improved dung beetle optimization algorithm, which adaptively assigns fusion weights during inference. Evaluations on the RBP-24 benchmark show that RMDNet outperforms state-of-the-art models including GraphProt, DeepRKE, and DeepDW across multiple metrics. On the RBP-31 dataset, it demonstrates strong generalization ability, while ablation studies on RBPsuite2.0 validate the contributions of individual modules. We assess biological interpretability by extracting candidate binding motifs from the first-layer CNN kernels. Several motifs closely match experimentally validated RBP motifs, confirming the model’s capacity to learn biologically meaningful patterns. A downstream case study on YTHDF1 focuses on analyzing interpretable spatial binding patterns, using a large-scale prediction dataset and CLIP-seq peak alignment. The results confirm that the model captures localized binding signals and spatial consistency with experimental annotations. Overall, RMDNet is a robust and interpretable tool for predicting RNA–protein binding sites. It has broad potential in disease mechanism research and therapeutic target discovery. The source code is available https://github.com/cskyan/RMDNet.
Introduction
The interaction between RNAs and proteins plays a fundamental role in understanding regulatory mechanisms in the life sciences. RNA-binding proteins (RBPs) are involved in a wide range of biological processes, including the regulation of gene expression [1], RNA splicing, stability, and translation. Dysfunction of specific RBPs can disrupt the regulation and translation of particular RNA molecules [2], leading to the absence or abnormal accumulation of essential proteins within organisms. Numerous studies have demonstrated strong associations between RBPs and various diseases [3], including autoimmune disorders, neurodegenerative diseases, and cancers of the liver and lung. For instance, RBPs have been implicated in amyotrophic lateral sclerosis (ALS) [4], frontotemporal dementia (FTD) [5], and hepatocellular carcinoma (LIHC) [6].Footnote1 Therefore, accurate identification of RNA–protein interactions (RPIs) is crucial for deciphering disease mechanisms and developing effective therapeutic strategies.
Traditional experimental approaches for identifying RNA-binding proteins [7] are costly, time-consuming, and often yield limited accuracy in binding site detection. Among these, high-throughput sequencing techniques are the most commonly used. However, due to their inherent limitations, researchers have increasingly turned to alternative methods that are more efficient, affordable, and accurate. With the advent of big data and rapid progress in computational technologies, machine learning and deep learning have emerged as powerful tools for addressing this challenge. These approaches have been widely applied to predict RNA–protein binding sites [8], offering new possibilities for uncovering the underlying interaction mechanisms.
In recent years, various deep learning-based methods have been developed for RNA–protein binding site prediction, yielding significant progress.Among sequence-based approaches, Yuan et al. [9] introduced the DeCban model to predict interactions between circular RNAs (circRNAs) and RNA-binding proteins (RBPs). The model incorporates dual embedding techniques and cross-branch attention mechanisms to construct a novel prediction framework. Gronning et al. [10] proposed DeepCLIP, a context-aware neural network that uses only RNA sequence data combined with CLIP-seq to predict protein-nucleic acid binding sites. The model is characterized by a simple architecture, high training efficiency, and good reproducibility. Pan et al. [11, 12] proposed two models: MCNN and WVDL. The MCNN model integrates multiple convolutional neural networks applied to window regions of varying sizes, enabling a more comprehensive use of RNA sequence features while minimizing information loss. In contrast, WVDL employs an ensemble of three base classifiers-CNN, LSTM, and ResNet-using a weighted voting strategy to improve prediction performance.
In terms of sequence and structural feature modeling, Maticzka et al. [13] proposed GraphProt, a graph-kernel-based model that incorporates RNA secondary structure profiles and sequence information to predict protein-RNA interaction sites. As one of the earliest structure-aware models, GraphProt demonstrated the potential of combining sequence-structure features using SVM-based classification. Deng et al. [14] proposed DeepRKE, which utilizes three CNN modules to jointly capture both RNA sequence and secondary structure features. Wang et al. [15] developed DeepWD, a model based on a CNN-BiLSTM architecture and higher-order encoding strategies for RNA sequence and structure representation, demonstrating enhanced expressiveness and predictive power. Yang et al. [16] introduced the GMSVM-RU model, which constructs hybrid features that combine local protein sequence and structure information, and applies repeated undersampling along with a granulated multi-kernel support vector machine for prediction, achieving improved performance.
Several recent models have attempted to use RNA structural features. However, most rely on simple concatenation or parallel embeddings, which fail to fully capture the complex topology of RNA secondary structures. Moreover, these models generally lack dedicated modules to explicitly model the structural context of RNA, treating sequence and structure information with similar strategies and thus failing to exploit their distinct characteristics. These limitations highlight the need for a more structure-aware and multi-view integration framework for accurate RNA–protein binding site prediction.
In this study, we propose RMDNet, an RNA-aware Multi-branch integration network based on Dung Beetle Optimization for RNA–protein binding site prediction. The key contributions of this work are as follows:
We design a hybrid multi-branch architecture that integrates RNA sequence and secondary structure features using three parallel sequence encoders (CNN, CNN-Transformer, ResNet) and a GNN with DiffPool.
We introduce an improved Dung Beetle Optimization (IDBO) algorithm to adaptively fuse branch outputs during inference, enhancing robustness and performance.
We conduct comprehensive experiments on RBP-24 and RBP-31 datasets, and ablation studies on RBPsuite2 to validate the effectiveness of each model component.
We perform interpretable motif analysis from CNN filters, revealing patterns that match known RBP binding motifs.
We demonstrate real-world applicability through a case study on YTHDF1 in liver cancer, showing the model’s spatial precision and biological relevance.
Materials and methods
This study aims to develop a robust deep learning framework for predicting RNA–protein binding sites. To achieve this, we designed a multi-stage pipeline integrating data preprocessing, multi-branch feature extraction, structural modeling, and fusion optimization. The overall architecture of the proposed framework is illustrated in Fig.
Fig. 1
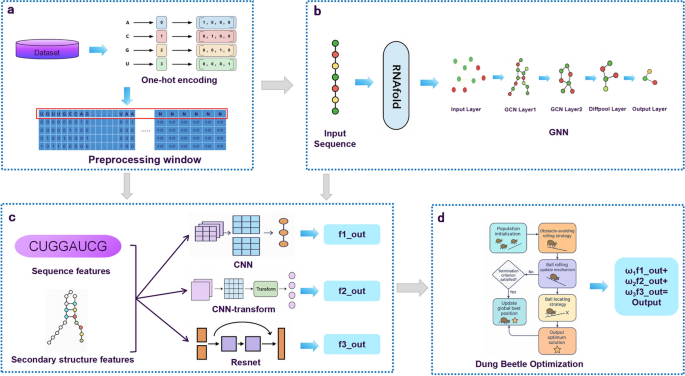
Overall architecture of the proposed RMDNet framework. a Data preparation: RNA sequences are encoded using one-hot vectors and segmented by a sliding window strategy. b Secondary structure extraction: Each sequence is converted into a structural graph using RNAfold, and topology features are extracted via a GNN with DiffPool. c Feature fusion: Sequence features are learned from three parallel classifiers (CNN, CNN-Transformer, and ResNet), and are concatenated with structure features in the fully connected layer. d Weight assignment: During inference, the IDBO algorithm is applied to optimize fusion weights across branches by searching for the best combination.
Datasets
We conducted experiments on two main benchmark datasets: RBP-24 [11] and RBP-31 [16]. RBP-24 includes 24 CLIP-seq [17] experiments covering 21 RBPs, with positive samples derived from binding peaks and matched negative fragments. RBP-31 extends this to 31 proteins using both CLIP-seq and eCLIP protocols, supporting generalization evaluation on unseen RBPs.
Additionally, we used the human subset of RBPsuite 2.0 [18] in three supporting tasks: (i) ablation studies on two representative RBPs–CPSF1 (large-sample) and FBL (small-sample); (ii) motif analysis based on CNN kernel activation patterns; and (iii) a downstream case study on YTHDF1, a cancer-related m6A reader. RBPs overlapping with RBP-24 or RBP-31 were excluded to ensure independence. Dataset descriptions and source references are provided in Supplementary Note 1. While these datasets are widely used and well-curated, they present several inherent limitations. RBP-24 and RBP-31 rely on peak-calling from CLIP-seq protocols, which may introduce positional uncertainty or false negatives due to sequencing noise and limited resolution. Moreover, the fixed fragment length and binary labels may not fully reflect the biological context of dynamic RBP-RNA interactions. In RBPsuite2.0, sample imbalance across RBPs and protocol variability (e.g., antibody specificity or CLIP variants) may affect model robustness and reproducibility. These limitations help contextualize the generalization experiments and explain how differences in dataset scale, annotation depth, and RBP diversity contribute to performance variation across evaluation settings.
Data preprocessing
As shown in Fig. 1a, to handle RNA sequences of variable lengths, we preprocessed all RNA sequences using a strategy consistent with iDeepE [8] and WVDL. Each RNA sequence was converted into a one-hot encoded matrix. Given an RNA sequence
consisting of n nucleotides, the processing of this sequence corresponds to a one-hot coding matrix M is:
(1)
where i is the index of the nucleotides in the RNA sequence. These genes were represented by four different nucleotides. N represents the base nucleotide.
We first applied a sliding window strategy to convert variable-length RNA sequences into fixed-length segments for model input. When the window size exceeded the sequence length, the sequence was padded with the ambiguous nucleotide ’N’. Conversely, when the sequence length was greater than the window size, overlapping fixed-length segments were extracted, each treated as an independent input sample. This strategy allows the model to capture local binding contexts while preserving sequence-level continuity. Inspired by the WVDL approach proposed by Pan et al., we adopted nine different window sizes ranging from 101 to 501, with an increment of 50. The model was trained and evaluated independently under each window configuration, and the final prediction score was obtained by averaging results from all nine settings. This multi-window ensemble strategy enhances both the robustness and generalization performance of the model. These window sizes were not arbitrarily chosen; they were determined based on empirical validation, where we observed consistently improved performance across various RBPs and datasets when integrating predictions from all nine scales.
Beyond sequence information, we incorporated RNA secondary structure to provide additional structural context for prediction. RNAfold [19] was used to predict secondary structures, and the resulting dot-bracket notation was converted into graph format, where nodes represent nucleotides and edges indicate either sequential adjacency or base pairing. These structural graphs were processed using GNN with DiffPool to extract topology-aware features, enabling the model to learn spatial dependencies arising from RNA folding.
To further enhance the expressiveness of structural representations, we employed a Graph Neural Network (GNN) integrated with Differentiable Pooling (DiffPool) [20]. Given an RNA secondary structure graph
with an initial feature matrix
and adjacency matrix
, the graph is first passed through a GCN-based embedding layer to produce node representations:
(2)
Simultaneously, a separate GCN module is used to generate a soft assignment matrix:
(3)
where
denotes the probability of each node being assigned to k clusters. These assignments are then applied to compress the graph as follows:
(4)
Compared to conventional pooling methods such as max or mean pooling, DiffPool supports end-to-end training with hierarchical graph abstraction, enabling more expressive structural representation learning. Given the relatively small size of RNA secondary structure graphs, we adopt a single-layer DiffPool, which effectively captures structural motifs while preventing excessive compression and reducing the risk of overfitting. The resulting structural embeddings are then integrated with sequence-based features to enhance the prediction of RNA–protein binding sites.
An improved dung beetle optimisation algorithm
Modern deep learning models contain numerous parameters, and their performance is highly sensitive to the choice of fusion weights and hyperparameters. Swarm intelligence algorithms have been widely adopted for their ability to efficiently explore large search spaces. In this work, we incorporate the Dung Beetle Optimizer (DBO) [21] into our multi-branch fusion framework to dynamically determine the optimal weight allocation among branches and enhance the adaptability of feature integration.
The original DBO simulates the behavioral patterns of dung beetles in four stages: rolling, breeding, foraging, and stealing. Each stage represents a distinct search behavior in the optimization space. Position updates during rolling are defined as:
(5)
(6)
In case of obstacles, a redirection mechanism updates positions via:
(7)
During breeding, new candidate positions (eggs) are generated within a safe spawning range:
(8)
(9)
In the foraging stage, offspring search for food-rich areas defined by:
(10)
(11)
The stealing stage simulates competitive relocation:
(12)
Despite its strong performance, the original DBO suffers from two limitations: poor population initialization and risk of local optima entrapment. To address this, we introduce the Improved Dung Beetle Optimizer (IDBO), incorporating two mechanisms.
First, inspired by the ISSA [22], we employ circle chaotic mapping to improve population diversity:
(13)
Second, we enhance the exploration capability by integrating the Lévy flight strategy [23, 24] into Eq. (12):
(14)
(15)
(16)
Here,
is the gamma function, and
was set to 1.5. The use of Lévy flight prevents search space shrinkage and enables the optimizer to escape local minima. The setting
was chosen based on prior studies where this value provided a favorable balance between global exploration and local refinement in Lévy-based metaheuristics.
The IDBO module is integrated during the inference phase of our model to optimize the fusion weights of each branch. This improves the flexibility and precision of final prediction by adapting to varying data characteristics. Detailed ecological interpretations and parameter settings are provided in Supplementary Note 2.
RMDNet model
We propose a model named RMDNet (RNA-aware Multi-branch Dung Beetle Optimization Network) to enhance the prediction of RNA–protein binding sites. Initially, RNA sequences are encoded using one-hot representation and segmented into fixed-length fragments through a sliding window approach. Subsequently, RNA secondary structures are predicted using RNAfold, and corresponding structure graphs are constructed. These graphs are then processed by a GNN with DiffPool, enabling the extraction of topological structural features of RNA. For sequence-based features, the model incorporates three parallel branches: CNN, CNN-Transformer, and ResNet, each designed to capture distinct characteristics, including local sequence patterns, global contextual dependencies, and deep hierarchical representations. The outputs from these branches are further integrated with the structural features through a fully connected fusion layer. During the inference phase, an improved Dung Beetle Optimization (IDBO) algorithm is employed to optimize the fusion weights of the three branches. Using prediction performance metrics such as AUC (Area Under the Curve) as the fitness function, IDBO adaptively searches for the optimal weight combination, effectively improving both generalization and prediction robustness. The overall model architecture is illustrated in Fig. 1, which consists of four sequential modules: (a) data preprocessing, (b) secondary structure modeling, (c) multi-branch feature extraction, and (d) prediction via fusion and optimization.
As shown in Fig. 1b, RNA secondary structure information is incorporated into the model through a graph-based approach. We utilize RNAfold, a widely adopted and experimentally validated algorithm, to predict the minimum free energy (MFE) secondary structure of RNA sequences. RNAfold was selected for its reliability, interpretability, and efficiency in modeling base-pair interactions that govern RNA folding. The predicted secondary structures are converted into graph representations, where each nucleotide is treated as a node, and edges represent either base-pairing interactions or adjacent sequential positions. These graphs are then processed by a GNN module composed of two GCNConv layers followed by a DiffPool layer. This architecture enables the network to learn both local and global topological dependencies within the RNA structure graphs. The hierarchical pooling mechanism provided by DiffPool allows the model to extract higher-level structural abstractions that are essential for accurately identifying RNA–protein binding sites.
As shown in Fig. 1c, RNA sequence features are extracted through three parallel branches, each designed to capture different levels of abstraction and receptive fields. The first branch employs a CNN to extract local sequence motifs that may indicate binding preferences. The second branch integrates a Transformer module into the CNN backbone (CNN-Transformer) to model long-range dependencies and contextual interactions, which are often critical in RNA–protein binding. The third branch utilizes a ResNet architecture to extract deep hierarchical representations while mitigating the vanishing gradient problem in deeper layers. All three branches operate on the same one-hot encoded input sequences and produce independent feature embeddings. To incorporate structural information, the output from each sequence branch is concatenated with the RNA secondary structure features extracted by the GNN module. These fused features are then passed through a fully connected layer to produce a binding probability for each branch.
As shown in Fig. 1d, the outputs from the three sequence branches—CNN, CNN-Transformer, and ResNet—are individually passed through fully connected layers to produce independent prediction scores. To enhance prediction robustness and generalization, we introduce a dynamic fusion mechanism based on the IDBO algorithm during the inference phase. Instead of using fixed or manually tuned weights, IDBO automatically searches for the optimal fusion weights
assigned to each branch’s prediction. This search process is guided by a performance-based fitness function, where AUC serves as the main evaluation metric. This ensures that more informative branches contribute more significantly to the final prediction. The weighted outputs are then summed to yield the final RNA–protein binding probability. The complete optimization procedure is detailed in Algorithm 1.
Algorithm 1
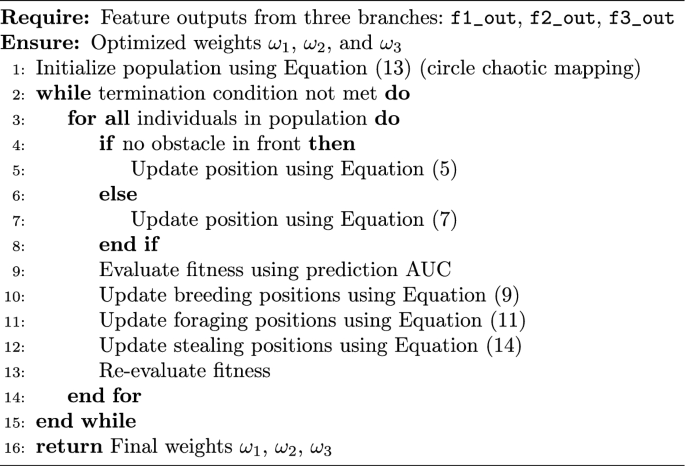
The IDBO-based fusion strategy operates during the inference phase and effectively adjusts the relative contributions of each branch to the final prediction. However, ensuring robust performance also requires careful consideration during the training phase, particularly in addressing the issue of label imbalance.Beyond structural representation learning, addressing label imbalance is critical for stable and unbiased model optimization. To tackle the class imbalance frequently encountered in RNA–protein binding site datasets, we employ a weighted cross-entropy loss [25], where the weight for each class is set inversely proportional to its frequency in the training data. This weighting scheme ensures greater penalization of underrepresented classes, thereby mitigating the dominance of the majority class and improving the model’s sensitivity to true binding sites. The weighted loss is defined as:
where is the ground truth label, is the predicted probability, and , denote the weights for the negative and positive classes, respectively.
The class weights are computed as:
where and represent the number of positive and negative samples in the training set. This formulation ensures balanced contributions from both classes and reduces the impact of skewed class distributions.
Additional strategies
In addition to model design and feature extraction, several practical strategies were employed to ensure efficient and stable model training. These include loss function selection, structural graph caching, early stopping, and learning rate scheduling.
Loss Function. As introduced at the end of Sect. 2.4, we employed a weighted binary cross-entropy loss to address the class imbalance inherent in RNA–protein binding site datasets. The formulation of this loss function and the computation of class-specific weights are given in Equations (17) and (18). This approach enables greater penalization of minority classes and is widely used for its smooth gradients and stability during training.
Structural Graph Caching. To reduce redundant computation in large-scale experiments, RNA secondary structures predicted by RNAfold were converted into graph representations and stored as cache files. These precomputed graphs were loaded directly during both training and inference, substantially reducing runtime and enabling efficient multi-window and multi-task configurations.
Early Stopping. To prevent overfitting, we employed early stopping with a patience of 20 epochs and a minimum delta of 0.0005. This setting ensures that training is halted if the validation loss does not improve by at least 0.0005 over 20 consecutive epochs, thereby avoiding unnecessary computation and mitigating the risk of model overfitting. The model’s validation loss was monitored as the stopping criterion to ensure training would halt when performance plateaued. To avoid premature termination, a minimum of 15 training epochs was enforced.
Learning Rate Scheduler. To improve convergence and avoid local minima, we employed a cosine annealing learning rate scheduler (CosineAnnealingLR) [26]. This approach mimics simulated annealing by gradually reducing the learning rate following a cosine trajectory. Early in training, higher learning rates promote global exploration, while smaller rates in later stages support fine-tuned convergence. This schedule enhances model stability and generalization, especially in complex feature spaces.
Result
Experimental setup
The effectiveness of the proposed RMDNet model was evaluated through a series of systematic experiments conducted on three datasets: RBP-24, RBP-31, and the human subset of RBPsuite2. RBP-24 was used as a benchmark dataset to compare model accuracy within a unified evaluation framework. RBP-31 served as an independent test set to assess the model’s generalization capability on unseen RBPs. For the ablation study, we selected human RBPs from RBPsuite2 that did not overlap with either RBP-24 or RBP-31, ensuring dataset independence and avoiding information leakage. Furthermore, a downstream functional analysis based on YTHDF1 peak data was conducted to investigate the biological significance and practical utility of the model’s predictions.
Eight standard classification metrics were used in the evaluation: AUC, PR-AUC, Accuracy, Precision, Recall, Specificity, F1-score, and MCC. Different subsets of these metrics were emphasized depending on the experimental objective. Reported results represent the mean performance across the relevant RBPs. All models were implemented in PyTorch 1.13 and trained using an NVIDIA A100 GPU. The Adam optimizer was employed, with a learning rate selected from , and a weight decay of . Early stopping was applied to prevent overfitting during training. To handle class imbalance, we used a weighted cross-entropy loss with class weights set inversely proportional to class frequencies. During inference, the IDBO algorithm was applied to search for optimal fusion weights across the three sequence branches, with AUC serving as the fitness function.
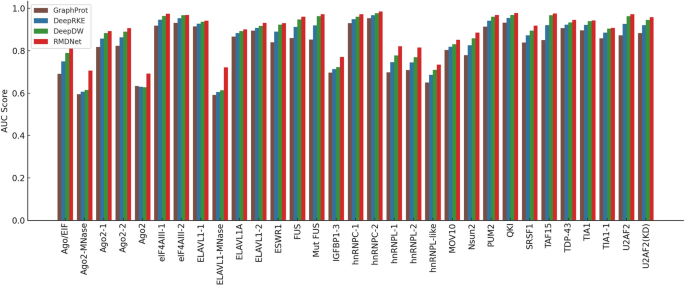
Baseline performance comparison on RBP-24
To comprehensively evaluate the effectiveness of the proposed RMDNet model in RNA–protein binding site prediction, we first conducted a standardized benchmark experiment on the RBP-24 dataset. This experiment was designed to provide a fair and systematic evaluation framework for comparing RMDNet against representative baseline models and to assess its accuracy and robustness across multiple classification metrics. We selected three baseline models for comparison: GraphProt [12], a classical method that incorporates both sequence and structural features for binding site prediction; and two recent deep learning-based models, DeepRKE [13] and DeepDW [14], both of which integrate RNA sequence and predicted secondary structure information and represent more advanced architectures. These models were chosen because they reflect three widely-adopted modeling paradigms in RNA–protein binding site prediction—traditional machine learning (GraphProt), graph-based deep learning (DeepRKE), and convolutional sequence modeling (DeepDW)—and have been extensively used in prior studies as benchmarking references.
A consistent training setting was adopted across all models, with the number of training epochs fixed at 30. For each RBP, model training and evaluation were independently repeated 15 times, and the average performance across these trials was reported to minimize the influence of randomness. In our model, the IDBO algorithm was applied during inference. The configuration in this experiment included a population size of 30, a one-dimensional search space, and 1000 iterations. This configuration was empirically validated by Zhang et al., who demonstrated that it achieves superior performance in similar optimization tasks. Given the inherent stochasticity of swarm intelligence algorithms, we performed repea
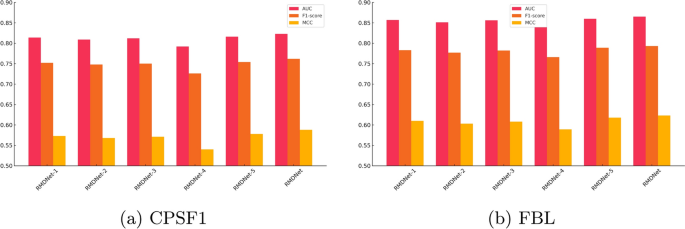
As shown in Fig. 5a, b, and Table 4, the complete RMDNet model consistently outperforms all ablation variants across AUC, F1-score, and MCC. On the large-sample CPSF1 dataset, RMDNet achieves an AUC of 0.823, an F1-score of 0.762, and an MCC of 0.588. Removing any of the three sequence branches?CNN, CNN-Transformer, or ResNet?results in a measurable performance drop, demonstrating the complementary effect of multi-branch feature extraction. Excluding GNN-derived structure inputs leads to the most pronounced degradation, especially in MCC, highlighting the essential role of RNA secondary structure in improving classification balance. Substituting the DBO-based fusion strategy with equal-weight averaging also causes a slight decline, indicating the added value of adaptive inference-time optimization.
A similar trend is observed on the small-sample FBL dataset, where RMDNet again achieves the best performance: AUC of 0.865, F1-score of 0.793, and MCC of 0.623. Interestingly, these values slightly exceed those of CPSF1, despite the smaller dataset size. This differs from previous results on RBP-24, where larger sample sizes generally correlated with better accuracy. One possible explanation is that CPSF1, although large, may contain more heterogeneity or label noise, making learning more difficult. In contrast, the FBL dataset may present cleaner motif patterns and higher data consistency, enabling the model to generalize more effectively even with fewer training samples.
It is also noteworthy that RMDNet achieves substantial improvements over the average performance reported for RBPsuite 2.0. On the CPSF1 dataset, RMDNet’s AUC exceeds the reported mean AUC of 0.783 by approximately 4.0%, while on the FBL dataset, the improvement reaches 8.1%. These results further highlight the generalization capacity and adaptability of RMDNet across both favorable and challenging scenarios.
Visualization and functional validation of learned motifs
This section focuses on YTHDF1, a well-characterized N6-methyladenosine (m6A) reader protein that plays a pivotal role in post-transcriptional regulation and translation initiation. The dataset used for motif analysis was obtained from RBPsuite 2.0, a curated CLIP-seq-based resource that provides high-confidence binding annotations for RNA-binding proteins.
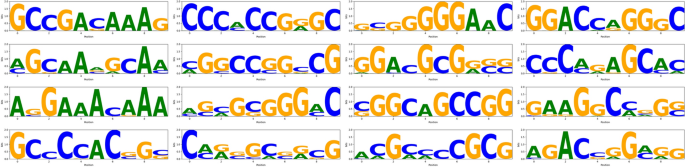
To interpret the internal representations learned by the model, we extracted representative sequence motifs from the CNN branch. Specifically, we analyzed the first convolutional layer by visualizing activation responses of individual kernels using RNA segments associated with YTHDF1 binding. A fixed window size of 101 nucleotides was used to capture local sequence patterns, which typically span 5 to 10 nucleotides. This shorter window helps avoid signal dilution and improves motif resolution. For each kernel, the top 30 most activated subsequences were aligned to generate a position frequency matrix, which was then converted into an information content profile (in bits) and visualized as a sequence logo. The vertical axis of each logo represents Shannon entropy, reflecting the degree of nucleotide conservation at each position. The complete motif logos extracted from all 16 CNN kernels are shown in Fig. 6.
Fig. 6
figure 6
Motifs learned by the CNN branch for YTHDF1. Sixteen sequence logos represent the binding patterns captured by each convolutional kernel
Full size image
Fig. 7
figure 7
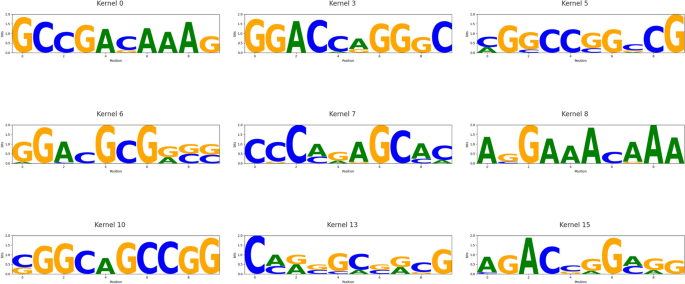
Reliable motifs with significant matches to known RBP patterns. Nine sequence logos correspond to CNN kernels whose motifs aligned with entries in the CISBP-RNA database (E-value < 0.05)
Full size image
Among the 16 CNN kernels, nine (kernel 0, 3, 5, 6, 7, 8, 10, 13, and 15) produced high-quality, biologically interpretable motifs. These motifs were systematically compared against the CISBP-RNA database using a Tomtom-style alignment framework. Evaluation was based on the E-value, which estimates the expected number of false positives under a random match assumption. An E-value below 0.05 was considered statistically significant. Under this criterion, kernel 0 and kernel 15 identified canonical DRACH-like motifs such as ACA and ACG, consistent with known m6A recognition elements associated with YTHDF1. Kernel 5 and kernel 10 matched GC-rich elements related to HNRNPC, kernel 7 captured AU-rich patterns consistent with HuR recognition, and kernel 13 aligned with GGA-rich motifs characteristic of FUS and other FET family proteins. The nine motifs with strong alignment results are visualized in Fig. 7, representing biologically meaningful matches. These findings indicate that our model not only achieves high predictive performance but also learns sequence motifs that align with experimentally validated RBP binding preferences, enhancing its interpretability and functional relevance. Furthermore, several of the matched motifs are known to participate in biologically critical processes. For instance, DRACH-like motifs recognized by YTHDF1 are associated with enhanced translation efficiency in mRNAs [27], while AU-rich sequences targeted by HuR have been linked to mRNA stability and inflammation-related gene expression [28]. These associations support the biological relevance of the learned patterns and their potential roles in disease regulation.
Case study: interpretable binding pattern analysis of YTHDF1
We conducted a case study on the RNA-binding protein YTHDF1 to evaluate the practical applicability and interpretability of the proposed model. YTHDF1 is a well-established reader of N6-methyladenosine (m6A) modifications and plays a critical role in post-transcriptional regulation across multiple biological contexts, including cancer. Its biological significance makes it a relevant target for downstream prediction and visualization.
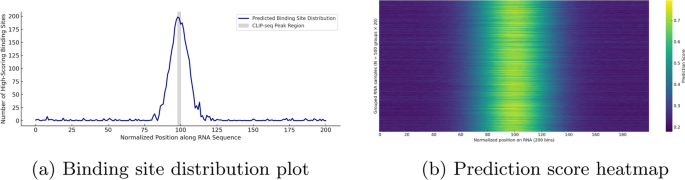
This section presents two key visualizations derived from real YTHDF1 prediction results: a binding site distribution plot and a prediction score heatmap. The distribution plot summarizes the positional frequencies of high-confidence binding sites across normalized RNA sequences, while the heatmap reveals the intensity and spatial trends of predicted binding across a large sample set. Together, these visualizations provide insight into the model’s ability to identify biologically meaningful features, such as motif enrichment and spatial binding preferences, within realistic biological data.
The input dataset for YTHDF1 consisted of 266,977 RNA subsequences generated using a sliding window approach. A window size of 101 nucleotides was chosen to balance the need for capturing sufficient local context with maintaining computational efficiency. This length adequately spans typical RBP binding motifs (approximately 6–10 nucleotides), while also enabling multiscale feature modeling and structural graph construction. Given the large dataset size, directly visualizing predictions for all sequences may result in memory overload or rendering failure. To mitigate this, 10,000 RNA fragments were randomly sampled to represent the full dataset in downstream analyses. For the binding site distribution plot, each RNA sequence was normalized to a fixed length of 200, and all nucleotide positions with predicted scores
were collected. Although the plot appears as a single curve, it is in fact an aggregation across thousands of samples, serving as a compressed yet informative summary of large-scale prediction results. This approach highlights consistent binding hotspots while minimizing computational overhead.
To biologically contextualize the distribution, we compared the predictions with experimentally validated YTHDF1 binding sites from the POSTAR3 CLIP-seq dataset. For each CLIP peak, the midpoint was calculated as
and mapped to the normalized 200-length coordinate system using the following equation:
(19)
Similarly, to generate a clearer and more interpretable prediction score heatmap, we employed a sparse aggregation strategy. Specifically, every 20 RNA sequences were grouped into a batch, resulting in 500 groups (
). For each group, the average predicted binding scores were computed across the 200 normalized nucleotide positions, forming a
heatmap matrix. This approach effectively preserves the overall predictive trends while reducing visual clutter, enabling scalable and structured interpretation of binding signal intensity across a large number of RNA sequences.
Fig. 8
figure 8
Visualization of binding site distribution and prediction score heatmap for YTHDF1 on real RNA sequences. The histogram shows the frequency of high-scoring binding positions (score
) across normalized RNA regions, while the heatmap aggregates 10,000 predicted sequences into 500 groups, highlighting consistent positional patterns. These visualizations reflect the model’s spatial sensitivity and downstream interpretability
Full size image
Figure 8 illustrates the downstream prediction performance of our model on real YTHDF1 RNA sequences. Figure 8a presents the binding site distribution plot, which summarizes the frequency of high-confidence binding positions (predicted scores
) across normalized RNA fragments of fixed length 200. The results exhibit a pronounced central enrichment pattern, with high-scoring positions predominantly concentrated near position 100, spanning approximately positions 85 to 115. To biologically validate this enrichment, we extracted YTHDF1 CLIP-seq peaks from the POSTAR3 database. The center of each peak was mapped to the normalized coordinate system, revealing that the majority clustered around position 99. Accordingly, we shaded the region from position 98 to 100 in Fig. 8a to indicate the experimentally supported binding zone. The predicted peak closely overlaps with this interval, indicating that the model captures real binding preferences with high spatial precision. This spatial bias demonstrates the model’s ability to detect meaningful binding hotspots, rather than uniformly distributing predictions along the sequence. Furthermore, the observed pattern is consistent with YTHDF1 binding profiles reported in previous CLIP-seq studies, underscoring the model’s sensitivity to biologically relevant sequence features.
Figure 8b shows the sparse prediction score heatmap, constructed from 10,000 RNA samples aggregated into 500 groups by averaging every 20 sequences. The heatmap reveals a consistent central band of elevated prediction scores along the normalized RNA sequence, corresponding to motif-enriched regions. In contrast, the flanking regions display relatively low predicted binding activity. This pattern confirms the model’s ability to generate spatially consistent predictions across large-scale input data. The presence of numerous low-scoring background samples further highlights the model’s capacity to distinguish true binding events from non-binding sequences, indicating strong generalization performance.
Together, the two visualizations in Fig. 8 demonstrate that the proposed model effectively captures spatial binding preferences in real biological data, reinforcing its interpretability and practical utility for downstream applications.
Conclusion
This study presents a deep learning framework named RMDNet, which integrates both sequence and structural information to enable accurate prediction of RNA–protein binding sites. RMDNet combines three parallel classifiers—CNN, CNN-Transformer, and ResNet—for sequence-based feature extraction, along with a GNN-DiffPool module to learn RNA secondary structural representations. To enhance feature fusion, an IDBO is employed during inference to adaptively assign optimal weights to each branch.
RMDNet was comprehensively evaluated across multiple datasets. On the RBP-24 benchmark, it outperformed existing methods across diverse metrics. Its generalization was confirmed on the independent RBP-31 dataset. Ablation studies on RBPsuite2.0 validated the contribution of each module. We also extracted binding motifs from the first-layer CNN kernels, several of which showed strong similarity to known RBP motifs, supporting the model’s interpretability. A downstream case study on YTHDF1 further demonstrated RMDNet’s ability to capture spatial binding patterns and positional biases, validating its biological relevance.
In future work, several directions could be pursued to further enhance the model. First, incorporating additional biological features—such as evolutionary conservation, physicochemical properties, or epitranscriptomic signals—may enrich the input representations and improve prediction accuracy. Second, integrating large language models (LLMs) could provide a more contextualized understanding of RNA sequences, potentially leading to better generalization across tasks and datasets. Third, exploring more stable and adaptive variants of population intelligence algorithms may help mitigate the randomness inherent in the current optimization strategy and improve convergence stability. Finally, expanding validation to include more diverse datasets—such as cell line-specific, tissue-specific, or disease-associated RNA–protein interaction data—will be critical for assessing the robustness and real-world applicability of the proposed framework.
ts the overall mean performance for each method, with the best result for each RBP highlighted in bold.
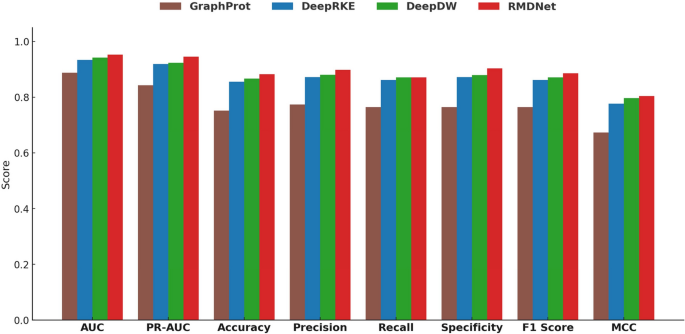
Fig. 3
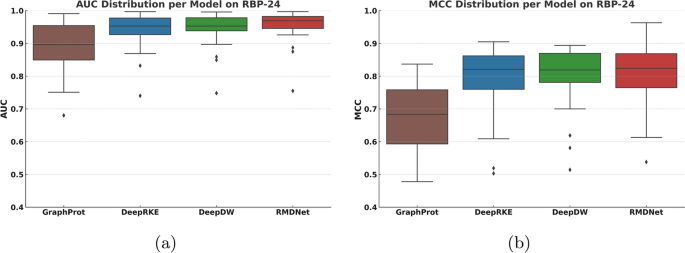
Distribution of AUC and MCC scores across different models on the RBP-24 dataset. Each boxplot summarizes the per-RBP performance for one evaluation metric, reflecting the stability and generalization ability of each model.