Article Content
Abstract
Context
Potential employers can easily access job candidates’ photos online and attempt to infer a candidate’s fit or alignment based on their dress style. In this context, for candidates from marginalized groups like Indigenous people, traditional clothing holds cultural significance as it serves as a lively expression of belonging, participation in ceremonies, and resistance.
Objective
This exploratory study aims to empirically demonstrate whether dress manipulation in a picture affects the perceived competence of equally qualified candidates for a position like a software developer in which this cue should not be crucial.
Method
We conducted a quasi-experiment based on a survey. It involved job candidates (photo models) and participants (evaluators) from IT companies located in Ecuador. The analysis was performed by fitting a linear mixed-effects (LME) model based on dress style, gender and race/ethnicity of the candidates as well as evaluators’ gender and experience in hiring. Also, a thematic analysis was conducted.
Results
Findings show that dress manipulation hardly influences the evaluators’ evaluation of candidates’ competence, as no statistically significant differences were found in our sample. Most of the unexplained variance (64.461%) stems from variability in scores across evaluators. Likewise, the thematic analysis revealed notable evaluator discrepancies indicating varying judgments and outcomes that suggest idiosyncrasies, which are not noise or error.
Conclusions
This study demonstrates the value of contextual factors —such as gender, race/ethnicity and cultural background— in software engineering studies and calls for valuing individual software developers and their human aspects. Perceived competence extends beyond hiring situations as it can influence initial trust and cooperative behaviors among software development team members when interacting with unfamiliar collaborators.
Explore related subjects
Discover the latest articles and news from researchers in related subjects, suggested using machine learning.
- Cultural Psychology
- Intercultural Communication
- Race and Ethnicity
- Social Perception
- Stereotype
- Cross-Cultural Management
1 Introduction
Recruiting the right people becomes a critical activity in software development since it is not only a technical and knowledge-intensive activity but also a human-centric and collaborative one that could benefit from the social attributes of the people involved in it (Vasilescu et al. 2015; Dagan et al. 2023). Indeed, standardized inclusive recruitment practices are a critical component for high-performing teams to achieve excellence (Coleman et al. 2021). The benefits of diversity encompass improving organizational reputation and performance, driving innovation through diverse perspectives, and fostering productivity and creativity (Kanij et al. 2022). However, diversity is multidimensional, emerging from a variety of sources, including demographic attributes that differentiate people such as gender, age, and ethnicity, as well as other dimensions such as role, expertise, and personality traits (Menezes and Prikladnicki 2018; Silveira and Prikladnicki 2019). Studies have revealed the challenges faced by software developers from underrepresented groups (Baltes et al. 2020; Rodríguez-Pérez et al. 2021; van Breukelen et al. 2023; Oliveira et al. 2024), including explicit bias (Blincoe et al. 2019), implicit bias (Wang and Redmiles 2019; Matthiesen et al. 2023), and discrimination (Thomas et al. 2018; Campero 2021, 2023).
In this context, there are limited studies on the hiring process that have been conducted with a focus on diversity (Lunn and Ross 2021). Filkuková and Jørgensen (2020) explored how people perceive the same individuals differently based on their facial expressions in a photo and how this perception affects the perceived competence of candidates for the position of software developer. However, global evaluations have the potential to alter perceptions of even relatively unambiguous stimuli about which an individual has sufficient information to render a confident judgment (Nisbett and Wilson 1977). Overall, employers are increasingly using social media screening, also called cyber vetting, as part of their employment process (Jacobson and Gruzd 2020). Even in countries like the United States and Canada where attaching a photo to a job application is not recommended, pictures that candidates have on the website of their previous employer or online social networks like Instagram, Facebook, Twitter, and LinkedIn can still affect a hiring decision (Filkuková and Jørgensen 2020).
Previous research has also shown that a job application can have different success rates depending on the candidate’s picture regardless of whether the picture is in the CV or available on a social network (Baert 2018) since people can make judgments based on a photo after a minimal exposure time of 100 ms (Willis and Todorov 2016). Although technical training is relevant, it does not, in itself challenge race- and gender-biased preconceived notions of what technically skilled practitioners look like and what constitutes “merit” in the tech workplace (Abbate 2021). These biased standards have served to perpetuate disparities in both hiring and promotion practices.
Overall, hiring is not a value-free and neutral process in which the best candidate is selected (Jacobson and Gruzd 2020). Hiring discrimination has been well-documented based on social identities like gender, race, ethnicity, age, disability, and religion (Baert 2018). Particularly, in the case of male-dominated occupations like software developer, women often change their dress to adopt a more masculine or gender-neutral look to conform to standards of belonging and signal competence (Alfrey and Twine 2017; van Breukelen et al. 2023). Indeed, clothing has been recognized as an element of personal branding that can help software developers advance their careers (Nagy 2019). It suggests that dress manipulation could impact impression formation within this occupation. Despite studies have examined the perceived competence of women (Imtiaz et al. 2019; Veit et al. 2022), little is known specifically about the impact of stereotypes on the perceived competence of software professionals from other underrepresented groups.
To the best of our knowledge, previous studies have not explored the effect of dress manipulation on the perceived competence of software practitioners from underrepresented groups like Indigenous populations. This study is an execution of our registered report (Sánchez-Gordón et al. 2023).Footnote1 We conducted a quasi-experiment based on a survey involving software developers (evaluators) tasked with rating the perceived competence of 24 job candidates based on their photos. Candidates were software developers who self-identified as Andean Indigenous or Mestizo (mixed race). We controlled for candidates’ age by focusing on a specific age range, as well as, their nationality and cultural/historical context (Martin et al. 2017; Harris 2021) by focusing on IT companies located in Ecuador for both evaluators and candidates. To manipulate dressing style, we utilized traditional clothing, as it serves as an identity marker that uniquely identifies Andean indigenous people and provides non-indigenous people like Mestizos with a readily available means to classify indigenous individuals as out-group members. Therefore, dress style manipulation included traditional Andean and non-traditional clothing as treatment. The following research question guides this study:
RQ: Does a choice of dress style in a photograph influence software professionals’evaluations of an Ecuadorian software developer’s competence?
Evaluators’ unconscious biases can lead to decisions that harm candidates from underrepresented groups and benefit candidates who fit the majority-based stereotype. In countries with large urban indigenous populations, such as Peru, Ecuador, Bolivia, and Mexico, the percentage of indigenous persons occupying high-skill jobs, like software developers, is consistently smaller than the percentage of non-indigenous people (Freire et al. 2015). Mestizo is the majoritarian group in Latin America, in particular, Ecuador has 77% (INEC 2023) with high levels of Native American ancestry (up to 51%), followed by less European (up to 33%) and African (up to 13%) ancestry (Yang et al. 2005). Although Latin America has a long history of discrimination against Indigenous people since the beginning of the colonial period (United Nations 2007), discrimination based on phenotype -individual’s appearance like height, hair color, skin color, and eye color- is an underemphasized aspect of raceFootnote2 in the region, particularly in areas with a high Indigenous population (Ravindran 2021). It suggests that Mestizos can share similar facial traits with those of Indigenous ancestry which results in a limited ability to distinguish between both groups.
Previous studies also show that clothing is a powerful non-verbal communication tool that activates stereotypes that can be either positive or negative (Livingston and Gurung 2019; Wang et al. 2022). For example, grooming and dress style can influence evaluator appraisals of competence (Wang et al. 2022). These biases can be extremely powerful in changing perceptions especially those based on race/ethnicity as individuals tend to have strong reactions to “stereotypical clothing” which is clothing associated with specific population groups (Livingston and Gurung 2019). In the case of Andean Indigenous people, they wear traditional clothing for many reasons, e.g., to express belonging, enter ceremonies, and show resistance. Therefore, our motivation for this RQ is to understand whether manipulating dress style affects the software professionals’ perceptions of software developers’ competence. We would like to test the null hypothesis 1 ({H}_{0}^{1}): Evaluators perceive no difference in competence between job candidates wearing traditional and non-traditional clothing in professional photos. The alternative hypothesis 1 ({H}_{a}^{1}): Evaluators perceive differences in competence between job candidates wearing traditional and non-traditional clothing in professional photos.
Apart from gender discrimination, previous studies show that stereotypes against minorities in the tech industry based on race/ethnicity are persistent since there has been almost no change in racial equality and ethnic diversity in the industry (Chattopadhyay et al. 2021). At the core of systemic inequalities such as racism, the cognitive and affective responses of stereotypes and traits are present (Harris 2021). Often, the reasons for stereotypes and their inaccuracies are related to cumulative cultural evolution rooted in historical conditions (Martin et al. 2017; Harris 2021) Therefore, we would like to explore the candidates’ gender and race to test the null hypothesis 2 ({H}_{0}^{2}):The gender and race of candidates do not moderate the effect of evaluators’ perceptions of candidates’ competence. The alternative hypothesis 2 ({H}_{a}^{2}): The gender and race of candidates moderate the effect of evaluators’ perceptions of candidates’competence.
In addition to implicit associations, an evaluator may have related to race and gender which can unintentionally influence the way candidates are perceived and evaluated, Filkuková and Jørgensen (2020) found that women were perceived as less competent than men, particularly among participants lacking prior experience in hiring, driving this effect. Moreover, we would like to explore whether shared gender group membership shapes the extent to which evaluators perceive candidates’ competence. Therefore, similarly to {H}_{0}^{2}, we would like to explore evaluators’ gender and hiring experience to test the null hypothesis 3 ({H}_{0}^{3}): The gender and hiring experience of evaluators do not moderate the effect of evaluators ’ perceptions of candidates’ competence. The alternative hypothesis 3 ({H}_{a}^{3}): The gender and hiring experience of evaluators moderate the effect of evaluators’ perceptions of candidates ’ competence.
The contribution of this exploratory study is based on the participation of software professionals from local IT companies who evaluate the competence of a set of candidates for the job of a software developer, specifically 24 faces of software professionals.
The remainder of this paper is organized as follows. Section 2 presents background and related work. Section 3 presents the execution of the plan presented in our registered report, while Section 4 reports the data analysis and results. In Section 5, we discuss the deviations and limitations of this study and outline the key implications that our study has for the research community. Finally, Section 6 draws some conclusions. To facilitate replication and future work in the area, we have prepared a replication package (Sánchez-Gordón et al. 2024), which includes 197 valid responses of 432 responses received, the scripts for the quantitative analyses, the qualitative scheme code, and the survey materials.
2 Background and Related Works
The study of behavioral aspects in software engineering has been a subject of interest for researchers since the early days of the discipline (Curtis 1984). However, the term Behavioral Software Engineering (BSE) was coined years later along with a definition proposed by (Lenberg et al. 2015). More recently, Fagerholm et al. (2022) conducted an analysis exploring the fundamental role that cognition plays in most software engineering activities. These authors emphasized that social cognition is a cross-cutting concept related to “the cognitive activity that accompanies and mediates social behaviour, including acquisition of information about the social environment, organisation and transformation of this information in memory, and its effects on the individual’s behaviour”. Despite the current fragmentation in the state of the art due to a lack of use of cognitive concepts, Fagerholm et al. (2022) found that social cognition has gained attention in seven publications between 2008 and 2020 but these lack specific psychological theories. Apart from these publications, as mentioned above, Filkuková and Jørgensen (2020) conducted the closest study to our registered report. They took three photos of 20 software professionals using the following facial expressions: a smile, a neutral expression, and a thinking expression, with a hand touching one’s chin. A total of 238 employees from IT companies were assigned to one of the three sets of photos to evaluate the candidates’ competence for software developer jobs. This study used a single item based on a 7-point scale (1 = not competent at all; 7 = very competent). Their findings suggest that application photos have an impact on one’s perceived competence of software developers but competence is not conceptualized by drawing from cognitive science.
Research on social cognition has shown that people perceive social groups and individuals based on perceived warmth and competent they are, a model known as the Stereotype Content Model (SCM) (Fiske et al. 2002). These two dimensions of social judgment play a significant role in how perceivers form impressions of targets and shape their social interactions. Warmth reflects the survival need of knowing the intentions of targets (positive or negative, perceived competition) whereas competence is the consequent ability to enact those intentions (status) (Fiske et al. 2007). From an evolutionary point of view, warmth is judged before competence, and those dimensions not only impact impression formation but also underlie group stereotypes formed by combining high versus low levels of these two dimensions. However, some studies (Belmi and Pfeffer 2018; Min and Hu 2022) have shown that preferred dimensions are context-dependent. Since software developers are often reviewed and compensated based on their team’s performance, reward interdependence is expected to affect their cognition, leading them to value competence over warmth (Belmi and Pfeffer 2018). In support of that, a survey on occupational stereotypes found that systems and software developers were perceived by professionals, mostly recruiters, as having high competence but low warmth (Strinić et al. 2022). Overall, social groups are perceived as competent if they are high in status, e.g., educationally or economically successful (Fiske et al. 2002). In this sense, previous research has revealed that the race/ethnicity of people moderates such effects for Black Americans (Fiske et al. 2009). It is also expected that this stereotype, called subtyping by class, plays a role in other groups who are not high in status like Andean Indigenous.
Perceived competence has been measured in different context. Cuddy et al. (2004) examined how female subtypes are subjected to affectively mixed prejudices. They developed two four-item scales that assessed perceived competence (capable, efficient, organized, skillful) and perceived warmth (good-natured, sincere, warm, trustworthy) on a seven-point scale ranging from “not at all” to “extremely”. Later, Cuddy et al. (2009) proposed a warmth and competence survey to examine the SCM model across cultures. This survey uses a five-point Likert scale (1 “not at all”–5 “extremely”) for warmth (friendly, warm, good-natured, and sincere) and competence attributes (competent, confident, capable, and skillful). More recently, Strinić et al. (2022) examined occupational stereotypes related to preselected occupations within a professional sample that included systems and software developers. They used an adapted competence subscale from Cuddy et al. (2009) by replacing “talented” and “ambitious” with “confident” and “capable” as proposed in their earlier study Strinić et al. (2021). Moreover, Wang et al. (2022) explored the interaction effect of grooming and dress style on hirability. Building on Cuddy et al. (2004) and Correll et al. (2007), they developed a composite measure of perceived competence using seven-point scales that ranged from “not at all” to “extremely” capable, efficient, skilled, intelligent, independent, self-confident, aggressive, and organized.
Understanding real-world judgments calls for studying impressions of more realistic and complex stimuli. In this sense, most psychological literature suggests that people draw inferences based on facial appearance judging mainly based on gender, age and ethnicity (Van Vugt and Grabo 2015). Beyond the target face, another feature of the target identity that deserves consideration is the target’s dress. Research has shown that dress affects behavioral responses in crucial aspects such as employment opportunities and occupational success (Konrath and Handy 2021; Wang et al. 2022). These biases can be extremely powerful in changing perceptions specially those based on race/ethnicity as individuals tend to have strong reactions to “stereotypical clothing” which is clothing associated with specific population groups (Livingston and Gurung 2019). Target face and target dress are intimately linked but markedly different, since target’s dress is more state-like and malleable whereas the target face is more stable, trait-like, and resistant to change (Hester and Hehman 2023). Perceptions of individuals from different cultural backgrounds are associated with specific cues that may reinforce stereotypes and influence trust. For example, one perceiver might have the cultural knowledge needed to associate wearing traditional clothing as a signal of indigenous identity. Because they hold positive attitudes toward people who identify as “Indigenous” they form a positive first impression of the target. On the contrary, another perceiver might hold negative stereotypes like subtyping by class. In this scenario, this perceiver endorses negative stereotypes about indigenous identity, but due to the lack of recognizable traditional clothing and phenotypic similarities between the targets, these stereotypes do not come into play. As a result, the perceiver relies on alternative cues to judge the target.
3 Plan Execution
The plan execution followed our registered report (Sánchez-Gordón et al. 2023) with some deviations, which are described in Section 5.2. To guide and focus our study, we develop a theoretical model as shown in Fig. 1. Competence is a second-order construct since it encompasses four dimensions: competence, skillfulness, talent, and ambition as proposed by Strinić et al. (2022). Then, we conducted a survey study to collect data that was subsequently analyzed using mixed models that included both fixed effects and random effects.
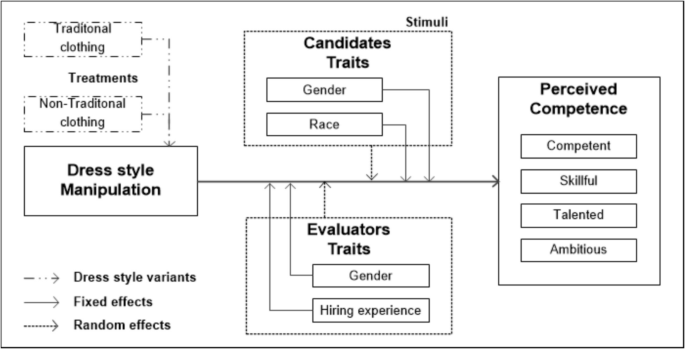
Research model of this study adapted from (Sánchez-Gordón et al. 2023)
3.1 Participants
We considered a convenience sample strategy to collect responses from employees of IT companies located in Ecuador since cultural background influences the formation and development of stereotypes. We contacted them by phone and then an email invitation was sent. Almost all agreed to collaborate in this study by extending email invitations to their employees. They comprise around 200 employees. Anticipating a low response rate, we went beyond the original recruitment strategy outlined in our registered report. We sent additional email invitations to a targeted group of 735 former students from the Universidad Técnica del Norte located in the northern region of Ecuador. In addition, we sent invitations to 65 personal contacts located in Ecuador. As a result of these efforts, we sent 1,000 invitations and received a total of 432 responses (a response rate of approx. 31%).
To reduce the influence of social desirability bias, participation was voluntary and anonymous, with no cash incentives provided. We also aimed to minimize the likelihood of purposefully misreporting by informing participants beforehand that the data would be solely used for research purposes.
3.2 Survey
As per the registered report, we created an anonymous questionnaire self-reported web-based questionnaire using a survey tool called QuestionPro. Questions were grouped into three main parts i) demographic information, ii) professional experience, and iii) evaluation. Figure 2 provides an overview of the questionnaire, while the complete survey is available in the replication package (Sánchez-Gordón et al. 2024).
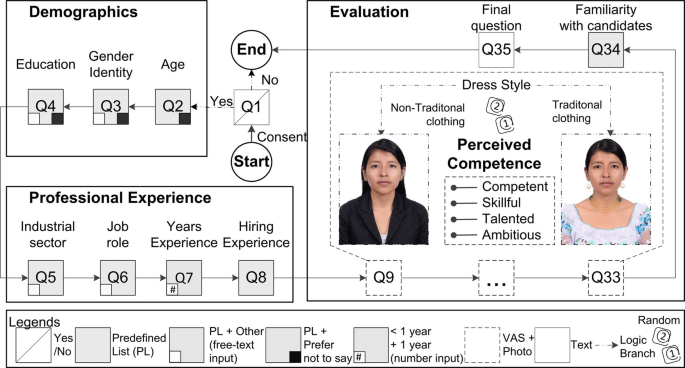
Overview of the questionnaire and an example of stimulus material (non-traditional/traditional clothing) along with the Visual Analogue Scale (VAS) used to measure candidates’ perceived competence
The first two parts included single-choice selection questions based on predefined lists (PL, see more details in Table 1). The first part is related to basic demographic information concerning participant age (Q2), gender identity (Q3), and education (Q4). These questions included the option “prefer not to say”, while the last two also offered a free-text input for the “other” option in education and the “I prefer to describe myself” option for gender identity. The second part is related to the professional experience including job role (Q6), years of experience (Q7) and the evaluator’s experience in hiring (Q8; 3-point scale: Occasionally, Frequently and Never). Different from the registered report,Footnote3 we formulated a question about the industrial sector of the organization that participants work in (Q5).
In the third part of the survey, a stimulus based on photographs of 24 candidates was included to evaluate candidates’ perceived competence. This approach was inspired by previous research on the impact of three distinct facial expressions on the perception of competence in software developers (Filkuková and Jørgensen 2020). Each candidate’s perceived competence (Q9-Q33) was evaluated based on their photograph and a Visual Analogue Scale (VAS), which provided continuous rating options as shown in Fig. 2. The VAS comprised a horizontal line with descriptive anchors at opposing ends ranging from “not at all” to “extremely” (100 points). Participants were randomly assigned across treatments and assessed all 24 candidates across four dimensions: competence, skillful, talent, and ambition.
To understand the effect of familiarity with candidates, we included a question (Q34; 3-point scale: no, I don’t remember, and “yes”) to ask participants if they knew any of the candidates. Moreover, we went beyond what was outlined in the registered report and included the following final open-ended question (Q35): “Would you like to add some additional information or share some other perspective on how to evaluate candidates for software developer positions?”.
Stimuli Creation
All 24 photo models are employees of IT companies located in Ecuador. They were former students from the Universidad Técnica del Norte who did not receive the invitation email to participate as evaluators in this study. To constitute a balanced sample, models were selected based on race (Indigenous and Mestizo) and gender (man and woman). This resulted in four groups of six models each (6 × 4). To mitigate the effect of age in hiring, all photo models were within the age range of 22 to 34 years, except for one of the indigenous candidates who was 44 years old. To manipulate the dress style of the candidates, all models appeared in both experimental conditions (traditional Andean/non-traditional clothing). Moreover, the use of traditional accessories was restricted solely to traditional clothing to reduce possible biases. Each picture is a facial photograph, head and shoulders of the models only, and portrait orientation as shown in Fig. 2.
The photos were taken in a room without windows, ensuring consistent lighting conditions throughout. Moreover, all models were instructed to look straight at the camera and then adopt a neutral expression since we are only interested in gender and race comparisons and any other differences in evaluating different models were not considered. All pictures except for two indigenous candidates were taken in the same place at a specific time of the day by the same camera digital with a maximum resolution of eight megapixels. To ensure consistency for the remaining two candidates, two additional locations with similar conditions were established although another camera was used. After the photo sessions, the models were given digital copies of their images, but they were not informed of this beforehand.
Pilot Test
We created a checklist focused on the clarity, completeness, relevance and response time of the survey. Then, we invited three software professionals, rather than the two specified in our registered report, to respond to the survey and provide feedback based on the checklist. We analyzed their responses and made some minor changes to address their feedback. Then, we also deviated from the registered report by inviting two more professionals to test the improved survey. As a result, no further modifications were necessary following their feedback. These responses were not included in the analysis of the results.
Data Collection
The data collection process was conducted between February and April 2024. Before participation in the online survey, participants were asked to review a consent document and “agree” to the contents of it. Then, they were randomly assigned across treatments, i.e., half of them to each one: experimental group and control group. The control group received the candidates’ photos wearing non-traditional clothing whereas the experimental group received the candidates wearing traditional clothing. Next, participants were informed that all the candidates they would see were equally qualified for a position as a software developer. After that, the images of 24 candidates were presented along with the scale to rate their perceived competence.
The time to do each evaluation was not limited so participants had as much time as needed to complete it. However, participants cannot fall back to the previous picture once they had moved on. To ensure that all variables, except for the candidates’ clothing, remained constant between the two groups, we kept a consistent sequence of candidates. This means the same candidates were presented in the same order. For instance, a picture of the indigenous male [C1] was always followed by a photo of the Mestizo female [C2], then the Mestizo male [C3], and finally the Indigenous female [C4]. Each candidate was thus assigned a unique identifier, ranging from [C1] to [C24].
4 Data Analysis and Results
Following the data collection, we proceeded to the analysis stage which was performed only for those valid responses according to the criteria established in the data cleaning. This resulted in 197 valid responses which provide an overview of both demographic information and competence scores within our sample. Then, we prepared the data for model development and tested our hypotheses by fitting the model.
Data Cleaning
We deleted all the incomplete responses from the 432 responses received. As a result, there were 240 complete responses (a completion rate of approx. 55%). Note that, due to some participants dropping, the percentage of participants could not be kept the same in the control (124, 52%) and experimental (116, 48%) groups which was our initial intention. Fifteen survey responses were removed from the dataset, eight because they were submitted by individuals located in other countries, and seven because respondents are not currently working in the software industry, including four students. Although six responses were received from scholars, they identified themselves as software professionals, thus they were retained. Different from the registered report, twenty-eight responses were removed based on their average value scores, which were either below or above 10 (see details in 5.2 section). The final comment in some responses served to further justify their exclusion. Additionally, participants who reported less than one year of experience or indicated familiarity with certain candidates were retained for further analysis. This resulted in a total of 197 responses to our analysis.
We also received 89 answers to the final comment, an open-ended question, but we removed 11 of them since they indicated that no additional information needed to be provided, except one answer that lacked context to understand it. Therefore, we leave 78 answers for analysis.
Demographic Information Overview
All 197 participants self-identified as current software professionals. Table 1 shows an overview of the frequency of responses. The majority of participants identified as men (n = 159, 81.7%), while 38 (19.3%) identified as women. Note that while the percentage of female representation is relatively low, it is close to the average percentage (20.8%) in the Faculty of Engineering and Applied Sciences (FICA) at the Universidad Técnica del Norte, according to the last academic year (2023–2024) official statistics (Universidad Técnica del Norte 2024). Overall, women remain underrepresented in the science, technology, engineering and mathematics (STEM) workforce, making up only 28.2% of the total according to the Global Gender Gap Report 2024 (World Economic Forum 2024). The age of most participants (139) ranged from 26 to 45 years old. Moreover, most of the participants reported an engineering degree (130) followed by a master’s degree (55), and the remaining (12) reported having other degrees.
Most participants (163) reported having more than one year of experience (mean = 7.59, SD = 6.39, range, 1–35) with one participant’s data missing, and 34 reporting less than a year. Looking into the different industrial sectors, 76 participants worked in ICT, followed by Financial (33), Education (23), Government (10), Telecommunications (8) and other sectors (47) such as FinTech, Pharmaceutical, and Manufacturing. The most reported job role was software developer (88), although analyst (37), project manager (29), tester (7), and architect (5) were also represented. In the category others (31), we identify middle managers (8), academics (6) and other ICT-related roles (17).
Among the respondents who have hiring experience, 74.11% (146) reported occasional (128) and frequent (18) involvement, while 25.89% (51) stated they had never been involved. Finally, the majority of the respondents (111) reported that candidates did not seem familiar to them, while the remaining (86) reported they were somehow familiar with the candidates.
Competence Scores Overview
The competence data points consisted of 4,728 scores (n = 24 × 197) for each item as shown in Table 2. The control group (1) received non-traditional clothing, while the experimental group (2) received traditional clothing as treatment. The control group comprises 104 evaluators (n = 2,496) whereas the experimental group contains 93 evaluators (n = 2,232). On average, candidates were perceived as 54.29 competent (SD = 22.20, range, 0–100), 53.76 skillful (SD = 21.79, range, 0–100), 54.02 talented (SD = 22.15, range, 0–100) and 56.36 ambitious (SD = 22.90, range, 0–100).
Table 3 shows the perceived competence by gender of both the evaluators (higher-order) and candidates (lower-order). Overall, male evaluators provided more favorable competence scores. In addition, female candidates in the experimental group were perceived as more competent than male regardless of the evaluators’ gender. However, female evaluators perceived female candidates as slightly less competent than male candidates in the control group while the opposite is observed in the experimental group, differences in means are −1.2008 and 1.9843, respectively. The range of perceived competence values is displayed in the “Min.” and “Max.” columns.
Figure 3 depicts the boxplots of perceived competence for candidates, [C1] to [C24], grouped into four categories: Indigenous Male, Mestizo Female, Mestizo Male, and Indigenous Female. Evaluators assessed the candidates’ competence under one of two treatment conditions: the control group (1), linked to non-traditional clothing, and the experimental group (2), linked to traditional clothing. An unexpected finding was that 22 candidates received a more favorable competence score in the experimental group than in the control group, except for an indigenous man [C9] and an indigenous woman [C12]. However, note that the differences in means were less than one for [C12] and two other candidates [C7, C15], with values of −0.30, 0,23, and 0.76 respectively. For [C9], the difference in means was −2.95 indicating that his perceived competence might have been affected by another contextual factor like age (44 years), despite not receiving the lowest scores in any of the treatment conditions. Moreover, we observe that three mestizo women [C2, C10, C22] received the highest scores in the experimental group.
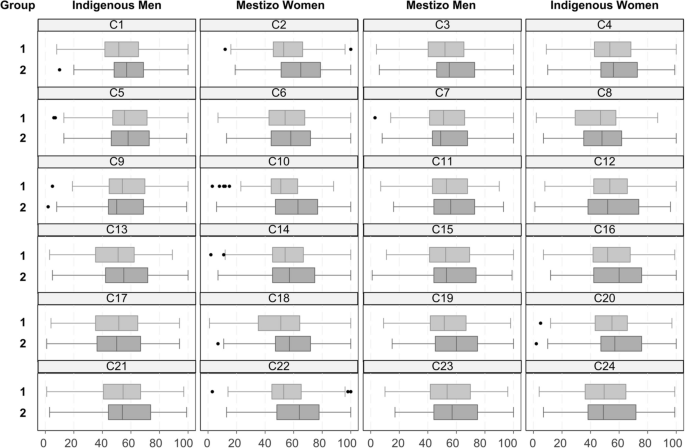
Box plots of perceived competence for the 24 candidates in the between-group analysis. The treatment for the control group (1) is non-traditional clothing and traditional clothing for the experimental (2) group
As the same target (i.e., the candidate depicted) was presented in our study as static (photo) stimuli in both experimental conditions, we expected that observed ratings (competent, skillful, talented, ambitious) given to the same target (candidate) across different evaluators (all evaluators are different variables with observations competent, skillful, talented, ambitious) should be highly correlated but correlations appeared rather low (from on average r = −0.004, p = 0.3454 to on average r = 0.09, p < 0.001), while the correlations of observed ratings given by the same evaluators across candidates (all candidates are different variables with observations competent, skillful, talented, ambitious) vary considerably (from on average r = −0.004, p = 0.2743 to on average r = 0.925, p < 0.001).
4.1 Statistical Modeling Analysis
Data Preparation
We deleted the consent form confirmation (Q1) field since respondents could not continue without checking these boxes (the response is always “YES”). The raw data was coded into a common quantitative coding scheme available online in the replication package (Sánchez-Gordón et al. 2024). Table 4 provides a short description of the coding scheme including the factor name, the variable name used in our model, the survey section and the related survey questions, ID encoding used in our model, potential values, and their respective types. Specifically, {\mathbb{N}} denotes a natural number, {\mathbb{O}} indicates ordinal data, and {\mathbb{Z}} indicates an integer for categorical data.
To facilitate the analysis, the following three categories were regrouped. Experience (Q7) was regrouped to less than 1 year (0) and more than 1 year (2). Hiring experience (Q8) had 3 categories and was regrouped to “no” (no (1) and I don’t remember (2), 1) and “yes” (yes (3), 2). Familiar (Q34) had 3 categories and was regrouped to “no” (never, 1) and “yes” (occasionally (2) and frequently (3), 2). After gaining some insight concerning the data and the factors, we focus on statistical model development.
Model Development
Standard linear regression models assume independence between the measurements, which is not suited for the analysis of the data with hierarchical structures. To resolve this issue mixed models were developed (Stroup 2012). These models are particularly well suited for the analysis of data with repeated measurements on clusters that involve two sources of variation, within and between clusters (Demidenko 2013). They can also control correlations between measurements (Demidenko 2013). A mixed-model approach seems appropriate as our data represents a repeated-measurement design with each evaluator assessing multiple candidates and each candidate being assessed by multiple evaluators. According to Stroup (2012), a mixed model shares the general form of the Eq. (1):
where \beta is a vector of fixed-effect parameters and \text{X} is the design matrix for fixed effects whereas \delta \sim \text{MV{N}}\left(0,\Sigma \right) is a vector of random-effects and {Z} is the design matrix for random effects, while \varepsilon \sim \text{MV{N}}\left(0,\text{I}\cdot {\sigma }_{\varepsilon }^{2}\right) are random errors. Further, it is assumed that all \delta and \varepsilon are independent.
In this study, the factor related to the treatment is a fixed effect, i.e., dress style. Figure 4 shows the plot plan, with evaluators (B) nested within a factorial combination (repeated measures) of the other two factors, treatment (A) and candidate (C), i.e., AxB(A)xC. This combination of crossed and nested factors is a split-plot design (Stroup 2012). Perceived competence represents a two-treatment paired design (traditional and non-traditional clothing) where the observation unit is not distinct from units of replication, i.e., the candidates and the nested effects. The interaction between a fixed effect and a random effect is random due to the inclusion of a random component.
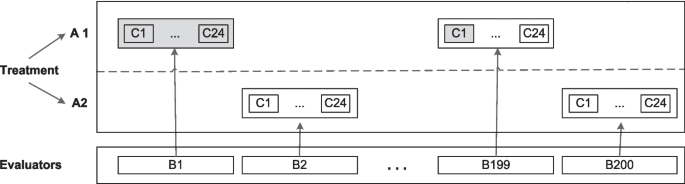
Plot plan for the addressed design of the experiment (200 evaluators are exemplified)
Due to the strong right skewness of the collected average scores (see Fig. 5), the response variable was the Box-Cox transformed average competence (Avg_competence), defined as {\gamma }_{i}=\text{BoxCox}(\frac{1}{4}{\sum }_{j=1}^{4}{y}_{ji},\lambda =1.03), where optimal \lambda was found using boxcox function from MASS (version 7.3–60.2) package in R (Venables and Ripley 2002; Ripley et al. 2024). The Box-Cox function is a power transformation that makes the data closer to the normal distribution, which is assumed in the linear mixed effect model.
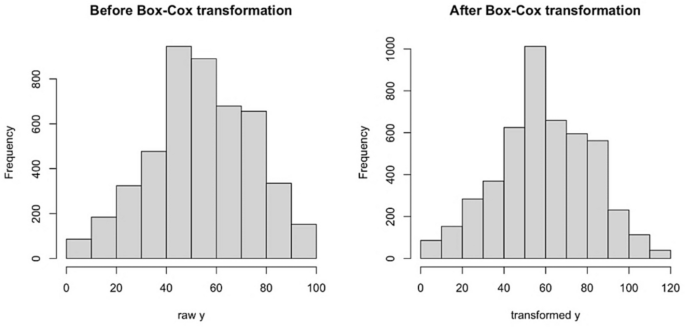
Histograms of the raw and transformed outcome variable
Furthermore, the vector of fixed effects {X}_{i} for observation i\in \{1,\dots ,n\} consists of variables {{\tau }_{i},c}_{1i},{c}_{2i},{c}_{3i},{b}_{1i},{b}_{2i}, defined in Table 4, as well as the two and three-way interactions between components of {{\varvec{c}}}_{{\varvec{i}}} and {{\varvec{b}}}_{{\varvec{i}}}. The vector of random effects {\rm Z}_{i} is chosen for the addressed split-plot design and consists of a random intercept for all evaluators based on {b}_{0,i}, a random intercept for all candidates based on {c}_{0,i}, a random effect of all candidates based on {c}_{0,i} for each level of treatments {a}_{i}, and random slope for accounting for the order of candidates nested within evaluators {c}_{0,i}|{b}_{0,i}.
The resulting special case of the Eq. (1) is associated with the linear mixed effect model defined for simplicity per observation i\in \left\{1,\dots ,n\right\} as follows (2):
where \beta=({\beta }^{\tau },{\beta }^{c}, {\beta }^{b},{\beta }^{cc},{\beta }^{bb},{\beta }^{ccc},{\beta }^{ccb}) is the vector of fixed effects, \varepsilon \sim \text{MV{N}}\left(0,\text{I}\cdot {\sigma }_{\varepsilon }^{2}\right) are random errors, \delta \sim \text{MV{N}}\left(0,\Sigma \right) are random effects. Further, \varepsilon and \delta are all pairwise independent. The model was implemented using the open-source statistical software R 4.3.2, utilizing the lmer (R package lmerTest, version 3.1–3) function for Linear Mixed Effects (LME) models (Kuznetsova et al. 2020). This corresponds to the following lmer formula (3).
where Avg\_competence is the dependent variable; Treatment, familiar, cgender, crace, hiringExp and gender are fixed effects; (1 | EID) and (1 \left|CID\right) are the random effect for each evaluator and candidate, respectively, whereas (1 | CID:Treatment) is the random effect of all candidates for each level of treatment. Moreover, (0 + CID | EID) is read as “no intercept and candidate by evaluator”. It is a random slope for all candidates, grouped by each evaluator.
The results for fixed effects are summarized in Table 5. The main effects of the predictors were assessed. All variables were tested to see if they have an individual statistical significance using a t-test. The obtained statistical results for fixed effects possessed degrees of freedom between 96 and 4319, and the only significant on a 0.05 level of significance effect appeared to be the intercept with a t-statistics of 2.914 on 343 degrees of freedom corresponding to a p-value of 0.004. Thus, the results indicate a non-significant treatment effect at the 0.05 significance level and non-significance for all other addressed fixed effects.
The summary of the random effects is given in Table 6, indicating that most of the unexplained by fixed effects variance is due to high unexplained by the fixed effects variability of scores across the evaluators accounting for 64.461% of total variance in the data. The residual variance (33.282%) represents unexplained variability in the outcome that is not accounted for by the fixed and random effects in the model. Other sources of randomness have lesser contributions to the total variance.
Diagnostics of the addressed model have also been performed. The residuals are symmetric and bell-shaped, however exhibit somewhat heavier than standard normal tails. They are also slightly heteroskedastic, yet we consider the model acceptable given the evaluated p-values not contributing to significant effects anyway. Moreover, when data was simulated from the fitted model, and then refitted to the original model similar behavior of the residuals was obtained, see Fig. 6. Likewise, ANOVA analysis against the null model with the same random effects but without any fixed effects gives a p-value of 0.6873 (ANOVA in R; χ2(26) = 22.025), corroborating the joint non-significance of fixed effects.
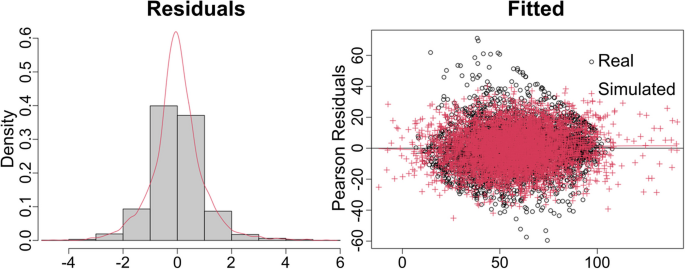
Model diagnostics. On the left, black is the histogram, red is the density plot of the standardized residuals. On the right, black are real data residuals, and red are residuals based on simulation from the fitted on real data model obtained through sim.residplot function from GLMMmisc (version 0.1.1) R package (Johnson 2016)
To account for the model misspecifications and robustness of the drawn conclusions regarding significance of the fixed effects and selection of the random effects, extended model selection of alternative structures of the random effects combined with optimal selection of the fixed effects has also been performed. To do so, we used backward stepwise selection of random-effect terms followed by backward selection of fixed-effect terms in linear mixed models using likelihood ratio tests with a significance level of 0.05 through step function in lmerTest (version 3.1–3) R package (Kuznetsova et al. 2020). Here, the extended full model corresponds to the following R formula (4).
and the final selected model was (5)
essentially confirming our conclusions regarding non-significance of the fixed effects and confirming the choice of random effects. Also, it is worth mentioning that as another robustness check, we ran the analysis without the Box-Cox transformation. This analysis confirmed all conclusions obtained with the transformed data and is available in the replication package.
Hypotheses Testing
When fit with the collected data, the extended model (4) did not propose significantly better than the full model in (3) in terms of likelihood ratio tests (ANOVA in R; χ2(7) = 2.2867, p = 0.9423). In turn, the full model (3) did not perform better than the null model (5) in terms of the likelihood ratio test (ANOVA in R; χ2(26) = 22.025, p = 0.6873).
For {H}_{0}^{1}: Evaluators perceive no difference in competence between job candidates wearing traditional and non-traditional clothing in professional photos, thus the {H}_{0}^{1} hypotheses cannot be rejected according to the t-test for the addressed linear mixed effect model. Specifically, the treatment effect is 4.692 (SD = 2.781, t = 1.687) corresponding to a p-value of 0.093. Power analysis run by powerSim function from simr (version 1.0.7) R package (Green and MacLeod 2016) estimates power for predictor Treatment to be 55.00%, 95% confidence interval 31.53%—76.94%.
For {H}_{0}^{2}: The gender and race of candidates do not moderate the effect of evaluators’perceptions of the candidates’competence, thus the {H}_{0}^{2} hypotheses cannot be rejected according to the t-test for the addressed linear mixed effect model. Specifically, the main effect of crace is 7.419 (SD = 6.347, t = 1.169) and of cgender is 11.022 (SD = 6.341, t = 1.738) corresponding to p-values of 0.245 and 0.085 respectively. Furthermore, none of the interactions involving crace or cgender are found significant, see Table 5 for detailed information about the effects, their standard deviations, t-statistics and p-values.
For {H}_{0}^{3}: The gender and hiring experience of evaluators do not moderate the effect of evaluators’perceptions of the candidates’competence, thus the {H}_{0}^{3} hypotheses cannot be rejected according to the t-test for the addressed linear mixed effect model. Specifically, the main effect of gender is −10.829 (SD = 11.886, t = −0.911) and the main effect of hiringExp is −10.289 (SD = 15.803, t = −0.651), corresponding to p-values of 0.363 and 0.516. Furthermore, none of the interactions involving race or hiringExp are found significant (see details in Table 5).
Thus, all main hypotheses could not be rejected. Although we ran the model with the hiring experience variable disaggregated, the results of the hypotheses testing were no different. Moreover, {{\varvec{H}}}_{0}^{2} and {{\varvec{H}}}_{0}^{3} are not rejected in any of the subgroups defined by interactions of order 2 and 3. The results demonstrate that we could not find associated hiring biases to be significant, corroborating in favor of fairness in the formation of impressions about competence during candidate evaluations within the addressed population. However, caution should be exercised as the conclusions are based on the assumption that the responses of the participants are unbiased, the sample of participants is representative of the hiring personnel in the population, i.e. both random participants and invited as well as non-response are not associated with the biases in terms of evaluation. Finally, we assume that non-completed surveys are also orthogonal to the biases in evaluation.
4.2 Thematic Analysis
Thematic analysis was chosen for data analysis in this study since we aim to identify and analyze emerging patterns within the collected data. The unique identifier (EID) was employed for the 78 valid responses containing text in the final question, as each text corresponds to a single participant (evaluator). After reading the data, we identified specific text segments and labelled them. By applying constant comparison, we compared emerging codes with earlier codes and then the related codes were categorized into themes to reduce overlap between codes. Throughout our analysis, we record thoughts and ideas about the codes using free-form notes. It was useful to group subthemes and identify higher-order themes. Moreover, as the participants were Spanish speakers, we used a backward translation strategy to ensure the accuracy of the translation. This involves translating the content back from the target language into the original language.
Initially, two authors began the analysis using Excel. However, one of them later transitioned to NVivo, a qualitative data analysis platform, to leverage its specialized features and acquire a deeper understanding of the data. These authors engaged in discussions until a consensus was reached on the creation of codes, subthemes, and themes. To facilitate conflict resolution, a third author was involved as needed. The emerging coding scheme includes five themes, twelve sub-themes and sixty-eight codes. This qualitative coding scheme is available online in the replication package (Sánchez-Gordón et al. 2024). As the data originally was in Spanish, the analysis we conducted in that language, and then, we translated the codes and quotes into English to enable reporting and wider dissemination.
Table 7 illustrates an instance of the thematic analysis exemplified by a quote from the participant [EID 176949503] in the control group. Note that a single quote was categorized under multiple codes. Therefore, the frequencies are computed for related categories along with the unique identifier (EID), e.g., Codes (n = 3│1). As a result, we labelled 271 text segments from the 78 comments provided by the evaluators.
In what follows, we provide an overview of the demographic information of the participants and our findings grouped into the five themes that emerged from the data: Physical Appearance, Candidate Characteristics, Emotional Response, Evaluation Processes, and Human Factors as shown in Fig. 7.
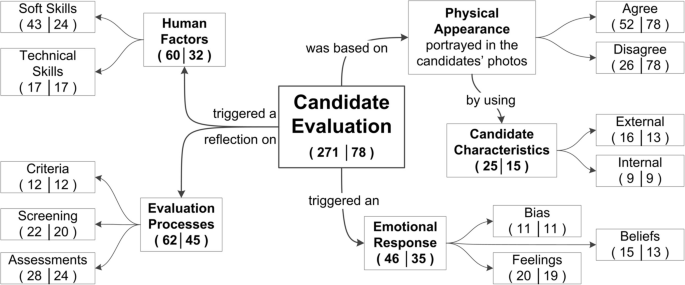
Overview of the thematic analysis results. Frequencies are calculated based on the occurrence of each category and the number of participants supporting each one (#category│#unique EID)
Demographic Information Overview
This information is reported along with the relative difference (ratio) in the number of participants between the thematic analysis and the previous one. For instance, there is a 60.4% decrease in the number of participants calculated as the difference between 78 and 197, divided by 197.
In the thematic analysis, the majority of participants identified as men (n = 64, 59.7%), while 14 (63.1%) identified as women. Note that the gender distribution of this sub-sample is similar to the previous analysis, 21.8% and 23.8%, respectively. The age of most participants (59, 57.5%) ranged from 26 to 45 years. Moreover, most of the participants reported an engineering degree (45, 65.3%) followed by a master’s degree (28, 49%), and the remaining (5, 58.3%) reported having other degrees.
Most participants (68, 58.2%) reported having more than one year of experience (mean = 7.25, SD = 6.02, range, 1–26) with about a third (10, 70.5%) reporting less than a year. Looking into the different industrial sectors, about a third (23, 69.7%) of participants worked in ICT, followed by Education (15, 34.7%), Financial (14, 57.5%), Government (5 vs 50%), and other sectors (21, 61.8%) including Telecommunications. The most reported job role was software developer (31, 64.7%), although analyst (12, 67.5%), project manager (16, 44.8%), tester (3, 57.1%), and architect (1, 80%) were also represented. In the category of others (15, 51.6%), we identify middle managers (3, 62.5%), academics (2, 66.6%) and other ICT-related roles (10, 41.1%). Among the respondents who have hiring experience, 76.9% (60, 58.9%) reported occasional (53, 58.5%) and frequent (7, 61.1%) involvement, while 23% (18, 64.7%) stated they had never been involved. Finally, the majority of the respondents (42, 62.1%) reported that candidates did not seem familiar to them, while the remaining (36, 58.14%) reported they were somehow familiar with the candidates.
This overview suggests a representative sub-sample that can provide insights into the earlier results of our statistical analysis. Figure 7 shows themes and sub-themes, with frequencies calculated based on the occurrence of each category and the number of participants supporting each one (#category│#unique EID), for example, Human factors (60│32). Further details are available in the supplementary material.
Physical Appearance
We identified that nearly one-third of the 78 participants disagreed with using the physical appearance portrayed in the candidates’ photos to rate their competence. For instance, [EID 178964317] claimed “I don’t think it’s right to judge developers based on their appearance”. The remaining participants agreed to rate candidates’ perceived competence. Moreover, although candidate evaluations prompted most participants —regardless of their level of agreement— to reflect on evaluation processes and candidates’ human factors, this effect was most common among those who disagreed.
Candidate Characteristics
This category comprises 15 participants and includes both external and internal characteristics used as clues to rate the perceived competence. For instance, [EID 177898791] stated “Based on a photo, one cannot evaluate [if candidates are] skillful, competent, or talented without having a parameter such as [their professional] experience, but one can evaluate [if they are] ambitious since everyone applies for the position to either change their job or improve their economic situation”. As expected, all participants who disagreed with the evaluation did not specify the candidate characteristics they used as clues, except for two participants in the experimental group [EID 178232883, 177859633]. They also mentioned external characteristics such as facial expressions and gaze, as well as internal characteristics like personality and trustworthiness. For example, [EID 178232883] claimed “From the visual point of view, the only thing I can focus on is [their] serious [candidates’ facial] features, [I believe] their gaze can also denote personality traits” whereas [EID 177859633] stated, “I chose based on their facial expressions, I gave the faces that I was confident in or those were the most serious the highest score”.
Among the 52 participants who agreed, only 13 provided insights into the candidates’characteristics that they used. One participant admitted [EID 178616122] “I have relied somewhat on ages, and the personality portrayed in the photo” while another mentioned [EID 176953086] “The clothing and the gaze are factors that I paid more attention to”. Therefore, we categorized age and dress style as external characteristics. Additionally, other participants tried to find clues about internal characteristics like personality traits [EID 178232883], determination [EID 179011283], empathy [EID 178622065], and confidence [EID 177567155].
Emotional Response
Throughout our analysis, we noticed emerging evidence suggesting that some participants (35) felt emotionally affected. This category was less evident than the others and emerged last. Sometimes, participants expressed their feelings and biases, whereas others shared their beliefs. For example, [EID 176957155] expressed a moral judgment and belief in meritocracy by asserting “[Candidates] are not judged on their appearance, only on [their] talent”. We noticed that all moral judgement emerged in the experimental group, except for [EID 177624461] who humbly admitted “I believe that my evaluations are of little value since the photo is not enough to derive a correct or fair assessment”.
We also observed that only eight participants in the control group identified familiarity bias as a factor influencing the candidates’ perceived competence, even though 36 out of 197 participants reported some degree of familiarity with the candidates. For instance, [EID 177040294] stated “The evaluation is very subjective, and since I know many candidates, I already have preconceived criteria about them, and possibly my responses may be biased”. In the experimental group, only one participant [EID 177012250] acknowledged this bias but not as a factor impacting perceived competence. Instead, the code pretendian emerged, as she claimed, “I would like to know why they wore Indigenous clothing if the evaluated [candidate], at least the one I know, is not Indigenous”. This caught our attention, as another participant [EID 177510659] affirmed “The photos are repeated, and they are not of the ethnicities” while reporting that candidates did not seem familiar to him. Since the photos are not duplicated, this suggests a cross-race effect, which refers to the phenomenon by which own-race faces are better recognized than faces of another race (Wong et al. 2020). Additionally, one participant, [EID 177670817], raised concerns about racist hiring practices by stating, “I disagree with attaching photos to CVs, as it can lead to deselection due to racism”. He also expressed discomfort, adding, “I felt a little upset participating in this survey because people should not be judged”.
Finally, 19 participants reflected on their feelings about the score, expressing that they found it challenging, subjective , inaccurate, unfair, subjective, and superficial. Additionally, another participant, [EID 177841940], suggested variability in the provided competence scores by noting, “The evaluation can vary according to their [candidates] communication skills”.
Evaluation Processes
This category includes the largest number of participants (45). Twelve participants mentioned aspects related to the criteria used. For instance, [EID 176925951] signalled job characteristics by saying “One of today’s abilities being analyzed is the ability to work in a team and proficiency in the English language” whereas [EID 177022155] added,”[I would like to] know in what they perform better”. Furthermore, a need to include participants from all racial backgrounds was highlighted by [EID 177900856] in the experimental group, who stated, “I don’t think only indigenous people [should be] evaluated, everybody should be evaluated”. Supporting this, another participant, [EID 177042505] in the control group suggested, “Add African American, Indigenous, foreign (Latin American and European nationalities) participants”.
Participants also expressed an interest in conducting candidate screening based on additional information. Fourteen participants in the control group mentioned Job-relevant information, Professional experience, Professional growth, Professional profile and Resume. [EID 178255299] illustrated it by saying “I need more information about the candidates. For example, I’d like to know more about their professional profile, their future aspirations as developers or programmers, things like that”. In the experimental group, we also identified six participants who mentioned all the previous additional information except for the Professional profile. Finally, we noted that twenty-four participants suggested in-depth candidate assessments. While some participants explicitly mentioned well-known approaches, i.e., Interviews, Knowledge-based tests, and Psychometric tests, others were less specific and stated other methods. In addition, we identified a need for Live interactions, for example, [EID 178285906] argued “To be able to evaluate the characteristics, I need to have a conversation; it’s easier for me that way”.
Human Factors
This category emerged from the comments regardless of participants’agreement level with using candidates’ photos to rate the perceived competence. Although Human Factors is closely related to the Evaluation Processes theme, we created a separate theme due to its relevance. Thirty-two participants explicitly mentioned a set of technical skills and soft skills they would like to evaluate before rating the perceived competence of the candidates. While only 9 participants mentioned both soft skills and technical skills, 15 others focused only on soft skills and an additional 8 emphasized only technical skills. For instance, [EID 176976210] claimed “What is really fundamental is their [candidate] technical preparation, their experience in software development projects, and their way of interacting with people”. While [EID 178615166] highlighted “When evaluating candidates from my perspective, I pay more attention to how they respond when presented with a question and how they communicate”, and [EID 177859104] added, “The evaluation should be in-person, with rigorous examinations in multiple programming languages”. Although we observed that some participants referenced soft skills or professional capability in a general sense, we identified a specific set of 21 soft skills with communication, goal orientation, learning agility, and teamwork frequently mentioned. Finally, apart from technical knowledge, the significance of English proficiency and specialized Knowledge about a regulatory framework were specifically emphasized by [EID 176925951] and [EID 176945502], respectively.
4.3 Summary
{H}_{0}^{1}: Evaluators perceive no difference in competence between job candidates wearing traditional and non-traditional clothing in professional photos, {H}_{a}^{1}: Alternative. Our results show that there is no sufficient evidence in support of the alternative hypothesis, and therefore the {H}_{0}^{1} hypothesis cannot be rejected. Although we observed notable evaluator discrepancies, a positive trend in the competence scores was also observed for almost all professionals wearing traditional clothing. This is confirmed by a significant random slope within each evaluator (ANOVA in R; χ2(1) = 223.82, p < 0.0001). Our findings align with previous studies in psychology like (Hehman et al. 2017; Sutherland et al. 2020), which have highlighted that inferences of competence are driven by the characteristics of the perceiver.
{H}_{0}^{2}: The gender and race of candidates do not moderate the effect of evaluators’perceptions of the candidates’competence, {H}_{a}^{2}: Alternative. Our results show non-significant interactions/moderation of candidates’ gender and race, and therefore the {H}_{0}^{2} hypothesis cannot be rejected. However, the top five competence scores were given to one male and four female professionals wearing traditional clothing.
({H}_{0}^{3}): The gender and hiring experience of evaluators do not moderate the effect of evaluators’perceptions of the candidates’ competence, {H}_{a}^{3}: Alternative. Our results show non-significant interactions/moderation of evaluators’ gender and hiring experience, and therefore the {H}_{0}^{3} hypothesis cannot be rejected. However, we observed that male evaluators tended to assign higher competence scores when compared to their female counterparts. Additionally, female evaluators exhibited a trend of perceiving female candidates as more competent when they were dressed in traditional clothing compared to other clothing choices.
We also conducted a thematic analysis of the final open question in our survey, with responses from 78 out of 197 participants. Of these, 43.5% displayed signals of being emotionally affected and 66.7% agreed to rate candidates perceived competence. However, only some of them (13, 25%) reported using external and internal characteristics as clues to rate the perceived competence. During the candidate evaluation, participants reflected on the criteria used and expressed a need for further information about the candidate, particularly human factors like technical and soft skills. They also showed an interest in evaluation processes and expressed an interest in conducting candidate screening based on additional information and suggested in-depth candidate assessments. It suggests a tendency to fairness in impression formation related to competence which supports the statistical analysis results.
5 Discussion
To answer our research question, Does a choice of dress style in a photograph influence software professionals’ evaluations of an Ecuadorian software developer’s competence? We developed a theoretical model and analyzed collected data using mixed models. Our findings suggest that the choice of dress style in a photograph did not influence software professionals’ evaluation of the software developers’ competence. However, while the effects in our sample do not reach statistical significance, there are indications that stereotypes may play a role. Moreover, the observed patterns of means and emotional responses seem to be aligned with the expectancy violation theory.
Software developer is a male-dominated occupation and despite being culturally embedded, gender stereotypes are fairly universal across Western countries (Birkelund et al. 2022). However, previous studies have revealed that contextual factors play a role in understanding unfair hiring practices (Lippens et al. 2023). Therefore, looking at the Indigenous population in northern Ecuador, we observed that 7.7% of the Ecuadorian population self-identified as Indigenous according to the last census data (INEC 2023) whereas 13.33% of students in the Faculty of Engineering and Applied Sciences at the Universidad Técnica del Norte self-identified as indigenous during the last academic year (Universidad Técnica del Norte 2024). It indicates a healthy representation of the indigenous population within this regional software industry, thereby offering a novel context compared to previous research on this topic.
In our sample, 74,1% (146 out of 197) participants were involved in the evaluation process of job candidates with 34 reporting management positions, i.e., project manager (27) and middle manager (7). This indicates that 112 non-managers have had the opportunity to raise their voices, including 20 of the less experienced participants. Based on our sample, the evaluation of job candidates seems a fair enough democratic process in terms of participation at least in this context. Supporting this, Filkuková and Jørgensen (2020) found that 50% of the participants were previously involved in hiring employees. While their study focused on comparing different facial expressions across the same set of IT professionals from a Norwegian institution, female candidates were still perceived as less competent than males as our findings in the control group. However, that study did not examine the effect of evaluators’ gender and candidates’ race.
Although effects from the dress manipulation (treatment) were observed, they did not reach statistical significance, resulting in a hypothesis {H}_{0}^{1} that cannot be rejected. We expected that candidates in the control group could strongly benefit from the treatment, especially Indigenous women candidates. However, we found the opposite pattern. Almost all candidates received a more favorable competence score in the experimental group than in the control group regardless of evaluators’ gender and hiring experience. Against our expectation, however, there also was by trend, more positive competence scores for Indigenous except for the negative effects on the perceived competence of the oldest candidate (C9, 44 years). This candidate received one of the third-highest competence scores (M = 56.64, SD = 19.07) within the control group. However, when compared to the experimental group (M = 53.69, SD = 21.05), he had the most negative difference score. Further analyses also confirmed that there was no significant interaction between candidates’ gender and race, nor was there a significant interaction between evaluators’ gender and hiring experience. Therefore, the {H}_{0}^{2} and {H}_{0}^{3} hypotheses cannot be rejected.
The thematic analysis results suggest that 60 out of the 197 participants in both experimental conditions try to limit the use of social cognition. This observation could partially counter the potential presence of social desirability bias. Since participants were aware of being observed, two forms of bias may have occurred. First, a selection bias where participants with racist or intolerant views may have avoided the study. Second, a social desirability bias among those who felt comfortable participating led them to express opinions aligned with what could be perceived as the “desirable” stance, such as supporting inclusivity towards underrepresented groups like Indigenous professionals. However, if social desirability would lead to more favorable evaluations, competence scores should have been more favorable for females in the control group, and the opposite was observed since software developer is a male-dominated occupation. In the experimental group, social desirability would lead to more favorable evaluations, but female candidates receive more extremely positive evaluations compared to male candidates. This observation suggests that when candidates violate stereotypes linked to a salient group category, such as race (Indigenous), the perceiver’s experience of unexpectedness may lead to more extreme overall evaluations.
Revisiting our findings, we observe that evaluators in both control and experimental groups were explicitly informed that all the candidates they would see were equally qualified for a position as a software developer, but evaluators perceived candidates differently. In the control group, evaluators perceived gender-based stereotypes as category-based expectancies, leading to lower competence scores for female candidates compared to male candidates. However, male evaluators’ ratings were only slightly more negative. In the experimental group, candidates of all genders received more positive competence evaluations when they violated stereotyped expectations for their race group (Indigenous), resulting in higher competence scores. However, dress manipulation induced more extreme evaluations of the competence scores of the candidates who violated stereotyped expectations. As a result, female candidates received even more favorite competence scores compared to male candidates. Although same-race bias could exist, it is unlikely to explain our findings as cross-race (evaluator-candidate) pairs are more prevalent in our sample than same-race pairs. Indeed, these observations suggest that stereotype expectancy effects provide a more straightforward explanation for observed patterns than social desirability. Our findings are consistent with the predictions of expectancy-violation theory (Burgoon 2015) but further research is needed to examine the effect of expectancy violations and minimize the viability of social desirability. Expectancy-violation theory posits that cross-race candidates frequently face lower expectations, and when they surpass these expectations, they are evaluated more positively (Moore et al. 2016).
Based on the correlations, we also observe notable evaluator discrepancies indicating varying judgments and outcomes that suggest systematic idiosyncrasy in line with evidence of striking perceiver differences found for competence/dominance in (Sutherland et al. 2020). Indeed, according to Hehman et al. (2017), dimensions related to inferences of character, such as dominance/competence, are driven more by perceiver characteristics. These authors also concluded that these idiosyncrasies are not noise or error, instead, they represent an important phenomenon in their own right but the extent of which varies depending on the domain of judgment. In this sense, our findings provide empirical evidence of this phenomenon within the SE context. Cross-cultural agreement on competence also reflects this pattern (Zebrowitz et al. 2012; Sutherland et al. 2017). It suggests that perceived competence might be less visually obvious (Hehman et al. 2017). In support of that, our thematic analysis results indicate that participants may have different candidate characteristics in mind, or they may even be envisioning different latent constructs to which different candidate characteristics apply. To one software professional, clues of competence may be seen in facial expressions, grooming or dress style, to another, it may be perceived as displaying confidence, determination or empathy. It supports the significant role that variability in both the perceiver (evaluator) and the target (candidate) plays in this context. Therefore, competence seems variable because these judgements are highly contextual as suggested by Sutherland et al. (2020). Indeed, we observed not only varied emotional responses based on participants’ beliefs, biases, and feelings but also diverse perspectives on evaluation processes and human factors they consider important for job candidates. A closer examination of the pretendian category underscores the challenge of discerning between Mestizo and Indigenous candidates in our sample based solely on facial traits, as only one of the 93 participants in the experimental group raised this concern.
An alternative explanation for the positive trend observed in the experimental group may be attributed to physical attractiveness. Dress manipulation can vary physical attractiveness as suggested by Lennon (1990). This, in turn, might be used as a cue for competence, ultimately leading to higher perceptions of competence. In this situation, the magnitude of the attractiveness effect is lower in studies with high than low job-relevant information (Nault et al. 2020). Our study had a decontextualized design to ensure experimental control, with little job-relevant information provided. Moreover, after stimulus creation, the Ecuadorian authors noted an effect related to clothing attractiveness but our pilot study did not compare candidates’ photos based on physical attractiveness. Even though the most studied concepts in dress manipulations have been dress, status, and attractiveness, attractiveness is the main social signal associated with physical appearance (Johnson et al. 2008). The perception of target’s attractiveness can be influenced by the target’s dress, which is almost inevitably interpreted in conjunction with the target face (Hester and Hehman 2023). Moreover, research on attractiveness discrimination has demonstrated that attractiveness could lead to higher perceptions of competence (Nault et al. 2020). The effects of attractiveness are related to a variety of real-world outcomes that can favor the more attractive over the less attractive. However, attractiveness and age, unlike competence, are clearly visible on the face (Rhodes 2006). Therefore, we cannot dismiss that the positive trend observed in the experimental group could be due to physical attractiveness. Although most participants (138/197, 70%) evaluated the candidates’ perceived competence based on their photos without apparent disagreement, only 15 of them provided details about the candidates’ characteristics.
Findings in our study are inconclusive, taking into account the sample we used. In the context of Ecuador, a country in which mestizo is the majoritarian group, the identification of a software professional with a specific indigenous communities is not influencing the perceived competence of the individual. However, in a highly global world in which global software development can be considered a global practice, this perception may vary in cases in which the observer is not a citizen of the sourcing country. Although authors aim to expand their work to study this phenomenon, one of the practical takeaways for software professionals is the need to include nationals from the sourcing countries to alleviate possible biases in selection processes. A second takeaway is related to the selection of clothes for professional photos. According to our study, and at least in a setup similar to the one used in our study, we can think that professional photos showing pertinence to indigenous communities are not influencing in perceived competence of these professionals, so, potential candidates can choose identitarian photos as professional photos without the risk of being biased in their competence.
Field experiments using photos need to ensure they can accurately evaluate photos for the range of factors that have been shown to affect judgments. The impact of different design features entails experimental design (within- vs. between evaluators designs), gender of both evaluators and candidates, presentation order of stimulus, and stimulus quality. Beyond non-odd photos, stimulus quality entails contextual scenario of the stimulus (plain white background), targets’ angle of view (fixed), facial expression (neutral expression), body region (head-to-shoulder framing), stimulus context (portrait), pose on photos (posture is straight and upright, with target shoulders relaxed and down). Although our research design considered all these features, we did not control the duration of exposure to the static stimuli. Moreover, there is a possibility that the responses received were influenced by some characteristics unintended by the researchers but conveyed by the photo such as attractiveness, personality traits, warmth, and trustworthiness. A takeaway for researchers is that attaching photos to CVs in applications for jobs not only introduces unobservable characteristics but also there are characteristics of a candidate that could be signalled in a photo or personal profile and play a role in hiring decisions. Moreover, it is worth noting that perceived competence is relevant beyond the hiring context. For example, accordingly Wang and Zhang (2019), competence as a dimension in the SCM model has significant impacts on the initial trust and cooperative behaviors of global software engineering team members when interacting with unfamiliar foreign collaborators. Given the collaborative nature of software development, the perceived competence of newcomers as unfamiliar collaborators represents another scenario in which social cognition may come into play.
5.1 Future Work
Given that our research design uses a scenario with equally qualified candidates, exploring scenarios that distinguish between skillful and unskillful candidates would be an interesting avenue for further research. Additionally, future work could explore the specific human and social capital advantages that software professionals’ characteristics might bring to organizations.
In particular, given that physical attractiveness is a popular research topic across a variety of disciplines (Nault et al. 2020) and the growing attention to attractiveness-based inequalities in the labor market (Kukkonen et al. 2024), we would like to explore the role of attractiveness advantage in software development. Nevertheless, it raises a question: Can an experimental approach be fully controlled when using photos? Given the various characteristics of an individual that can be introduced through a photo, it poses a great challenge to control for all variables. However, utilizing a photo-rating method could provide an ecologically valid approach as suggested by previous research on assessing physical attractiveness (Kaschel and Hildebrandt 2023).
This also raises the question of whether these photo-based first impressions would be generalized to a live encounter like the first interview. Observing a candidate either on a video or in real life provides us with much more information (e.g., movement and posture) that might be relevant for forming initial impressions, in particular about physical attractiveness (Kaschel and Hildebrandt 2023) but further research is needed to shed light on this. For instance, future studies should explore the reasons why female evaluators appear to pay more attention to peripheral cues of job candidates than male evaluators. A potential examination is that men may have stronger traditional racial stereotypes and less favorable attitudes toward racial egalitarianism than women. In this situation, it is worth also considering whether the intuitive accessibility of visual cues and participants’ belief that their judgments are accurate could contribute to this kind of behaviour. Moreover, although our findings showed that male evaluators provided higher overall competence scores, male candidates were rated more favorable than females in the control group while the opposite was observed in the treatment group. Thus, the intersection of racism and sexism in competence evaluation within the SE domain deserves further research. SE researchers exploring intersectionality (Sánchez-Gordón and Colomo-Palacios 2021; Boman et al. 2024), individuals as simultaneously members of multiple social identities like race and gender, highlight that the focus on a single dimension of identity fails to provide a nuanced understanding of their experiences. Finally, it would also be interesting for future work to explore the effect of richer stimuli such as a resume, letters of recommendation, information regarding past work, or the target’s self-description, in global south countries.
5.2 Deviations
Our study primarily follows the proposed design published in the registered report (Sánchez-Gordón et al. 2023), with a few deviations from the original study. These deviations are briefly described below.
Survey Design
We included a question about the industrial sector of the organization that the participants work in, to gain a better understanding of the specific context and challenges that they may face in their work environment.
Stimuli Creation
During the recruitment of photo models, the availability of the indigenous professionals posed a significant challenge, as some resided near their communities, distant from the photography sessions’ location. To address this, two other locations with similar conditions were established. However, we still found it hard to adhere to the age range constraint of 22 to 34 years. To achieve a balanced sample of indigenous men, we decided to include one willing participant who was 44 years old, despite falling outside the initial age range. Although models received digital copies of their photos as a token of appreciation, the evaluators were not offered any form of compensation for participating in the survey.
Data Cleaning
Twenty-eight responses were removed based on the extreme value scores (both high and low). The justification for this decision was supported by their comments in the final open-closed question. Fifteen responses were removed from the responses because their answers to competence scores indicated that they did not fill the survey seriously by putting lower scores on almost all candidates (average < 11), except for four who claimed that they cannot rate candidates’ perceived competence based on physical appearance, in particular, one put zero to all candidates and commented “I cannot judge the level of competence, ability or ambition based on a person’s appearance” [EID 177613864]. Additionally, two of the fifteen participants shared their thoughts, with [EID 178233394] mentioning, “I don’t know why it is more attached to Otavalo ethnic groups” and [EID 178137083] referring to the relevance of “problem- solving skill”.
On the contrary, thirteen responses were removed due to participants putting higher scores on almost all candidates (89 < average). Six of them [EID 177553305, 177587988, 178615905, 178626588, 177857475, 177510636] argued that candidates’ qualities should not be scored through photos, including one participant [EID 177510636] who followed this pattern, although six consecutive candidates were rated with lower scores (average = 79). A good example of this approach is given by [EID 177587988], who stated, “I believe that everybody is competent” whereas [EID 178626588] added that “All the people I saw [candidates] seemed excellent to me, and I would work with any of them”. Two additional participants with higher scores were also removed: one [EID 177873436] expressed discomfort, claiming, “What I did to score [candidates] is not correct because I rated them without knowing them” while another [EID 178618447] referenced physical appearance, remarking, “Being formal in photos says a lot about a person”. This “higher scores” pattern was also observed in five responses without comment, leading to their exclusion [EID 177592059, 177,868766, 177901972, 178138459, 177828913]. We also observed that one of these participants [EID 177868766] displayed signals of gender bias against men by consistently assigning scores around 90 for men compared to scores of 100 for women.
After a preliminary analysis, we noticed that a good number of participants (86 out of 197) reported familiarity with certain candidates. Although it was unexpected initially, it became evident that the current job market in this region is relatively limited. This suggests a high likelihood that software professionals in that region are familiar with each other. Consequently, rather than discarding these responses, we decided to explore the potential random effects of this variable over their perceived competence. We also observed that 20 out of 34 (58.8%) participants are novel software practitioners but they reported having been involved in candidates’ evaluation. Therefore, we kept the responses from novel software practitioners, i.e., less than a year of experience, to explore if there could be random effects. Although fourteen repeated measures could seem a small sample, it is worth noting that this mixed model design does not require more than seven measurements per individual (Vickers 2003).
Data Analysis
Hypotheses {H}_{0}^{2} and {H}_{0}^{3} were restated to predict no effect between variables, thus becoming null hypotheses with {H}_{a}^{2} and {H}_{a}^{3} acting as respective alternatives. Concerning competence, all four items were loaded onto a single factor (Avg_competence). After a preliminary analysis, we recruited the fifth author to assist with a more comprehensive data analysis. Deciding if an effect is fixed or random is not always clear-cut (Stroup 2012). In this study, we initially explored the treatment (manipulation of dress style) as a fixed effect. However, our analysis expanded to include not only candidates’ gender and race but also evaluators’gender and hiring experience, as well as their familiarity with the candidates. It means, in addition to the set of predictors in the registered report, we address familiarity of the candidates with evaluators as mentioned in the previous section.
As the mean competence value of our dataset is not normally distributed, Box-Cox transformation, a non-linear transformation, was applied to it. However, it is worth noting that the conclusions are exactly the same without this transformation. Analysis with and without transformation can be found in the supplementary R script (Sánchez-Gordón et al. 2024). Finally, robustness of the model was checked through Backward selection sequential using likelihood ratio tests implemented as the default choice in the step function of lmerTest (version 3.1–3) package in R. The finally selected model (5) did not have any fixed effects yet had the same set of random effects as the full model (3). The full model (3) did not perform better than the null model (5) in terms of the likelihood ratio test (ANOVA in R; χ2(26) = 22.025, p = 0.6873). The same is confirmed by the BIC information criterion and the adjusted R-squared ({R}_{adj}^{2}), where for model (3), BIC was 38,772.7 and {R}_{adj}^{2} was 0.6895, while for model (5), BIC was 38,659.25 and {R}_{adj}^{2} was 0.6902, respectively.
As a summary of statistical analysis, we did not reject {{\varvec{H}}}_{0}^{1}, {{\varvec{H}}}_{0}^{2} or {{\varvec{H}}}_{0}^{3}, moreover, none of the fixed effects in general was found significant. That said, the analysis of random effects revealed a large (over 64%) of the total variance being due to the variability across evaluators, hence additional unobserved covariates on evaluators, beyond those incorporated in our fixed effects, may be useful to explain the scores given by them.
5.3 Threats to Validity and Limitations
Several threats may have influenced the validity of this study. In this section, we describe limitations and elaborate on the strategies implemented to mitigate the threats.
Conclusion Validity
Threats arise when inadequate statistical tests lead to inaccurate inferences from the data. High conclusion validity is ensured in this study by using well-understood statistical tests on data that meets their assumptions. The LME models are robust in handling the multiple dependencies present in the data that cause violations when using ANOVA approaches as mentioned by (Graziotin et al. 2015). Although one threat lies in the relatively small sample size, repeated measures designs, 197 participants who evaluated 24 candidates each, do not require more than seven measurements per individual (Vickers 2003). In the case of novel software practitioners without hiring experience, there were fourteen measurements after removing invalid data. Moreover, given the nature of the repeated measurements and the selected statistical analysis, all 4,728 measurements are valuable.
The variability arising from individual differences among both evaluators and candidates is addressed by the LME model. The obtained statistical results for fixed effects possessed degrees of freedom between 96 and 4319, and the only significant on a 0.05 level of significance effect appeared to be the intercept with a t-statistics of 2.914 on 343 degrees of freedom corresponding to a p-value of 0.004. Three hypotheses were tested on the same dataset. Furthermore, we ran a Box-Cox transformation for our dependent variable since distribution was not perfectly normally distributed. In support of Open Science principles, we have made our reproducible R-code and raw data openly accessible on Figshare.
Internal Validity
Threats arise when experimental issues compromise the researcher’s ability to draw inferences from the data. Although high internal validity is suggested by the controlled nature of this study, we used self-reported measures for perceived competence which might be considered a limitation. The inclusion of photos may also potentially compromise the validity of the results in this study since there is a likelihood that the responses obtained were influenced by characteristics conveyed by the photos, which were unintentional but not controlled for in the research design. To mitigate this threat, the same candidates were presented in both experimental conditions. However, the dress manipulation was restricted to the traditional clothing worn by the Indigenous communities to which the Indigenous candidates belonged. Physical attractiveness emerged as a potential bias during the thematic analysis. Consequently, future research involving stimulus like photographs should address this factor.
Another limitation is that the study model does not include additional characteristics of the participants (evaluators), such as race. In particular, the participants’ race was not included due to potential concerns about social desirability. Even though participation was voluntary and anonymous to mitigate the influence of social desirability bias, the evaluators’ race was excluded from the survey design. This approach was chosen to reduce potential reactivity that could arise from asking participants about their ethnicity in the experimental group. Moreover, the evaluation time was reduced, and the evaluation order was fixed in this study to lessen respondent fatigue. However, since timestamp data was not collected, we cannot analyze evaluators’ varying attention to the likelihood of interruptions.
On the other hand, one might question the rationale behind our focus on software developers from a specific country and traditional attire from indigenous communities in its northern region. Note that our research focus is on social cognition and stereotypes which are shaped by the social context and reflect cultural beliefs. However, there remains the possibility of social desirability affecting the results. Furthermore, evaluators in a real recruitment screening situation may not face the same level of scrutiny as our participants, and other factors, such as a time limit and incentives to recommend candidates likely to succeed in later hiring stages, could also come into play. To limit social desirability in our study, we decided to design a survey that ensures anonymity and confidentiality while deliberately omitting any references to stereotypes. The feedback from the pilot test showed that the experiment design did not negatively influence the perceived competence of software developers. However, since the participants were aware that they were part of an experiment, they might have guessed its purpose and consequently adopted non-discriminatory behavior in response to the social pressure. Although it is not clear how accurate these perceptions are, our results are consistent with those of previous research using this approach.
External Validity
Threats arise from issues related to improper inferences from the sample data to other persons, settings, and situations. The statistical generalization of results is not possible since participants and candidates were not randomly selected from a population. It is thus unclear to what extent our sample is representative of a wider working population of software professionals in Ecuador. Despite that fact, all participants and candidates were software professionals. In particular, the stimuli used in our study resemble stimuli that participants encounter in real-world settings which is an important component of ecological validity. Nevertheless, generalization to more complex real-life scenarios is limited, and findings may not generalize to other types of populations and countries. Future research should focus on different populations in terms of individual characteristics beyond geographical distinctions.
Construct Validity
Threat might come from the perceived competence. Although Filkuková and Jørgensen (2020) used a single item based on a 7-point scale (1 = not competent at all; 7 = very competent), we selected a four-item scale adapted from Cuddy et al. (2009) by Strinić et al. (2021). This adaptation aimed to capture fixation more accurately by recognizing that varying judges may yield different results.
Another threat is related to the perceived indigeneity of the candidates. Traditional clothing varies according to the Indigenous community, and some participants could not be identified in a facial photograph, head and shoulders of the models only. To mitigate this threat, we chose Indigenous candidates from a region where traditional clothing is prevalent which ensures its familiarity among the local population.
6 Conclusion
We drew on an experiment about the perceived competence of software developers to investigate the consequences of dress manipulation in job applications in a Latin American country, like Ecuador. The effect on competence was positive but small, and it disappeared when evaluators were added to the statistical analysis.
Our findings suggest that dress manipulation in photographs hardly affects individuals’ perceived competence of candidates. Although it seems that gender and ethnic group membership matter, they have a non-significant effect. It is also possible that these characteristics worked as cues for attractiveness implicating that dress manipulation played a more indirect role. Therefore, physical attractiveness is an interesting research avenue, as it remains unexplored in the software engineering context.
Potential discriminatory behavior against minorities could be expected. Contrary to this expectation, we found that Ecuadorian software professionals are less likely to engage in direct phenotypic discrimination than in other regions (Polavieja et al. 2023) at least against Indigenous software professionals. Our findings also reveal that Indigenous candidates in our sample were not perceived as less competent than the majoritarian group (i.e. Mestizo) as they have clear visible similar phenotypes.
While at this stage we can only speculate about the reasons for these inconclusive findings, we suspect there might be interesting differences in the colonial legacies of the country studied that are worth exploring. For example, Spanish colonial powers in the Americas imposed more fluid ethno-racial boundaries compared to other European countries (McNamee 2020). Indeed, we found evidence that candidates’ appearance triggers positive discriminatory behaviour in our sample.
Data availability
A replication package including our (anonymous) dataset, instruments and analysis scripts is stored in the Fighshare open data archive at (Sánchez-Gordón et al. 2024). Due to privacy concerns, we do not make the candidates’photographs publicly available.
Notes
-
The Registered Report was accepted at the 17 th ACM/IEEE International Symposium on Empirical Software Engineering and Measurement (EMSE) and uploaded to arXiv.org; the report is available at.
https://doi.org/10.48550/arXiv.2308.14695.
-
We use the terms ethnicity and race interchangeably throughout this study since these terms are used to describe human diversity and they are irrevocably intertwined.
-
Please refer to Section 5.2 for deviations explanations.
References
-
Abbate J (2021) Coding Is Not Empowerment. In: Mullaney TS, Peters B, Hicks M, Philip K (eds) Your Computer Is on Fire. The MIT Press, pp 253–272
-
Alfrey L, Twine FW (2017) Gender-Fluid Geek Girls: Negotiating Inequality Regimes in the Tech Industry. Gend Soc 31:28–50. https://doi.org/10.1177/0891243216680590
-
Baert S (2018) Facebook profile picture appearance affects recruiters’ first hiring decisions. New Media Soc 20:1220–1239. https://doi.org/10.1177/1461444816687294
-
Baltes S, Park G, Serebrenik A (2020) Is 40 the new 60? How popular media portrays the employability of older software developers. IEEE Software 37:26–31. https://doi.org/10.1109/MS.2020.3014178
-
Belmi P, Pfeffer J (2018) The effect of economic consequences on social judgment and choice: Reward interdependence and the preference for sociability versus competence. J Organ Behav 39:990–1007. https://doi.org/10.1002/job.2274
-
Birkelund GE, Lancee B, Larsen EN et al (2022) Gender Discrimination in Hiring: Evidence from a Cross-National Harmonized Field Experiment. Eur Sociol Rev 38:337–354. https://doi.org/10.1093/esr/jcab043
-
Blincoe K, Springer O, Wrobel MR (2019) Perceptions of Gender Diversity’s Impact on Mood in Software Development Teams. IEEE Softw 36:51–56. https://doi.org/10.1109/MS.2019.2917428
-
Boman L, Andersson J, De Oliveira Neto FG (2024) Breaking barriers: investigating the sense of belonging among women and non-binary students in software engineering. In: Proceedings of the 46th international conference on software engineering: software engineering education and training. ACM, Lisbon Portugal, pp 93–103. https://doi.org/10.1145/3639474.364007
-
Burgoon JK (2015) Expectancy violations theory. In: The international encyclopedia of interpersonal communication. John Wiley & Sons, Ltd, pp 1–9. https://doi.org/10.1002/9781118540190.wbeic102
-
Campero S (2021) Hiring and Intra-occupational Gender Segregation in Software Engineering. Am Sociol Rev 86:60–92. https://doi.org/10.1177/0003122420971805
-
Campero S (2023) Racial disparities in the screening of candidates for software engineering internships. Soc Sci Res 109:102773. https://doi.org/10.1016/j.ssresearch.2022.102773
-
Chattopadhyay S, Ford D, Zimmermann T (2021) Developers Who Vlog: Dismantling Stereotypes through Community and Identity. Proc ACM Hum-Comput Interact 5:1–33. https://doi.org/10.1145/3479530
-
Coleman DM, Dossett LA, Dimick JB (2021) Building high performing teams: Opportunities and challenges of inclusive recruitment practices. J Vasc Surg 74:86S-92S. https://doi.org/10.1016/j.jvs.2021.03.054
-
Correll SJ, Benard S, Paik I (2007) Getting a Job: Is There a Motherhood Penalty? Am J Sociol 112:1297–1338. https://doi.org/10.1086/511799
-
Cuddy AJC, Fiske ST, Glick P (2004) When Professionals Become Mothers, Warmth Doesn’t Cut the Ice. J Soc Issues 60:701–718. https://doi.org/10.1111/j.0022-4537.2004.00381.x
-
Cuddy AJC, Fiske ST, Kwan VSY et al (2009) Stereotype content model across cultures: towards universal similarities and some differences. Br J Soc Psychol 48:1–33. https://doi.org/10.1348/014466608X314935
-
Curtis B (1984) Fifteen years of psychology in software engineering: individual differences and cognitive science. In: Proceedings of the 7th international conference on software engineering (ICSE ’84). IEEE Press, Orlando, Florida, pp 97–106
-
Dagan E, Sarma A, Chang A, et al (2023) Building and sustaining ethnically, racially, and gender diverse software engineering teams: a study at google. In: Proceedings of the 31st ACM joint european software engineering conference and symposium on the foundations of software engineering (ESEC/FSE). ACM, San Francisco, CA, pp 631–643. https://doi.org/10.1145/3611643.3616273
-
Demidenko E (2013) Mixed models: theory and applications with R, 2nd edn. Wiley
-
Fagerholm F, Felderer M, Fucci D et al (2022) Cognition in Software Engineering: A Taxonomy and Survey of a Half-Century of Research. ACM Comput Surv 54(1–226):36. https://doi.org/10.1145/3508359
-
Filkuková P, Jørgensen M (2020) How to pose for a professional photo: The effect of three facial expressions on perception of competence of a software developer. Australian Journal of Psychology 1–10. https://doi.org/10.1111/ajpy.12285
-
Fiske ST, Cuddy AJC, Glick P, Xu J (2002) A model of (often mixed) stereotype content: Competence and warmth respectively follow from perceived status and competition. J Pers Soc Psychol 82:878–902. https://doi.org/10.1037/0022-3514.82.6.878
-
Fiske ST, Cuddy AJC, Glick P (2007) Universal dimensions of social cognition: warmth and competence. Trends Cogn Sci 11:77–83. https://doi.org/10.1016/j.tics.2006.11.005
-
Fiske ST, Bergsieker HB, Russell AM, Williams L (2009) IMAGES OF BLACK AMERICANS: Then, “Them”, and Now, “Obama!” Du Bois Rev 6:83–101. https://doi.org/10.1017/S1742058X0909002X
-
Freire G, Schwartz Orellana SD, Zumaeta Aurazo M, et al (2015) Indigenous Latin America in the twenty-first century: the first decade. The World Bank. https://documents1.worldbank.org/curated/en/145891467991974540/pdf/Indigenous-Latin-America-in-the-twenty-first-century-the-first-decade.pdf. Accessed 4 Apr 2024
-
Graziotin D, Wang X, Abrahamsson P (2015) Do feelings matter? On the correlation of affects and the self-assessed productivity in software engineering. Journal of Software: Evolution and Process 27:467–487. https://doi.org/10.1002/smr.1673
-
Green P, MacLeod CJ (2016) SIMR: an R package for power analysis of generalized linear mixed models by simulation. Methods Ecol Evol 7:493–498. https://doi.org/10.1111/2041-210X.12504
-
Harris LT (2021) Leveraging cultural narratives to promote trait inferences rather than stereotype activation during person perception. Soc Personal Psychol Compass 15:. https://doi.org/10.1111/spc3.12598
-
Hehman E, Sutherland CAM, Flake JK, Slepian ML (2017) The unique contributions of perceiver and target characteristics in person perception. J Pers Soc Psychol 113:513–529. https://doi.org/10.1037/pspa0000090
-
Hester N, Hehman E (2023) Dress is a Fundamental Component of Person Perception. Pers Soc Psychol Rev 27:414–433. https://doi.org/10.1177/10888683231157961
-
Imtiaz N, Middleton J, Chakraborty J, et al (2019) Investigating the effects of gender bias on GitHub. In: Proceedings of the 41st international conference on software engineering (ICSE). IEEE Press, Montreal, Quebec, Canada, pp 700–711. https://doi.org/10.1109/ICSE.2019.00079
-
INEC (2023) Censo ecuador. In: Resultados – censo ecuador. https://www.censoecuador.gob.ec/public/Boletin_Nacional.htm#417_Pueblos_y_Nacionalidades. Accessed 4 Apr 2024
-
Jacobson J, Gruzd A (2020) Cybervetting job applicants on social media: the new normal? Ethics Inf Technol 22:175–195. https://doi.org/10.1007/s10676-020-09526-2
-
Johnson P (2016) GLMMmisc: Miscellaneous functions for GLMMs . R package version 0.1.1, commit 5ee60a17a6f8de0383df242e61081ce65491dbf8. https://github.com/pcdjohnson/GLMMmisc. Accessed 14 Nov 2024
-
Johnson KKP, Yoo J-J, Kim M, Lennon SJ (2008) Dress and Human Behavior: A Review and Critique. Cloth Text Res J 26:3–22. https://doi.org/10.1177/0887302X07303626
-
Kanij T, Grundy J, McIntosh J, et al (2022) A new approach towards ensuring gender inclusive SE job advertisements. In: Proceedings of the 2022 ACM/IEEE 44th international conference on software engineering (ICSE ’22). ACM, Pittsburgh Pennsylvania, pp 1–11. https://doi.org/10.1145/3510458.3513016
-
Kaschel P, Hildebrandt L (2023) Can Beauty be Measured with Photos? A Systematic Review and Meta-Analysis on Static and Dynamic Physical Attractiveness Ratings. Int Rev Social Psychol 36:5. https://doi.org/10.5334/irsp.758
-
Konrath S, Handy F (2021) The Good-looking Giver Effect: The Relationship Between Doing Good and Looking Good. Nonprofit Volunt Sect Q 50:283–311. https://doi.org/10.1177/0899764020950835
-
Kukkonen I, Pajunen T, Sarpila O, Åberg E (2024) Is beauty-based inequality gendered? A systematic review of gender differences in socioeconomic outcomes of physical attractiveness in labor markets. Eur Soc 26:117–148. https://doi.org/10.1080/14616696.2023.2210202
-
Kuznetsova A, Brockhoff PB, Bojesen Christensen RH, Pødenphant Jensen S (2020) CRAN – Package lmerTest. https://cran.r-project.org/web/packages/lmerTest/lmerTest.pdf
-
Lenberg P, Feldt R, Wallgren LG (2015) Behavioral software engineering: A definition and systematic literature review. J Syst Softw 107:15–37. https://doi.org/10.1016/j.jss.2015.04.084
-
Lennon SJ (1990) Effects of Clothing Attractiveness on Perceptions. Home Econ Res J 18:303–310. https://doi.org/10.1177/1077727X9001800403
-
Lippens L, Dalle A, Dhondt F et al (2023) Understanding ethnic hiring discrimination: A contextual analysis of experimental evidence. Labour Econ 85:102453. https://doi.org/10.1016/j.labeco.2023.102453
-
Livingston NJ, Gurung RAR (2019) Trumping Racism: The Interactions of Stereotype Incongruent Clothing, Political Racial Rhetoric, and Prejudice Toward African Americans. PsiChiJournal 24:52–60. https://doi.org/10.24839/2325-7342.JN24.1.52
-
Lunn S, Ross M (2021) Ready to work: evaluating the role of community cultural wealth during the hiring process in computing. In: 2021 conference on research in equitable and sustained participation in engineering, computing, and technology (RESPECT). pp 1–11. https://doi.org/10.1109/RESPECT51740.2021.9620686
-
Martin D, Cunningham SJ, Hutchison J et al (2017) How societal stereotypes might form and evolve via cumulative cultural evolution. Soc Pers Psychol Compass 11:e12338. https://doi.org/10.1111/spc3.12338
-
Matthiesen S, Bjørn P, Trillingsgaard C (2023) Implicit bias and negative stereotyping in global software development and why it is time to move on! J Software: Evolution Process 35:e2435. https://doi.org/10.1002/smr.2435
-
McNamee L (2020) Colonial Legacies and Comparative Racial Identification in the Americas. Am J Sociol 126:318–353. https://doi.org/10.1086/711063
-
Menezes Á, Prikladnicki R (2018) Diversity in software engineering. In: Proceedings of the 11th international workshop on cooperative and human aspects of software engineering (CHASE). ACM, New York, NY, pp 45–48. https://doi.org/10.1145/3195836.3195857
-
Min H, Hu Y (2022) Revisiting the effects of smile intensity on judgments of warmth and competence: The role of industry context. Int J Hospitality Manag 102:103152. https://doi.org/10.1016/j.ijhm.2022.103152
-
Moore O, Susskind A, Livingston B (2016) How Bias Affects Affirmative Action in Hiring. Center for Hospitality Research 16:
-
Nagy Z (2019) Your Online and Offline Presence. In: Nagy Z (ed) Soft Skills to Advance Your Developer Career: Actionable Steps to Help Maximize Your Potential. Apress, Berkeley, CA, pp 105–153
-
Nault KA, Pitesa M, Thau S (2020) The Attractiveness Advantage At Work: A Cross-Disciplinary Integrative Review. ANNALS 14:1103–1139. https://doi.org/10.5465/annals.2018.0134
-
Nisbett RE, Wilson TD (1977) The halo effect: Evidence for unconscious alteration of judgments. J Pers Soc Psychol 35:250–256. https://doi.org/10.1037/0022-3514.35.4.250
-
Oliveira T, Barcomb A, Santos RDS, et al (2024) Navigating the path of women in software engineering: from academia to industry. In: Proceedings of the 46th international conference on software engineering (ICSE). ACM, Lisbon Portugal, pp 154–165. https://doi.org/10.1145/3639475.3640100
-
Polavieja JG, Lancee B, Ramos M et al (2023) In your face: a comparative field experiment on racial discrimination in Europe. Soc Econ Rev 21:1551–1578. https://doi.org/10.1093/ser/mwad009
-
Ravindran T (2021) The power of phenotype: toward an ethnography of pigmentocracy in andean bolivia. J Latin Ame Caribbean Anthropol 26:219–236. https://doi.org/10.1111/jlca.12551
-
Rhodes G (2006) The evolutionary psychology of facial beauty. Annu Rev Psychol 57:199–226. https://doi.org/10.1146/annurev.psych.57.102904.190208
-
Ripley B, Venables B, Bates DM, et al (2024) MASS: Support Functions and Datasets for Venables and Ripley’s MASS. https://cran.r-project.org/web/packages/MASS/index.html
-
Rodríguez-Pérez G, Nadri R, Nagappan M (2021) Perceived diversity in software engineering: a systematic literature review. Empir Software Eng 26:102. https://doi.org/10.1007/s10664-021-09992-2
-
Sánchez-Gordón M, Colomo-Palacios R (2021) A framework for intersectional perspectives in software engineering. In: 2021 IEEE/ACM 13th international workshop on cooperative and human aspects of software engineering (CHASE). IEEE, Madrid, Spain, pp 121–122. https://doi.org/10.1109/CHASE52884.2021.00025
-
Sánchez-Gordón M, Colomo-Palacios R, Guevara-Vega C, Quiña-Mera A (2023) The effect of stereotypes on perceived competence of indigenous software practitioners: a professional photo. https://arxiv.org/abs/2308.14695
-
Sánchez-Gordón M, Colomo-Palacios R, Guevara-Vega C, et al (2024) Online Resource: The Effect of Stereotypes on Perceived Competence of Indigenous Software Practitioners. https://doi.org/10.6084/m9.figshare.25809850
-
Silveira KK, Prikladnicki R (2019) A systematic mapping study of diversity in software engineering: a perspective from the agile methodologies. In: Proceedings of the 12th international workshop on cooperative and human aspects of software engineering (CHASE). IEEE Press, Piscataway, NJ, pp 7–10. https://doi.org/10.1109/CHASE.2019.00010
-
Strinić A, Carlsson M, Agerström J (2021) Multiple-group membership: warmth and competence perceptions in the workplace. J Bus Psychol 36:903–920. https://doi.org/10.1007/s10869-020-09713-4
-
Strinić A, Carlsson M, Agerström J (2022) Occupational stereotypes: professionals´ warmth and competence perceptions of occupations. Pers Rev 51:603–619. https://doi.org/10.1108/PR-06-2020-0458
-
Stroup WW (2012) Generalized linear mixed models: modern concepts, methods and applications. Taylor & Francis, United Kingdom
-
Sutherland CAM, Young AW, Rhodes G (2017) Facial first impressions from another angle: How social judgements are influenced by changeable and invariant facial properties. Br J Psychol 108:397–415. https://doi.org/10.1111/bjop.12206
-
Sutherland CAM, Rhodes G, Burton NS, Young AW (2020) Do facial first impressions reflect a shared social reality? Br J Psychol 111:215–232. https://doi.org/10.1111/bjop.12390
-
Thomas JO, Joseph N, Williams A, et al (2018) Speaking truth to power: exploring the intersectional experiences of black women in computing. In: 2018 research on equity and sustained participation in engineering, computing, and technology (RESPECT). pp 1–8. https://doi.org/10.1109/RESPECT.2018.8491718
-
United Nations (2007) Discrimination against indigenous peoples: the Latin American context. United Nations. https://www.un.org/en/chronicle/article/discrimination-against-indigenous-peoples-latin-american-context. Accessed 28 May 2023
-
Universidad Técnica del Norte (2024) UTN en Cifras – Ficha Socioeconómica. https://cloud2.utn.edu.ec/ords/f?p=224:6 Accessed 31 Mar 2024
-
van Breukelen S, Barcomb A, Baltes S, Serebrenik A (2023) “STILL AROUND”: experiences and survival strategies of veteran women software developers. In: Proceedings of the 45th international conference on software engineering. IEEE Press, Melbourne, Victoria, Australia, pp 1148–1160. https://doi.org/10.1109/ICSE48619.2023.00103
-
Van Vugt M, Grabo AE (2015) The many faces of leadership: an evolutionary-psychology approach. Curr Dir Psychol Sci 24:484–489. https://doi.org/10.1177/0963721415601971
-
Vasilescu B, Filkov V, Serebrenik A (2015) Perceptions of diversity on git hub: a user survey. In: 2015 IEEE/ACM 8th international workshop on cooperative and human aspects of software engineering (CHASE). pp 50–56. https://doi.org/10.1109/CHASE.2015.14
-
Veit S, Arnu H, Di Stasio V et al (2022) The “Big Two” in hiring discrimination: evidence from a cross-national field experiment. Pers Soc Psychol Bull 48:167–182. https://doi.org/10.1177/0146167220982900
-
Venables WN, Ripley BD (2002) Modern Applied Statistics with S, 4th edn. Springer, New York, NY
-
Vickers AJ (2003) How many repeated measures in repeated measures designs? Statistical issues for comparative trials. BMC Med Res Methodol 3:22. https://doi.org/10.1186/1471-2288-3-22
-
Wang H, Zhang R, Ding L, Mei X (2022) Consistency matters: The interaction effect of grooming and dress style on hirability. Int J Sel Assess 30:545–561. https://doi.org/10.1111/ijsa.12399
-
Wang Y, Redmiles D (2019) Implicit gender biases in professional software development: an empirical study. In: 2019 IEEE/ACM 41st international conference on software engineering (ICSE). pp 1–10. https://doi.org/10.1109/ICSE-SEIS.2019.00009
-
Wang Y, Zhang M (2019) Country stereotypes, initial trust, and cooperation in global software development teams. In: 2019 ACM/IEEE 14th international conference on global software engineering (ICGSE). pp 152–161. https://doi.org/10.1109/ICGSE.2019.00036
-
Willis J, Todorov A (2016) First impressions: making up your mind after a 100-Ms exposure to a face. Psychol Sci 17:592–598. https://doi.org/10.1111/j.1467-9280.2006.017
-
Wong HK, Stephen ID, Keeble DRT (2020) The Own-Race Bias for Face Recognition in a Multiracial Society. Front Psychol 11:208. https://doi.org/10.3389/fpsyg.2020.00208
-
World Economic Forum (2024) Global gender gap report 2024. World Economic Forum. https://www3.weforum.org/docs/WEF_GGGR_2024.pdf. Accessed 15 Oct 2024
-
Yang N, Li H, Criswell LA et al (2005) Examination of ancestry and ethnic affiliation using highly informative diallelic DNA markers: application to diverse and admixed populations and implications for clinical epidemiology and forensic medicine. Hum Genet 118:382–392. https://doi.org/10.1007/s00439-005-0012-1
-
Zebrowitz LA, Wang R, Bronstad PM et al (2012) First Impressions From Faces Among U.S. and Culturally Isolated Tsimane’ People in the Bolivian Rainforest. J Cross Cult Psychol 43:119–134. https://doi.org/10.1177/0022022111411386
Acknowledgements
We would like to thank the software professionals for their time and input.
Funding
Open access funding provided by Ostfold University College.
Ethics declarations
Ethical approval
This study was in line with the institutional guidelines of the universities involved in this study.
Informed consent
Participants provided informed consent before the survey.
Conflict of interests/competing interests
The authors declared that they have no conflict of interest.
Clinical trial number
Not applicable.
Additional information
Communicated by: Fabio Silva and Michael Felderer
Publisher’s Note
Springer Nature remains neutral with regard to jurisdictional claims in published maps and institutional affiliations.
This article belongs to the Topical Collection: Special Issue on Registered Reports
Rights and permissions
Open Access This article is licensed under a Creative Commons Attribution 4.0 International License, which permits use, sharing, adaptation, distribution and reproduction in any medium or format, as long as you give appropriate credit to the original author(s) and the source, provide a link to the Creative Commons licence, and indicate if changes were made. The images or other third party material in this article are included in the article’s Creative Commons licence, unless indicated otherwise in a credit line to the material. If material is not included in the article’s Creative Commons licence and your intended use is not permitted by statutory regulation or exceeds the permitted use, you will need to obtain permission directly from the copyright holder. To view a copy of this licence, visit http://creativecommons.org/licenses/by/4.0/.
Reprints and permissions
About this article
Cite this article
Sánchez-Gordón, M., Colomo-Palacios, R., Guevara-Vega, C. et al. The effect of stereotypes on perceived competence of indigenous software practitioners: a study of dress style in professional photos. Empir Software Eng 30, 137 (2025). https://doi.org/10.1007/s10664-025-10675-5
- Accepted
- Published
- DOI https://doi.org/10.1007/s10664-025-10675-5
Keywords
- Software developer
- Stereotypes
- Perception of competence
- Impression formation
- Social cognition
- Indigenous