Article Content
Abstract
In response to the rise in petrol prices following the invasion of Ukraine on 24 February 2022, the Spanish government introduced a fuel subsidy of €0.2 per litre from April to December 2022. Using weekly petrol price data, we estimate a difference-in-differences model, with European Union countries that did not introduce measures as the control group, to determine the potential price effects of both the subsidy and its impact after its removal. The causal analysis leads to several conclusions. First, the subsidy increased the net price of diesel by €0.0527 per litre. Petrol 95 does not appear to have changed significantly with the introduction of the subsidy. Secondly, diesel prices return to their pre-subsidy equilibrium when the subsidy is removed, so there does not seem to be any asymmetry in the pass-through. Finally, the pass-through was 73.65% for diesel and we cannot reject 100% in the case of petrol 95. Estimates confirm that at least 857 million euros of public funds were retained by the petrol companies, i.e. 23.8% of the total subsidy cost for diesel.
Explore related subjects
Discover the latest articles and news from researchers in related subjects, suggested using machine learning.
- Energy and Society
- Energy Policy, Economics and Management
- Energy Supply and Demand
- Microeconomics
- Policy Evaluation
- Public Finance
1 Introduction
The rise in energy costs since Russia’s invasion of Ukraine in 2022 has affected prices in all European countries. This is partly because Russia both produces and exports energy products, including oil and refined fuels, but also because the war may have led to a reduction in supply on the energy market and created uncertainty about supply capacity, which may have affected equilibrium prices. In this context, most European countries chose to reduce excise duties on fuels (Croatia, Cyprus, Ireland, Belgium, France, Italy, Germany, the Netherlands and Luxembourg), while others chose to introduce a subsidy (Bulgaria, Greece, Portugal, Spain and Romania). In this respect, pass-through is a relevant issue for these public interventions as it defines how much of the public money reaches the consumer and therefore measures the effectiveness of the policy.
Despite the repeated use of tax changes to influence the price of different products, the pass-through to the final consumer is very heterogeneous, sometimes even above 100% (Besley and Rosen 1999; Anderson et al. 2001), and depends on several factors such as the business cycle (Poterba 1996), market structure (Carbonnier 2007), size of firms (Kosonen 2015) or their vertical relationship (Fuest et al. 2024). The pass-through may not only be incomplete, but also asymmetric (Benzarti et al. 2020), or it may affect the level of equity (Gaader 2019). Recently, Benzarti et al. (2024) show that changes in indirect taxes on food in Argentina were transmitted asymmetrically to final prices until price cap measures against speculation were implemented, when the transmission rate became symmetric.
In the case of the gasoline market, inelastic fuel demand (Brons et al. 2008) combined with the accumulation/concentration of market power in a smaller number of firms (Weyl and Fabinger 2013; Ganapati et al. 2020; Genakos and Pagliero 2022) could mean that the subsidy pass-through is not close to 100%.Footnote1 Indeed, the empirical evidence suggests otherwise. A seminal paper on the gasoline market by Chouniard and Perloff (2004) shows that the lower the share of government consumption at the national level, the higher the residual elasticity of supply. Therefore, states with lower consumption will have a higher pass-through. The results of the empirical analysis confirm this result and show that the pass-through for an average state is 100%, while federal tax increases are passed on to consumers at only 50% in the United States. A very similar result was found by Doyle and Samphantharak (2008), who found that the removal of the fuel tax in Illinois and Indiana was passed on to final prices by only 70%. However, when the tax was reinstated, prices increased by 80–100% of the tax. This paper also shows that stations with lower levels of competition and those located near the border with other states passed on the tax reduction to a lesser extent. Kopczuk et al. (2016) find a 91.4% pass-through of gasoline taxes in the United States, which is lower when the retail segment is taxed. Another paper finding incomplete pass-through is Harju et al. (2022). The authors show how the fuel tax changes introduced in Finland in 2012 were 100% passed through to the final price in rural areas, but only around 77% in urban areas.
However, there is less empirical evidence on the possible effect of temporary tax reductions (or subsidies) on the gasoline market. The most recent empirical evidence, analysing the initial stage of the Ukrainian War, shows 100% pass-through in some countries. Drolsbach et al (2023) analyse through a staggered difference-in-differences, the percentage of the tax reduction transferred to final prices in France, Germany and Italy. They use a daily database at service station level, from January to August 2022, and Austria, Estonia, Latvia and Lithuania as a control group. The results show that the pass-through is heterogeneous, although in all cases it is close or just over 100%. Very similar result finds Schmerer and Hansen (2023) and also Dovern et al. (2023) for the German case. Finally, Jiménez et al. (2022) analyse the pass-through of the different tax-cuts and subsidies introduced in petrol market in Europe after the invasion of Ukraine. They focus only on the first months of these measures and do not study, in any case, what happens to prices after the removal of those public interventions. They found that the lower levels of taxes the lower levels of pass-through.
Our paper examines the impact that the €0.2 subsidy of 29 March 2022 (RDL 6/2022) may have had on the price paid by consumers in Spain, both for diesel and 95 octane petrol (hereinafter, petrol 95). The implementation of this subsidy was abolished on 31 December 2022, and according to García-Miralles (2023), involved an expected budgetary cost of between 4900 and 5500 million euros.
We have a weekly database for Spain and for some EU countries where no measures have been introduced that could affect prices (neither tax changes nor the introduction of subsidies). The period ranges from November 2021 to May 2023, five months before and after the introduction and removal of subsidies for non-professional consumers, respectively. The methods used are both static and dynamic difference-in-differences estimation, with countries that do not introduce measures forming the control group (Austria, the Czech Republic, Denmark, Estonia, Finland, Latvia, Lithuania and Slovakia).
This paper’s main contributions are in first place estimate the causal effect of the subsidy introduced in Spain not only during the subsidy period, but also the post-subsidy price change. In a novel way, we will be able to analyse whether, once the subsidy was removed, prices returned to the equilibrium level prior to its introduction. The possible existence of pass-through asymmetries in the introduction and subsequent elimination of taxes or subsidies has been previously analysed (Doyle and Samphantharak 2008; or Benzarti et al. 2024), but there is not empirical evidence for either the Spanish case or for the rest of the European countries. Only the paper of Dovern et al (2023) for the German case incorporates price information one week after eliminating the subsidy but does not carry out any type of analysis on the effects of the elimination, or the possible existence of asymmetries in the pass-through. We consider that it may be of interest to know whether part of the possible effects of the subsidy on prices have been maintained over time, generating a permanent effect, or whether, on the contrary, prices have returned to the equilibrium prior to its introduction. Finally, we are able to make the distinction between petrol and diesel. The difference in supply and demand elasticities between both products suggests that the pass-through of the subsidy can be different.
In the case of Spain, there is very little empirical evidence on the effect of this subsidy. Hidalgo et al. (2022) use a discontinuity regression model to show that the introduction of the subsidy increased the net price of diesel by €0.0352 and the price of 95 octane petrol by €0.007 in the first few months of its implementation. Moral (2023) came to similar conclusions using the same methodology, but with smaller values. In this case, the price of diesel would have increased by €0.023 without the subsidy and the price of petrol 95 would have increased by €0.02 without the subsidy. Similar results are found by Balaguer and Ripollés (2024) using a nonlinear autoregressive distributed lag error correction model. While the pass-through for petrol would be 100%, for diesel, it would be 75% for the three main companies and below 70% for independent retailers.Footnote2
Our paper makes a number of contributions to these three papers: The causal methodology used (difference-in-differences instead of regression discontinuity), the methodology that allows us to observe the dynamic effects both during and in the post-removal period, the analysis of potential asymmetries and the fiscal cost of the measure. Our results show that for petrol 95, we cannot reject the hypothesis that the pass-through was 100%, i.e. we have not found any statistically significant price effects. Only in some estimates, do we find a 2 cent increase in the price of petrol 95, a pass-through of 90%. In the case of diesel, however, the net price paid by the consumer increased by €0.0527, i.e. the pass-through was 73.65%. Market power and low demand elasticity can explain this result. The higher elasticity of demand and the lower elasticity of supply can explain the different result for petrol and diesel. As will be explained in detail in the results section, there is empirical evidence that the elasticity of demand for diesel is lower than for petrol 95, while the opposite is true for the elasticity of supply, suggesting that the pass-through should be higher in the case of petrol, as our results show. We also find that prices in the post-subsidy period are not different from the initial ones, which means that once the subsidy is removed, prices return to the pre-subsidy equilibrium in the case of diesel. This second analysis would confirm the price effect found.
The monthly analysis shows that the effect is relatively similar throughout the subsidy period in the case of diesel. The estimation of the dynamic model (leads-and-lags) shows that all months before and after the subsidy are not significantly different from the reference period, November 2021, the first month of the sample. However, the months affected by the subsidy are for the most part significant, with a value similar to that obtained in the average analysis. Moreover, the results are robust to changes in the composition of the control group, which is logical since all countries pass the parallel trends test and are therefore appropriate candidates to be part of the control group. This incomplete pass-through of diesel means that companies appropriate part of the subsidy (857 million of the 3600 million diesel subsidy, 23.8%) and the government through the increase in VAT revenue (216 million, 6% of the cost of the diesel subsidy). In the case of gasoline 95, if we assume an incomplete pass-through of 90%, companies appropriate 98 million of euros, and the government increase the VAT revenues in 14,6 million more.
The structure of this paper is as follows. After this introduction, the next section describes the temporary fuel subsidy introduced in Spain. Section 3 presents the database used and the econometric specification. Section 4 presents the results obtained. The fiscal cost of the subsidy and its distribution between consumers, producers and the government are presented in Sect. 5. The existence of parallel trends is analysed and a placebo test is carried out in Sect. 6. The final section presents the conclusions.
2 Temporary fuel subsidy in Spain
Faced with rising energy prices, the Spanish government decided to introduce various measures to curb price increases as part of its national plan to respond to the economic and social consequences of the war in Ukraine.
In the case of fuels, the government, through RDL 6/2022 of 29 March, introduced a subsidy of €20 cents per litre of fuel for all consumers, whether individuals or companies, from 1 April 2022. Retail distributors applied the €20 cents subsidy to consumers and the government subsequently paid this subsidy to retailers. It should be noted that the retail distributors of the three companies with refining capacity in Spain (Repsol, Cepsa and BP) had to apply the €20 cents subsidy, but received only €15 cents from the central government, having to contribute the 5 cent difference. This subsidy was initially implemented from 1 April to 30 June, but was extended until 31 December 2022 by Royal Decree-Law 11/2022 of 25 June.
The reason why Spain opted for the fuel price subsidy instead of the diesel and petrol tax reduction is that the percentage of the special tax in the final price in Spain is very close to the minimum set by the European Union (EU). The excise tax on diesel is €0.379 per litre, while the minimum set by the EU is €0.33. For 95 octane petrol, the excise duty is €0.473 per litre and the EU minimum is €0.359. This means that there was only a margin of €0.049 and €0.114 respectively on diesel and 95 octane petrol, far from the €0.20 introduced by the government. The effect of a reduction in excise duty on 95 octane diesel and petrol or a fuel price subsidy should be similar, up to the point where the excise duty on 95 octane diesel and petrol has a greater impact on the final price because VAT revenue is reduced. The reason is that in the case of the subsidy, it is applied to the final price after taxes, both direct and indirect, whereas in the case of the direct tax reduction, the indirect tax is then calculated on a lower base (with a lower direct tax), so the final price would be lower in this case.Footnote3
As indicated in the introduction, the scarce empirical evidence on the effect of this subsidy on consumer prices net of the subsidy shows that the pass-through may not reach 100%, especially in the case of diesel. It should be noted that the liberalization and privatization process of the fuel sector in Spain has resulted in a highly concentrated, horizontally and vertically integrated market,Footnote4 aspects that make the existence of competition difficult (Perdiguero 2010). The political decision to transfer the concessionary petrol stations according to the historical refining quota in Spain meant that the three companies with refineries in the country controlled practically 100% of the petrol stations which, as mentioned above, resulted in a horizontally and vertically concentrated market. As in other countries, fuel demand in Spain is relatively inelastic, especially in the short term (Bakhat et al. 2017). Both characteristics would contribute, as we have indicated, to the fact that the pass-through is not 100%.
In addition to the costs induced by the incomplete pass-through of this subsidy, although it is not the aim of this paper to analyse the global impact of the petrol and diesel subsidy, its introduction could have a negative impact on the achievement of at least two government objectives: Reducing inequality and pollution levels. First, it is possible that the measure has a potentially regressive effect. This is because the lowest income deciles own fewer cars (Laborda and Moral 2017) or, if they do have a vehicle, use it less intensively. The Independent Authority for Fiscal Responsibility (AIReF 2022), which analysed the redistributive effects of this subsidy, pointed out that the fuel consumption subsidy benefits specially households with higher incomes more. García-Miralles (2023) and Amores et al. (2023) reached the same conclusion, that the fuel subsidy would have mainly benefited those with the highest salaries, those who consume these types of products more intensively. They estimated that the highest income deciles received 192% more than the lowest income deciles.
A second element is the potential impact on fuel consumption and pollution. Although the demand for fuel is relatively inelastic, the price elasticity of demand for fuel is not zero, so the subsidy will have led to higher consumption and therefore higher levels of pollution. Labandeira et al. (2022) show how the subsidy leads to an increase in emissions of 3.58% due to a similar increase in consumption.Footnote5
It should be noted that the subsidy has also generated positive aspects. As pointed out by García-Miralles (2023), the measures introduced by the government, including the fuel subsidy, have led to a reduction in the level of inflation, an aspect that has helped to anchor the Spanish economy and has probably revised expectations of its future evolution downwards. This reduction in inflation implies savings in the revaluation of pensions and public wages.
All these negative and positive aspects must be taken into account when making an overall assessment of the measure, which is beyond the scope of this paper.
3 Data and empirical strategy
In order to assess both the price effects of the policy and its implementation, a weekly panel data set for Spain and eight European countries is considered. These countries, included in the control group, are Austria, the Czech Republic, Denmark, Estonia, Finland, Latvia, Lithuania and Slovakia. None of these countries have been affected by public intervention in the petrol market. Specifically, as mentioned above, the data start in November 2021 and end in the last week of May 2023. In addition to the variables related to the difference-in-differences model, the database includes the following variables:
- 1.Price of 95 octane petrol and diesel: The average weekly price of 95 octane petrol and diesel, with and without tax, in country i in week t. This information has been obtained from the European Commission’s Oil Bulletin database. This database collects the information that each Member State sends to the European Commission on the prices, before and after tax, of the different fuels during the week in question. It also publishes information on the direct taxes applied during the week and the current indirect taxes.Footnote6
- 2.Brent: is the average weekly price of Brent oil per litre in euro, in week i.Footnote7 Source: Federal Reserve Bank of St. Louis.Footnote8 The original price in dollars has been converted into euros using the euro/dollar exchange rate obtained from the European Central Bank website.Footnote9
Descriptive statistics on petrol prices and several t tests are presented in Table 4 (see Appendix). Several insights can be drawn from this table. Firstly, prices increase during the subsidy period compared to the previous period for both Spain and the control group; secondly, prices decrease after the subsidy period (January to May 2023) for all countries; thirdly, petrol prices are similar before and after the subsidy period; finally, diesel prices are higher after the subsidy period than before, but the difference is smaller in Spain than in the other countries.
The following graphs (Fig. 1) show the average prices in Spain and the average of the control group countries for the two products (diesel and petrol 95, both with taxes included). As can be seen, the average price in Spain is lower than the control average, but during the subsidy period the difference between them is significantly reduced.
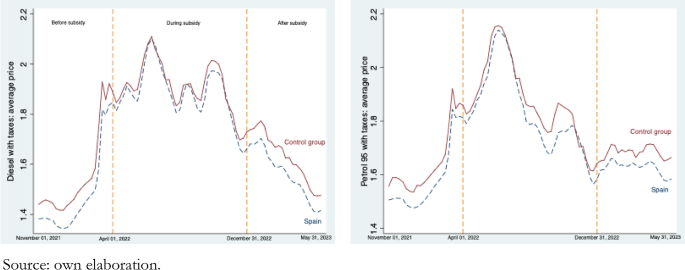
Source: own elaboration
Average weekly prices of petrol 95 and diesel, with taxes, in Spain and other countries (average).
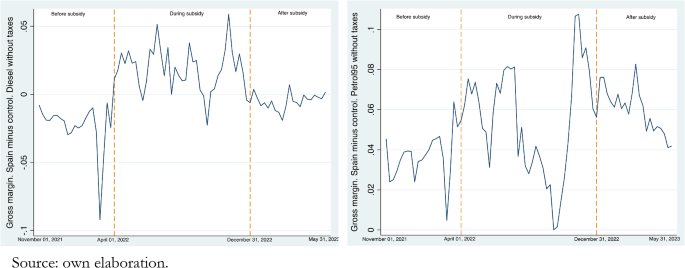
Figure 2 summarizes the gross difference in the net-of-subsidy price of diesel and 95 petrol between Spain and the average of the control group. As can be seen, this differential increases during the subsidy, mainly for diesel, and decreases both before and after the subsidy.Footnote10
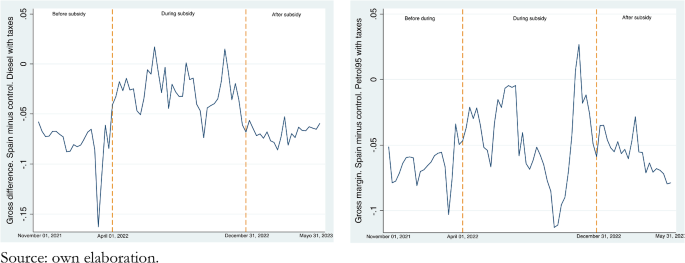
Source: own elaboration
Gross differences between average weekly prices of petrol 95 and diesel, with taxes, in Spain with respect to average of other (control) countries.
Although these descriptives may point to an increase in net-of-subsidy prices during the subsidy period, it is necessary to control for other factors that may affect the final price of these products. For this reason, the causal effects of the policy are estimated using a difference-in-differences (DiDs) estimator. Equation (1) allows us to estimate these changes due to the subsidy:
where is the price of petrol or diesel (with and without and taxes) of the country (i) at week (t); takes value 1 if the country (i) is Spain and 0 otherwise (control countries); takes value 1 for the weeks in which the policy took place in Spain (April to December, 2022, inclusive) and 0 in any other case; takes value 1 for the weeks in 2023, once the policy finished in Spain and 0 in any other case; is the cost of Brent per litre; represents country fixed effects; is monthly effect; and is the error term.
Finally, and represent the interaction of several previous binary variables (treated*during and treated*after, respectively). Therefore, it takes value 1 for Spain both during and after the period in which the policy was implemented and finalized, respectively, and 0 in all other cases. These are the two DiD coefficients that represent the average effect of this policy in both periods. Specifically, the former controls for price changes in Spain regarding the control group during the subsidy, while the latter estimates the average effect in Spain regarding the control group once the subsidy stopped operating. We must note that the latter does not show the average effect from During to After, but from the Before to After period.
In addition to the static difference-in-differences presented above, we also estimate a dynamic model, which allows us to analyse the month-by-month effect, even in months where the subsidy was not implemented (months before and after the introduction of the subsidy), which is known in the literature as leads-and-lags estimation. The coefficients of the difference-in-differences estimator in this case will show the difference with respect to the reference month, in our case the first month of the sample, November 2021.Footnote11
We expect the coefficients for the months before the introduction and after the removal of the subsidy to be non-significant (indicating that the behaviour was identical to the control group), while the coefficients for the months of subsidy will show us its effect on the net-of-subsidy prices paid by consumers. Specifically, the estimation follows Eq. (2):
The two assumptions necessary for the difference-in-differences estimator to be efficient and unbiased are: (1) That the control group members are not affected by the subsidy introduced in Spain. It seems logical to assume that the introduction of the subsidy in Spain has no effect on the prices set in countries such as Austria, the Czech Republic, Denmark, Estonia, Finland, Latvia, Lithuania or Slovakia. Consumers in these countries will not shift their consumption to Spain because a subsidy of €20 cents per litre is introduced in Spain. (2) That the price behaviour in the countries in the control group is identical to the price behaviour in Spain before the introduction of the subsidy and would have remained the same in the absence of the price subsidy. The validity of this assumption will be checked in Sect. 6, but we can already say that the results of the parallel trend tests indicate that we cannot reject that the pre-subsidy price evolution in all the countries in the control group is identical to that in Spain.
4 Results
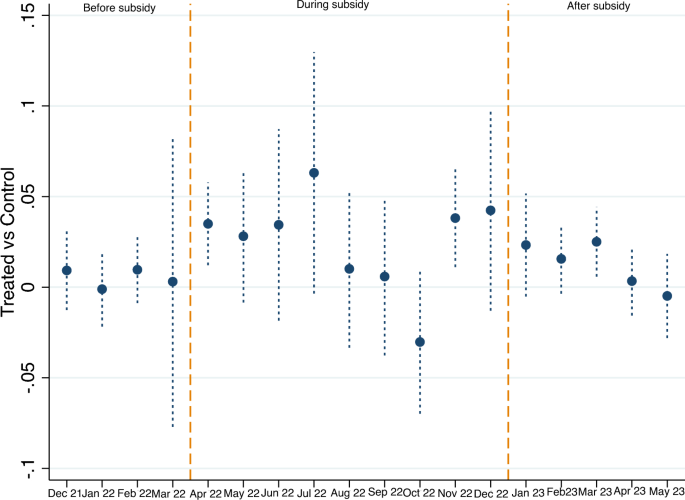
Figure 3 shows the results of the dynamic difference-in-differences estimation (leads-and-lags estimation)Footnote12 for diesel, where all coefficients depending on the month, in this case November 2021, are not included in the estimation. As can be seen, all coefficients for the interaction between months and Spain before the subsidy are not significantly different from that of November 2021. On the other hand, most of the coefficients during the subsidy period are significantly higher than the reference coefficient. Finally, the coefficients just after the subsidy return to the previous equilibrium and are not significantly different.
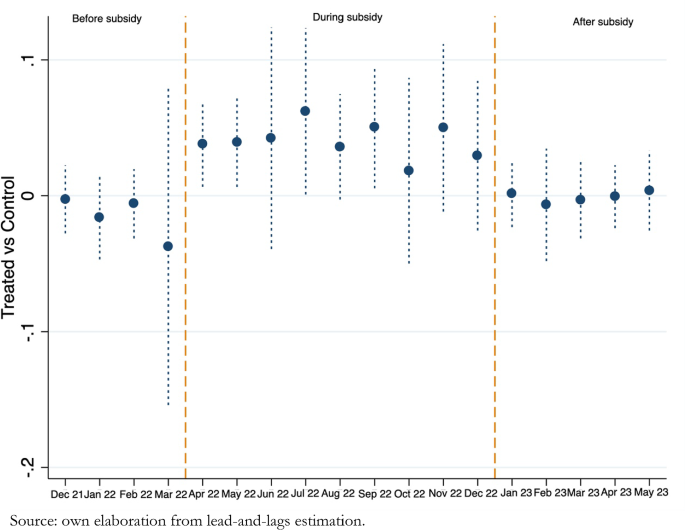
Source: own elaboration from lead-and-lags estimation
Estimated price differences between Treated and Control, by month. Diesel.
These results lead to three conclusions. First, that before the introduction of the subsidy in Spain, diesel prices in Spain behaved symmetrically to those in the control group countries, since all coefficients for the periods before the subsidy are not significant. This would indicate that they are a good control group and that the assumption of parallel trends would be met. Second that the effects of the subsidy are relatively constant throughout the implementation period, as the coefficients for most months are positive, significant and of similar value. This would suggest that the pass-through is not complete in the case of diesel, as the subsidy has led to a significant increase in prices. And third, that prices return to the previous equilibrium once the subsidy is removed, as evidenced by the fact that the coefficients for the post-subsidy periods are all non-significant, again being symmetrical with the countries that did not introduce any measure affecting fuel prices. This result would indicate the absence of asymmetries in the effects of the subsidy.
The same figure but for petrol 95 has been included in the Appendix (Fig. 7). In this case, the coefficients for the subsidy period do not reach the necessary significance threshold of 10%, so we cannot reject the null hypothesis that the effect is zero, so the pass-through would be complete.
Table 1 includes estimations of Eq. (1) for both types of fuels, with and without taxes. The two DiD variables (DiD During and DiD After) are the average effect of the policy in Spain regarding the average change in control countries before the implementation of the policy. Specifically, the coefficients include the average change in net-of-subsidy fuel prices in Spain versus the average price change in fuel prices in control countries with respect to the moment in which the subsidy was not yet introduced.
Models (1) and (2) refer to prices with taxes, while (3) and (4) summarize estimates for prices without taxes. The relevant variables are those related to the double difference (DiD). In this case, two conclusions can be drawn. On the one hand, the subsidy increases the net final price of diesel in Spain. Specifically, by €0.0527 per litre, there is no statistical effect on the price of petrol 95. Both the coefficients in Table 1 and most of the coefficients in Table 5 in the Appendix have an error probability greater than 10%, so we cannot reject the null hypothesis that the effect of the subsidy is zero in the case of petrol 95. It is true that the error levels are very close to 10%, so that the two coefficients in Table 5 are below this threshold and significant, indicating that the price increases for 95 octane petrol, if it existed, would be €2 cents.
The difference between the coefficients with and without taxes is due to the increase in VAT. In the case of diesel, the effect without tax is 0.0421, and since the VAT is 21%, this would imply an increase after tax of €0.051, very close to the coefficient we estimate after tax, 0.0527. Something very similar happens with petrol 95, where the pre-tax impact is €0.0174 and when the 21% VAT is added it would be €0.0211, very close to the 0.02 that we estimate econometrically. The pass-through result, in terms of the efficiency of the subsidy in reducing fuel prices, is independent of the fact that the three companies with refining capacity should contribute 5 of the 20 cents of the subsidy, it only affects the cost of the subsidy to the central government. These results indicate that in the case of diesel, 73.62% of the subsidy is passed on to the consumer (14.73 of the 20 cents of subsidy), while in the case of petrol 95 it is 100%.
There are two elements that could explain why the diesel subsidy is not passed on 100% to the final consumer. The first is the large market power of some companies, which allows them to set prices to a certain extent. It should be noted that, according to the Spanish Association of Petroleum Products Operators (AOP), the three leading companies in Spain own 46.09% of service stations (2022), while their market share in terms of litres sold is even higher, since they have the largest and best located stations. Second, as pointed out by Bakhat et al. (2017), the demand for petrol and diesel in Spain is very inelastic, especially in the short term.
As we have shown, the coefficient for petrol 95 is positive, but it does not become significant during the subsidy period. As pointed out by Gaader (2019), the pass-through depends on the elasticity of demand and supply. If demand for the good is relatively elastic compared to supply, then producers will bear a larger share of the tax (lower pass-through). On the other hand, if demand is inelastic with respect to supply, a larger share of the tax falls on consumers (higher pass-through). In the case of the subsidy, if demand is elastic with respect to supply, producers pass on a larger share of the subsidy to final consumers (higher pass-through). If demand is inelastic with respect to supply, producers pass on a smaller share of the subsidy to final consumers (lower pass-through).
In the case of the Spanish fuel market, the data show that the elasticity of demand with respect to supply is higher in the case of petrol 95, which would explain why the pass-through is significantly higher. On the one hand, the demand for diesel is more inelastic than that for petrol 95. As we have seen, according to Bakhat et al. (2017), the short-term elasticity of demand for diesel is significantly lower (− 0.015) than for petrol 95 (− 0.064). This result is maintained when analysing the long term (− c0.026 for diesel compared to -0.185 for petrol 95).
In the supply side, the consumption of diesel is much greater than that of petrol 95. According to the Corporación de Reservas Estratégicas de Productos Petrolíferos (CORES),Footnote13 in 2022 diesel accounted for 78.63% of the consumption destined for vehicles, while petrol 95 was 20.14% and gasoline of 98 octane only 1.23%.
This means that Spain is an exporter of petrol 95 (producing more than it consumes) and an importer of diesel (consuming more than it produces). This suggests that the supply elasticity of diesel should be greater than that of petrol 95. Changing the production of petrol 95 is relatively complicated once the refineries are installed and a certain production capacity is available, whereas reducing imports should be much less costly. These differences in demand and supply elasticities between the two fuels would explain why the pass-through is significantly higher for petrol 95.
On the other hand, the estimated DiD coefficient in the post-subsidy period is not statistically significant. As this reflects the change in prices in Spain relative to the control group before and after the end of the subsidy, we found no evidence that prices remained above the pre-subsidy level. Both results (the increase in net prices during the subsidy period and the decrease in prices after the subsidy ended) suggest that prices were higher during the subsidy period as a result of this policy.
5 Fiscal cost
The above estimates allow us to calculate the fiscal cost of the measure and its distribution. This is possible because we have both the pass-through of the subsidy and the actual consumption of hydrocarbons in Spain during this period. In this case, there are two direct calculations. On the one hand, how much more revenue the producers received as a result of the estimated price increase net of the subsidy, and on the other hand, what was the increase in government VAT revenue as the final price increased.
In this section, we will focus on the case of diesel, as we cannot rule out a 100% pass-through for petrol 95. If we consider that the pass-through for petrol 95 was set at 90%, the fiscal costs that would not have been passed on to consumers would be even higher. Specifically, the results can be seen in Table 8 in the appendix, where it can be seen that businesses would have appropriated almost 98 million euro, while the central government would have increased its VAT revenue by 14.6 million euro.
In the case of diesel, considering that the subsidy was €0.20 per litre, and net-of-subsidy prices increased by €0.0527, this means that 26.35% of the subsidy (5.27 out of 20) did not reach final consumers. For this 5.27 cents, 4.21 cents represent an increase in firms’ margins (79.89% of the net-of-subsidy price increase), and 1.06 cents is the increase in VAT; 1.06 out of 5.27). This is very similar to the rate at which VAT is applied to petrol products in Spain, so our estimations with and without taxes precisely predict the increase in margins and VAT.
To check if this average effect is similar during the subsidy months, we estimate the same specification but with monthly difference-in-differences variables. Results are presented in Table 6 (see Appendix). As we can see from this table, all months present a statistically significant increase in prices except for June, October and December. We can also see that all the DiD coefficients in the months after the subsidy are not significant.
Using the estimated coefficient for the price of diesel with taxes and total consumption at petrol stations, it is possible to calculate the cost of this subsidy to the public purse and the share that has been taken by the producers. These results are in this partial equilibrium scenario, without considering other possible indirect effects, such as higher taxes on energy companies or higher corporation tax paid by these companies if they increase their margins.
As we can see in Table 2, from April to December 2022, more than 2000 million litres of diesel were sold in Spain, which, when multiplied by €0.20 for the companies without refining capacity (53.91% of the total market share), and by €0.15 for the companies with refining capacity (Repsol, Cepsa and BP), which have 46.09% of the market share. The cost (for diesel only) of this subsidy was more than 3600 million euros (3,604,674,498 euros to be exact). According to the National Statistics Institute (INE), Spain’s GDP in 2022 will be 1,346,377 million euros, so the cost of the subsidy would be 0.27% of GDP.
Of the €0.2 subsidy, the estimates in Table 2 show that the companies’ margins increased by €0.0421, while the final price net of the subsidy increased by €0.0527 and the increase in VAT by €0.0106. As can be seen from Table 2, this implies that more than €1070 million of the diesel subsidy did not reach consumers: €857.6 million was captured by companies through an increased margin; and almost €216 million increased government revenue through an increase in VAT receipts.Footnote14
6 Parallel trends and robustness tests
Following the seminal paper by Galiani et al. (2005), we analyse whether the price trends for both types of fuel are similar between Spain and the control group before the subsidy (in our case, from November 2021 to March 2022). This is the ‘parallel trends’ assumption that the difference-in-differences analysis should satisfy. What this analysis seeks to test is whether, in the absence of the treatment (in this case, the subsidy), prices in Spain would have followed parallel paths to those in untreated countries.
To do this, Eq. (1) is estimated again, but this time including interactions between Spain, the control group and the trend variable. We then test whether these coefficients are similar across countries. The results are presented in Table 3. In all cases, the null hypothesis cannot be rejected, which means that the price trends in Spain and in all the countries in the control group are the same in the pre-subsidy period.Footnote15
Moreover, we perform a robustness check analysis to show that the outcomes due to the policy are not affected by the countries selected. In our case, this auxiliary analysis is implemented as follows. We randomly select countries to be in the control group and drop the others. Next, we estimate the Eq. (1) again. Results are included in Table 10, 11 and 12 where all the difference-in-differences coefficients show similar statistical significance, as in Table 1 (although the levels are not equal). In the case of Table 11, it summarizes the difference-in-differences coefficients once we rerun the analysis of Eq. (1) removing each country of the control group one at a time.
7 Conclusions and policy implications
Russia’s invasion of Ukraine on 24 February 2022 led to an increase in energy prices, particularly fuel, which had a significant impact on inflation in all European countries. As mentioned above, Russia produces and exports energy products, including oil and refined fuels. The war could have led to a reduction in supply on the energy market and uncertainty about supply capacity, which could have affected equilibrium prices. Many European countries introduced measures to contain the prices paid by consumers in an attempt to curb inflation. Spain was one of the countries that introduced a fuel subsidy of €0.20 per litre between 1 April and 31 December 2022 (RDL 6/2022).
This article analyses the impact that this €0.20 subsidy may have had on the final prices paid by consumers. To do so, we implement a difference-in-differences estimator with weekly data for Spain and a set of European countries that did not introduce any measures during this period.
The results show how we cannot reject the hypothesis that the pass-through was 100% in the case of petrol 95, but it is incomplete in the case of diesel. In fact, diesel final net-of-subsidy prices increased due to the introduction of the subsidy, specifically by €0.0527. So, the pass-through is 73.65% for diesel. This difference between petrol 95 and diesel indicates that probably the elasticity of demand for petrol 95 respect to the supply is greater than for diesel. This price increase implies that part of the subsidy does not mean a lower price paid by consumers, but rather a higher price (and margin) obtained by producers.
Considering that the cost of the subsidy was slightly over €4000 million, 1073 million did not end up in the hands of final consumers—but in additional revenues for the oil operators (i.e. 857 million euros) and almost 216 million euros returned to the public finance purse (via VAT). This result is calculated in a partial equilibrium scenario, without considering the potential indirect effects that the subsidy on gasoline and diesel may have had on public revenue due to greater profits for companies in the petrol market, for example. It would be good to compare this cost with the possible positive effects that the reduction in fuel prices may have had on the level of inflation. So far, we do not have any estimates of these positive effects.
Because the diesel subsidy is not passed on 100% to the consumer’s final price, perhaps it would be advisable to consider the introduction of alternative measures in future. One option would be the introduction of a direct income transfer to the low-income decile groups. As Labandeira et al. (2022) and García-Miralles (2023) indicate, the introduction of a direct income transfer to families with fewer resources might not only be more efficient and less market-distorting but would also represent very significant savings for the public purse.
Data availability
The replication material for the study is available at https://doi.org/10.5281/zenodo.14550927.
Notes
-
Vertical integration is another characteristic that permits firms to transfer a higher percentage of any increase in costs or taxes to the final prices (Bonnet et al. 2013; and Bajo-Buenestado and Borella-Mas 2022).
-
This appropriation of part of the tax reduction (or the introduction of a subsidy) does not only occur in the fuel market. There are examples in other industries, such as the tobacco market (Delipalla and O’Donnell 2001), alcoholic beverages (Miravete et al. 2018) or solar panels (Pless and Benthem 2019).
-
Let’s assume a final price of €1.5 per litre (€0.861 as the price before tax, €0.379 as the special tax and 21% VAT). A subsidy of €0.20 per litre should result in a new final price of €1.3 per litre (assuming 100% pass on). However, a reduction in excise duty of €0.20 would imply a final price of €1.26 (€0.861 as price before tax, €0.179 as excise duty and 21% VAT) per litre (assuming 100% pass on).
-
For a detailed analysis of the process of liberalization and privatization of fuel sector in Spain, see Perdiguero (2012).
-
This increase in consumption not only leads to more pollution, but it also generates an increase in Russia’s income. Russia, due to the introduction of these measures in Europe, as an exporter of petroleum products, obtained an increase in income of eight million euros per day. According to Gars et al. (2022), this amounts to 3.1 billion euros per year, about 0.2% of Russia’s GDP and 5% of military spending. This effect would run counter to the objectives of the EU’s sanctions against Russia. See: https://www.consilium.europa.eu/en/policies/sanctions/restrictive-measures-against-russia-over-ukraine/.
-
https://energy.ec.europa.eu/data-and-analysis/weekly-oil-bulletin_en#price-developments.
-
We have introduced this variable since it is the main input in the production of gasoline and diesel, although since it is an international price and the same for all countries in the sample, its exclusion does not significantly affect the difference-in-differences estimator. We do not have information on other inputs that could affect the production of gasoline and diesel, although they would be of less importance, and like Brent, since they are common to all countries, they would not affect the causal estimations.
-
https://fred.stlouisfed.org/series/DCOILBRENTEU.
-
https://sdw.ecb.europa.eu/quickview.do?SERIES_KEY=EXR.D.USD.EUR.SP00.A.
-
See the same analysis for prices without taxes at Appendix (Figs. 4 and 5).
-
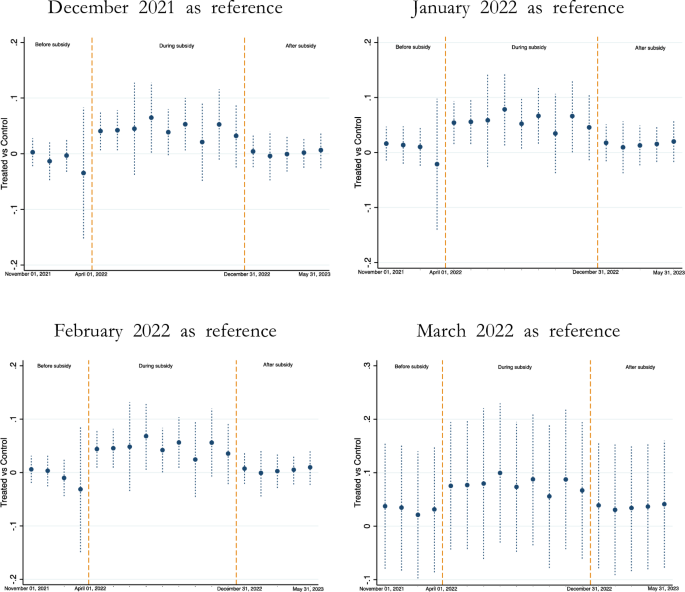
The results do not change when other previous months are used as a reference (see Fig. 6 in the Appendix). However, there is one exception. When we use the previous month to the implementation of the subsidy (March, 2022), because it shows greater variability than the other months, the standard error of leads-and-lags is larger. This could be due to several reasons: (1) The different impact that the war in Ukraine may have had on the hydrocarbon markets of the countries, especially those closest to Ukraine, which are part of the control group; (2) possible effects of anticipation of the measure (the announcement in Spain was made at the end of March). For the above reasons, and to avoid using the month with the greatest variability in the data, we have used the first month of the sample (November 2021).
-
Econometric results are presented in the Appendix, Table 7.
-
Data on petrol consumption are available at CORES, here: https://www.cores.es/es/publicaciones.
-
Table 9 in the Appendix shows the same analysis but using monthly coefficients included in Table 6. In this case, the amount varies from €1,150 to €846 million, where 673 went to producers and 173 to public revenues.
-
Excluding 95 untaxed petrol for Austria and diesel for the Czech Republic. In any case, robustness checks confirm that this does not affect our main results.
References
-
AIReF (2022) Informe sobre los proyectos y líneas fundamentales de los presupuestos de las administraciones públicas 2023: Comunidades Autónomas y Corporaciones Locales. Informe 52/22
-
Amores A, Basso H, Bischl S, De Agostini P, De Poli S, Dicarlo E, Flevotomou M, Freier M, Maier S, García-Miralles E, Pidkuyko M, Ricci M and Riscado S (2023) The distributional impact of fiscal measures to compensate for consumer inflation. Occasional Paper Series, 330. European Central Bank
-
Anderson SP, de Palma A, Kreider B (2001) Tax incidence in differentiated producto oligopoly. J Public Econ 81:173–192. https://doi.org/10.1016/S0047-2727(00)00079-7
-
Bajo-Buenestado R, Borrella-Mas MA (2022) The heterogeneous tax pass-through under different vertical relationships. Econ J 132(645):1684–1708. https://doi.org/10.1093/ej/ueac007
-
Bakhat M, Labandiera X, Labeaga JM, López-Otero X (2017) Elasticities of transport fuels at times of economic crisis: an empirical analysis for Spain. Energy Econ 68:66–80. https://doi.org/10.1016/j.eneco.2017.10.019
-
Balaguer J, Ripollés J (2024) Assessing a fuel subsidy: dynamic effects on retailer pricing and pass-through to consumers. Energy Econ 138:107846
-
Benzarti Y, Carloni D, Harju J, Konosen T (2020) What goes up may not come down: asymmetric incidence of valued-added taxes. J Polit Econ 128(12):4438–4474. https://doi.org/10.1086/710558
-
Benzarti Y, Garriga S, and Tortarolo D (2024) Can VAT cuts and anti-profiteering measures dampen the effects of food price inflation? NBER Working Paper No 32241. https://doi.org/10.3386/w32241
-
Besley TJ, Rosen H (1999) Sales taxes and prices: an empirical analysis. Natl Tax J 52(2):157–178. https://doi.org/10.1086/NTJ41789387
-
Bonnet C, Dubois P, Villas-Boas SB, Klapper D (2013) Empirical evidence on the role of nonlinear wholesale pricing and vertical restraints on cost pass-through. Rev Econ Stat 95(2):500–515. https://doi.org/10.1162/REST_a_00267
-
Brons M, Nijkamp P, Pels E, Rietveld P (2008) A meta-analysis of the price elasticity of gasoline demand. A SUR Approach Energy Econ 30:2105–2122. https://doi.org/10.1016/j.eneco.2007.08.004
-
Carbonnier C (2007) Who pays sales taxes? Evidence from French VAT reforms, 1987–1999. J Public Econ 91:1219–1229. https://doi.org/10.1016/j.jpubeco.2006.12.004
-
Chouinard H, Perloff JM (2004) Incidence of federal and state gasoline taxes. Econ Lett 83:55–60. https://doi.org/10.1016/j.econlet.2003.10.004
-
Delipalla S, O’Donnell O (2001) Estimating tax incidence, market power and market conduct: the European cigarette industry. Int J Ind Organ 19:885–908. https://doi.org/10.1016/S0167-7187(99)00057-0
-
Dovern J, Frank J, Glas A, Müller L-S, Perico Ortiz D (2023) Estimating pass-through rates for the 2022 tax reduction on fuel prices in Germany. Energy Econ 126:106948. https://doi.org/10.1016/j.eneco.2023.106948
-
Doyle JJ Jr, Samphantharak K (2008) $2.00 Gas! studying the effects of a gas tax moratorium. J Public Econ 92:869–884. https://doi.org/10.1016/j.jpubeco.2007.05.011
-
Drolsbach Ch, Gail MM, Klotz Ph-A (2023) Pass-through of temporary fuel tax reductions: evidence from Europe. Energy Policy. https://doi.org/10.1016/j.enpol.2023.113833
-
Fuest C, Neumeier F, Stöhlker D (2024) The pass-through of temporary VAT rate cuts: evidence from German supermarket retail. Int Tax Public Financ. https://doi.org/10.1007/s10797-023-09824-7
-
Gaader I (2019) Incidence and distributional effects of value added taxes. Econ J 129:853–876. https://doi.org/10.1111/ecoj.12576
-
Galiani A, Gertler P, Schargrodsky E (2005) Water for life: the impact of the privatization of water services on child mortality. J Polit Econ 113(1):83–120. https://doi.org/10.1086/426041
-
Ganapati S, Shapiro JS, Walker R (2020) Energy cost pass-through in US manufacturing: estimates and implications for carbon taxes. Am Econ J Appl Econ 12(2):303–342. https://doi.org/10.1257/app.20180474
-
García-Miralles E (2023) Medidas de apoyo frente a la crisis energética y al repunte de la inflación: un análisis del coste y de los efectos distribucionales de algunas de las actuaciones desplegadas según su grado de focalización. Boletín Económico del Banco de España 2023/T1
-
Gars J, Spiro D, Wachtmeister H (2022) The effects of European fuel-tax cuts on the oil income of Russia. Nat Energy. https://doi.org/10.1038/s41560-022-01122-6
-
Genakos Ch, Pagliero M (2022) Competition and pass-through: evidence from isolated markets. Am Econ J Appl Econ 14(4):35–57. https://doi.org/10.1257/app.20200863
-
Harju J, Kosonen T, Laukkanen M, Palanne K (2022) The heterogeneous incidence of fuel carbon taxes: evidence from station-level data. J Environ Econ Manag 112:102607. https://doi.org/10.1016/j.jeem.2021.102607
-
Hidalgo M, Martínez A, and Collado N (2022) ¿Cómo ha afectado el descuento de los combustibles al precio en las estaciones de servicio? EsadeEcPol Brief #28, Julio
-
Jiménez JL, Perdiguero J and Cazorla-Artiles JM (2022) An initial analysis of price effects of subsidizing petrol in Europe. SSRN electronic working paper. https://ssrn.com/abstract=4316834
-
Kopczuk W, Marion J, Muehlegger E, Slemrod J (2016) Does tax-collection invariance hold? Evasion and the pass-through of State diesel taxes? Am Econ J Econ Pol 8(2):251–286. https://doi.org/10.1257/pol.20140271
-
Kosonen T (2015) More and cheaper haircuts after VAT cut? On the efficiency and incidence of service sector consumption taxes. J Public Econ 131:87–100. https://doi.org/10.1016/j.jpubeco.2015.09.006
-
Labandeira X, Labeaga JM, López-Otero X (2022) Canvi climatic, fiscalitat i compensacions distributives. Revista Econòmica De Catalunya 86:64–71
-
Laborda J, and Moral JM (2017) Condicionantes del uso de la postventa de automóviles. In Libro blanco de la Posventa en la Automoción, ed. After Market Club
-
Miravete EJ, Seim K, Thurk J (2018) Market power and the Laffer curve. Econometrica 86(5):1651–1687
-
Moral MJ (2023) Reacción de los márgenes brutos de distribución ante la subvención de 20 céntimos por litro de combustible. FUNCAS
-
Oil Bulletin. Price developments. https://energy.ec.europa.eu/data-and-analysis/weekly-oil-bulletin_en#price-developments
-
Perdiguero J (2010) Dynamic pricing in the Spanish gasoline market: a tacit collusion agreement. Energy Policy 38(4):1931–1937. https://doi.org/10.1016/j.enpol.2009.11.073
-
Perdiguero J (2012) Tres décadas de reformas en el mercado español de gasolina: Historia de un fracaso anunciado. Papeles De Economía Española 134:143–157
-
Pless J, Van Benthem AA (2019) Pass-through as a test for market power: an application to solar subsidies. Am Econ J Appl Econ 11(4):367–401. https://doi.org/10.1257/app.20170611
-
Poterba JM (1996) Retail price reactions to changes in state and local sales taxes. Natl Tax J 49(2):165–176
-
Schmerer H-J, Hansen J (2023) Pass-through effects of a temporary tax rebate on German fuel prices. Econ Lett 227:111104. https://doi.org/10.1016/j.econlet.2023.111104
-
Weyl G, Fabinger M (2013) Pass-through as an economic tool: principles of incidence under imperfect competition. J Polit Econ 121(3):528–583. https://doi.org/10.1086/670401
Funding
The authors did not receive support from any organization for the submitted work.
Ethics declarations
Conflict of interest
The authors have no relevant financial or non-financial interests to disclose.
Additional information
Appendix
Appendix
See Tables
4,
5,
6,
7,
8,
9,
10,
11 and
12.
See Figs.
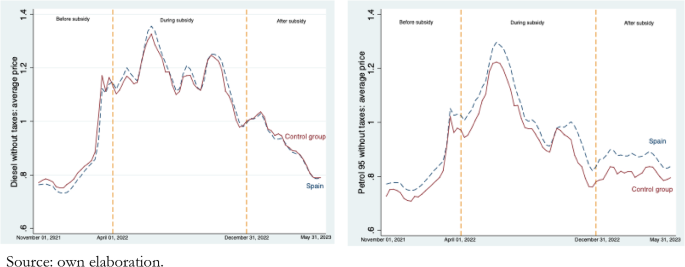
Source: own elaboration
Average weekly prices of petrol 95 and diesel, without taxes, in Spain and other countries (average).
4,
Source: own elaboration
Gross differences between average weekly prices of petrol 95 and diesel, without taxes, in Spain with respect to average of other (control) countries.
5,
Source: own elaboration from lead-and-lags estimation
Leads-and-lags graphs using different months of reference.
6 and
Source: own elaboration from lead-and-lags estimation
Estimated price differences between Treated and Control, by month. Petrol 95.
7.
Rights and permissions
Open Access This article is licensed under a Creative Commons Attribution 4.0 International License, which permits use, sharing, adaptation, distribution and reproduction in any medium or format, as long as you give appropriate credit to the original author(s) and the source, provide a link to the Creative Commons licence, and indicate if changes were made. The images or other third party material in this article are included in the article’s Creative Commons licence, unless indicated otherwise in a credit line to the material. If material is not included in the article’s Creative Commons licence and your intended use is not permitted by statutory regulation or exceeds the permitted use, you will need to obtain permission directly from the copyright holder. To view a copy of this licence, visit http://creativecommons.org/licenses/by/4.0/.
Reprints and permissions
About this article
Cite this article
Jiménez, J.L., Perdiguero, J. & Cazorla-Artiles, J.M. The pass-through of subsidizing petrol consumption: the case of Spain. SERIEs (2024). https://doi.org/10.1007/s13209-024-00302-9
- Received
- Accepted
- Published
- DOI https://doi.org/10.1007/s13209-024-00302-9
Keywords
- Subsidies
- Petrol prices
- Public policies
JEL Classification
- H2
- L4
- Q48