Article Content
1 Introduction
Voice biometric authentication based on text-independent speaker verification is one of the promising factors for multi-factor authentication and continuous authentication due to its ease of use, low operational cost, and improved customer experience in mobile device environments. However, in general, one of the major limitations of biometric authentications including voice is false acceptance and rejection rates (of the Victorian Information Commissioner 2023), and false acceptance can cause a crucial problem since it means that an unauthorized person might access at the device or/and service. Large training data and complex deep learning networks may be required to reduce fault acceptance and improve accuracy for voice biometric authentication (Zhang et al. 2018; Snyder et al. 2018, 2017; Bai and Zhang 2021; Wan et al. 2018). In a mobile environment without a pre-trained model, however, the user’s biometric information acquisition is inevitably limited for a rapid and easy enrollment process, and it again leads to the limitation for mis-acceptance. Thus, a deep learning-based voice authentication that simultaneously satisfies the following two conditions seems to be a challenging problem.
- Simple learning network with small training dataset for rapid and convenient enrollment process
- Correct filtering for mis-acceptance to avoid unauthorized user access
The aforementioned two conditions appear to exhibit a certain degree of contradiction within the mobile environment in the absence of a pre-trained model. This is due to the fact that fault acceptance cases cannot be negligible when employing a simplistic learning network with a limited training dataset. Conversely, if a fluent and extensive learning network is utilized with a sufficiently lengthy training process to minimize mis-acceptance cases, the enrollment process becomes intricate and time-consuming. To try to resolve this kind of contradiction, in this paper, we approach the following strategy: First, a proper simple binary classification deep learning-based voice authentication mechanism is prepared and trained with a small dataset. And secondly, a new supplementary learning network which is focused on correct verification of mis-accepted features is constructed and trained with features of the feature extraction in the classification model as training input data. For this supplementary learning network, we propose a novel deep learning network called a randomly encoded label-binding network (ReLB).
Suppose that a feature that is distinct from that of an enrolled user is mistakenly accepted as a registered user by the binary classification model. Then it means that the feature is very similar to the registered user’s feature. However, it also is reasonable to expect slight variations in certain parts of this feature compared to the registered user’s feature. Therefore, to mitigate this kind of false acceptance case of the original binary classification model, our basic idea is to design a supplementary network to discern these subtle differences within the feature.
To realize this objective, the ReLB network employs a two-step approach. Firstly, it expands the feature vector, and subsequently divides this expanded feature into 128 small parts. Finally, for each of these small parts, a random label of either 0 or 1 is assigned. By incorporating this mechanism, we aim to enhance the overall performance of the binary classification model. Unlike an image hashing method for verifying the data integrity of digital images (Chennamma and Madhushree 2022; Rhayma et al. 2021; Li et al. 2024), the ReLB network focuses on confidentiality, which refers to rules or promises that only authorized people or processes should have access linked to a specified system. Note that our ReLB network can be essentially considered a multi-class classification by randomly encoded labels.
Our main contributions can be summarized as follows:
- 1.We present an idea that can dramatically reduce the fault acceptance of a (weak) voice authentication trained by small dataset.
- 2.For this purpose, we propose a network called a ReLB network and prove this ReLB network is capable to correctly filter mis-acceptance from the given voice authentication based on MFCC and LSTM.
- 3.Furthermore, it is remarked that if the accuracy of the ReLB for the correct user is extremely high, the ReLB approach can provide a new possibility to hide a user’s secret key in a deep learning network since the ReLB network outputs 128 bits random bits.
The rest of this paper is organized as follows. In Sect. 2, we review the related studies. Then, Sect. 3 describes a detailed procedure of our proposed approach. We present the experiment results and their evaluation in Sect. 4. Finally, Sect. 5 provides the concluding remarks.
2 Related works
2.1 Multi-factor authentication
Multi-factor authentication (MFA) is an authentication method that requires a user to provide at least two verification factors to be granted access permission to specific resources (Williamson and Curran 2021). MFA refers to a form of combining two or more authentication factors, including something a user knows Knowledge-based, something a user has Ownership-based, and something a user has Biometric (inherence)-based and further Location-based and Social-based factors (Wells and Usman 2023). Biometric-based authentication, such as a fingerprint, voice, or iris, is a user-friendly and non-intrusive factor as an authentication factor. Users do not need any other proprietary tool, i.e., hardware requirements, to use the authentication factor. Users feel less expropriated for voice authentication than other biometric-based authentication factors (Harakannanavar et al. 2019). It allows the user to enter information for authentication even in situations (e.g., situations where you are carrying luggage with your hands or driving) where the user’s hands and feet are not free. However, there is a problem that noise around the user is mixed with voice data when entering information for authentication. Moreover, there are concerns that other people’s voices may be recorded and used for malicious purposes (Abozaid et al. 2019; Sheng et al. 2022).
2.2 Voice authentication
Voice authentication refers to a procedure of identifying a speaker based on unique characteristics extracted from a speaker’s voice given as an input value. It can be primarily classified into speaker identification and speaker verification. It can be classified into processes such as speaker diarization, speaker de-identification, and voice activity detection in detail, depending on the action performed (Tirumala et al. 2017). Among them, speaker identification refers to the process of determining the speaker that most closely matches the corresponding voice in the registered dataset when the voice of an unknown speaker is set as an input value. For this reason, a speaker verification process may occasionally follow a speaker identification process in the speaker identification system. Speaker verification refers to the process by which a user cryptographically provides biometric characteristics (e.g., a speaker utterance, face shape, fingerprint, retinal scan, etc.) to determine whether the claimed identity matches the biometric features (Wang and Geng 2009).
Voice authentication can be divided into two categories: text-dependent or text-independent, depending on the configuration of application scenarios. In text-dependent mode, the speaker must pronounce only the specified text. There can be vulnerabilities in that the voice authentication system is fooled by recording and reproducing the predefined voice of the enrolled speaker. As one of the ways to protect the voice authentication system, the system may ask the user to speak randomly prompted text (Larcher et al. 2014). In contrast, in the text-independent mode, the speaker can use arbitrary oral speech rather than the specified text as an input value to the voice authentication system. This mode can be helpful in forensic voice authentication systems, such as identifying the speaker in an intercepted conversation (Zhang et al. 2018).
2.3 Audio-visual dataset
Several representative audio-visual datasets are used to verify the suitability of voice authentication models. The VoxCeleb dataset, released as the VoxCeleb1 and the VoxCeleb2, is an audio-visual dataset based on the interview video data of public figures such as politicians and celebrities uploaded on YouTube (Nagrani et al. 2017; Chung et al. 2018). VoxCeleb consists of a created dataset under various circumstances, such as speaking data in front of a large audience, speaking data inside a quiet studio with little noise, and data by recording handheld devices without a high-quality recording device. The data classify speakers by ID and provides utterances in various situations for each ID. Data is provided in multiple file formats such as mp3 file or WAV file. It was confirmed that the dataset was well-balanced by gender and evenly distributed in terms of race, accent, occupation, and age (Nagrani et al. 2020). Furthermore, there is the LibriSpeech dataset based on LibriVox’s audiobooks. The dataset is a voice corpus recorded while reading a book in English by 2484 volunteers recruited through a public-domain audiobook production project. It provides 1000 h of 16kHz of audio with the script (Panayotov et al. 2015). The LibriSpeech dataset consists of training data including three partitions, and a dataset for development and testers including four. The training data is divided into 100-hour, 360-hour, and 500-hour sets. The development and test data consist of two partitions, ‘clean’ and ‘other,’ which are approximately 5 h long, respectively (Zhu et al. 2023; Ali et al. 2021).
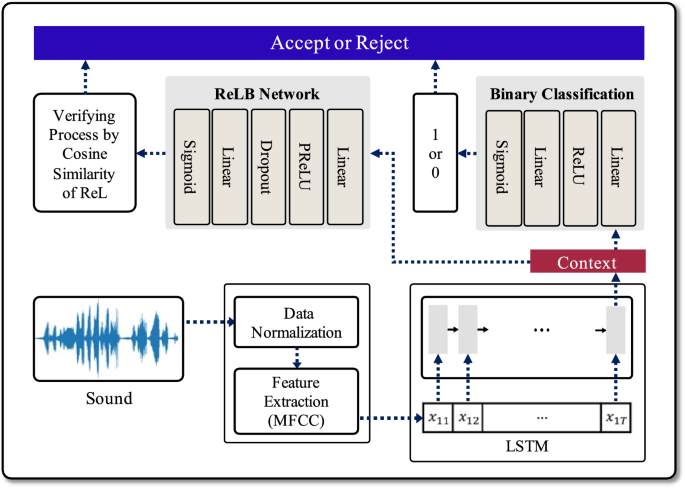
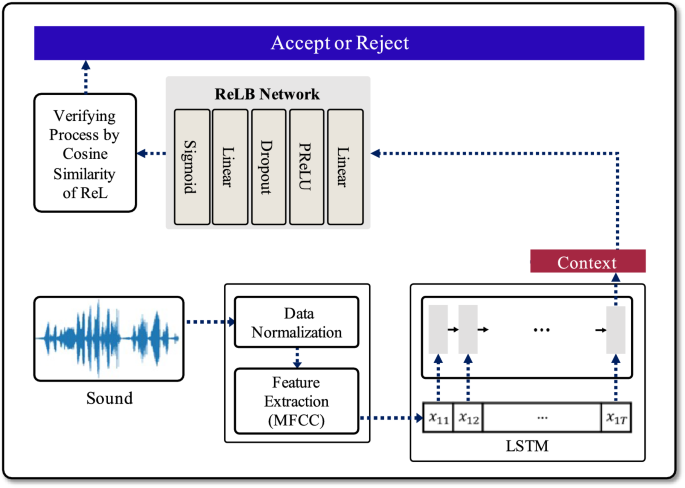
Overview of the proposed analytical procedure for the deep learning-based voice authentication mechanism. When sound data is input, a 64 bits context vector is generated through the data preprocessing and LSTM processes. Then it is used by each network to determine whether to accept or reject the user
3 Proposed scheme
3.1 Data preprocessing
Extensive input data make possible a deep learning algorithm’s parameter and model sizes massive. Moreover, it makes the deep learning model’s training and testing speed more sluggish. In this paper, we conducted MFCC-based preprocessing on voice data to derive meaningful results from the deep-learning-based key generation mechanism. First of all, because the data length was different for each WAV file, we fixed the sequence in units of 5 secs. Excess data was cropped for WAV files longer than 5 secs, and insufficient parts in WAV files shorter than 5 s were padded with zero values. In the case of voice data, 16,000 samples per second (i.e., data with 16,000 points per second) are typically extracted. Therefore, we performed the preprocessing of the data normalization by adjusting the sampling rate to 16,000. After the data normalization process is finished, the process of extracting essential and meaningful features from voice data is performed. The MFCC is a representative feature extraction method that discards unnecessary information and leaves unique features based on speech domain knowledge and formulas. As a type of data reduction method, the MFCC ensures efficient utilization of limited resources and faster model learning (Glittas et al. 2021; Kumbhar and Bhandari 2019). The MFCC divides the input voice into short sections (usually around 25 ms). These fragmented voices are called frames. It extracts frequency information contained in a frame after performing a Fourier transform on each frame. A result of performing a Fourier transform on each frame is called a spectrum. There is a Mel Filter Bank that carefully examines the frequency range sensitive to human speech recognition and analyzes the rest of the range relatively less closely. When the Mel Filter Bank and the spectrum work together, it is called a Mel Spectrum. The MFCC refers to changing frequency domain information into a new time domain by applying Inverse Fourier Transform to a log-Mel spectrum that a log is taken. In addition, the energy of the high-frequency component can be approximated to zero by maximizing the energy of the low-frequency component using the Discrete Cosine Transform (DCT). This represents a method of discarding unnecessary high-frequency components and leaving only low-frequency components, thereby maximizing data compression. Figure 2 shows Mel-scaled spectrogram data and the MFCC using the DCT conversion. The MFCC can be said to be the result of extracting important features for human speech recognition. For quite a long time, feature extraction frameworks have undergone changes and developments, and their performance has also been verified. The log-Mel spectrum and the MFCC are still widely used in speech recognition (see Eq. (1)) (Rajaby and Sayedi 2022).
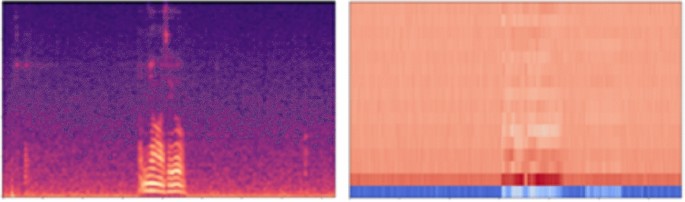
Mel-scaled spectrogram data (left) and the MFCC using the DCT conversion (right). Mel-scaled spectogram data represents the frequency content of an audio signal over time. The MFCC using DCT conversion captures the features of audio data while managing the transformation and compression of frequency components
3.2 Dimensionality reduction
To reduce the sampling rate, we converted the waveform data into frequency by Fourier transform in Sect. 3.1. Down-sampling was performed in this process by adopting a method of separately processing only low-frequency components, taking advantage of the fact that human voices generally tend to have low-frequency solid energy. Figure 3 shows FFT before down-sampling and FFT after down-sampling. In this process, Long Short-Term Memory (LSTM), one of the recurrent neural network techniques, was used. LSTM is an algorithm developed to prevent the long-term memory loss problem of existing recurrent neural networks by using an input gate, an output gate, and a deletion gate. The data length of the WAV file was fixed for the sequences in units of 5 secs. The data length that can be heard as short to human perception is more than 400 points in the program. We judged that it was unreasonable to apply the data to the existing Recurrent Neural Network (RNN) algorithm. Therefore, we selected the LSTM model rather than RNN. As the final result of the preprocessing, the data extracted by dimensionality-reduced features are converted into a 64 bits Context Vector.
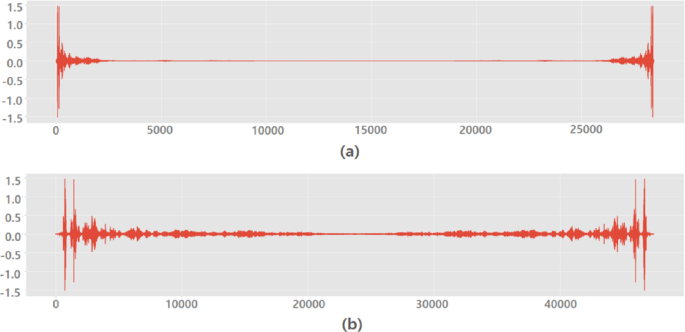
FFT before down-sampling, sampling rate is 48,000 (a), FFT after down-sampling, sampling rate 8,000 (b). Down-sampling allows for the removal of high-frequency components, enabling a focused analysis of the essential aspects within the data
3.3 Voice authentication network
The proposed network consists of two networks: (a) binary classification network, (b) randomly encoded label-binding (ReLB) network.
These two networks use context vectors as network inputs, and the context vectors were generated through the preprocessing process described. To briefly explain the preprocessing process, first, the user’s sound data is received as input, normalized, and then features of the data are extracted using MFCC. Next, it goes through a dimension reduction process and finally creates a 64 bits context vector through the LSTM layer. The two networks with the context vector as input trains and tests for users to determine ‘accept’ or ‘reject’ for system. Our voice authentication mechanism is the same as in Fig. 1, and below are explanations for each of the networks.
- 1.For a given input sound data, check where the result of the binary classification is 0 or 1. If the result is 0, then outputs ‘Reject’. Otherwise, go to the next steps.
- 2.Run the ReLB with the context vector for correctly verifying the result 1 of the binary classification.
- 3.Output of the ReLB is 128 bits encoded label. Check the cosine similarity between the enrolled user’s ReL(Randomly encoded Label) and the output.
- 4.If the similarity is greater than pre-determined acceptance rate, ‘Accept’ is output. This acceptance rate is determined by the performance experiment of the ReLB network.
- 5.When the similarity between the ReLB network’s output and the enrolled user’s encoded label falls around 0.5, it is rejected. This is due to the fact that the ReLB network is trained with randomly encoded labels, leading to outputs that can be regarded as random bits. Consequently, the probability of the ReLB network’s output being identical to the encoded label of an arbitrary user, other than the enrolled user, is extremely low.
Binary Classification: The binary classification model classifies users into binary labels of 1 or 0. In this context, label ‘1’ signifies true-users, while label ‘0’ denotes false-users. The 64 bits context vector, produced through the data preprocessing phase and the LSTM algorithm, passes through the binary classification network comprising a total of 4 layers. As depicted in Fig. 4, this network is configured with two Linear layers and two activation functions, ReLU and Sigmoid. When the result of the binary classification model is greater than the threshold, it is classified as 1, indicating a true-user, and the system responds with ‘accept.’ Otherwise, when the result falls below the threshold, it is classified as 0, signifying a false-user, and the system responds with ‘reject.’
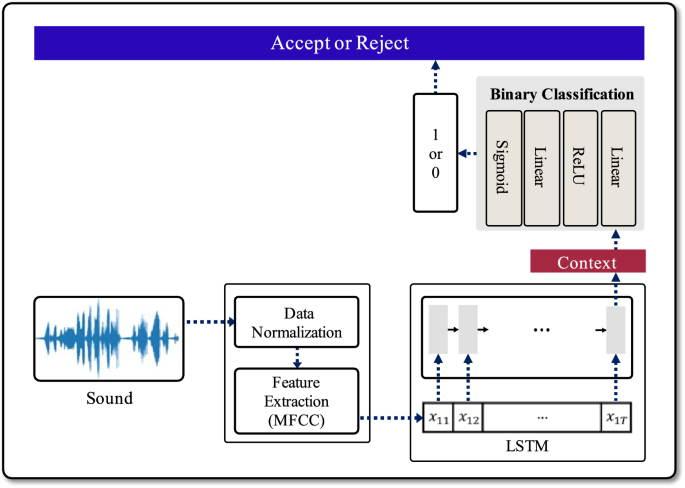
Network for binary classification
Randomly encoded Label-Binding (ReLB): The second network is a Randomly encoded Label-Binding (ReLB) network, and its structure can be represented as shown in Fig. 5. It is configured with two Linear layers and two activation functions, PReLU and Sigmoid, and also includes a dropout layer. The dropout layer is performed in the middle of the model and this prevents the overfitting of the data and optimizes the data so that each feature can be properly trained. The main difference between the first model and the ReLB model lies in the labels used for user classification. While the binary classification model classifies users with a single binary bit, 1 or 0, the second network employs 128 bits of Randomly encoded Labels (ReL) for user classification. The ReL is a label that allows the system to accept or reject the user by identifying whether the user is the true-user, and is a means of authenticating the user in the ReLB model. During model training, a random 128 bits ReL is generated for each user in the training dataset, and the ReLB model generates the ReLs for new input data. When the input data corresponds to the data of a user used in training, the model is trained to generate the original ReL specific to that user. In the ReLB model, the similarity between the ReL generated by the ReLB network and the original ReL generated during the training of true-user is used to distinguish users, comparing the similarity of the two ReLs using cosine similarity. Cosine similarity ranges from -1 to 1, where values closer to 1 indicate high similarity between the two ReLs, and values closer to -1 signify lower similarity. In the experiments of this paper, when cosine similarity is equal to 1, it is classified as true-user, and the system responds with ‘accept.’ Otherwise, it is classified as a false-user, and the system responds with ‘reject.’
In terms of security, the user authentication method using the ReLB network may be safer than the binary classification method. The method using binary classification displays the context vector extracted from the features of sound data in 1 bit that can distinguish users, while the method using the ReLB network generate 128 bits of keys from the 64 bits of context vector. To summarize again, the ReLB model extracts 128 bits label generated randomly after learning, and it is expected that the cosine similarity with the original ReL of the enrolled user is extremely high when input context vector is from the enrolled user’s sound. On the other hand, this similarity might be around 0.5, otherwise.
Network of Random encoded Label-Binding
4 Experiment results
In order to demonstrate that our proposed ReLB network can accurately verify mis-accepted data, we show experimental results which are derived from the following experiment process. A brief summarization is as follows:
- Dataset LibriSpeech dataset (Panayotov et al. 2015), VoxCeleb dataset (Nagrani et al. 2017)
- Training data Randomly selected small data – genuine user data: 10, others data : 40 – from LibriSpeech and VoxCeleb
- Testing data All utterances except those used for training in LibriSpeech and VoxCeleb
- Preprocessing Normalize the data and generate a 64-bit context vector through MFCC and LSTM
- ReLB network Train the ReLB network which input data is the context vector of the above trained authentication network and test it as follows: for the all data which are accepted by the original authentication network, check that the ReLB correctly verify where an input is a mis-accepted data or not.
4.1 Setup for dataset
First of all, we conducted experiments using the LibriSpeech and VoxCeleb datasets. For the LibriSpeech dataset, we utilized the ‘test-clean’ dataset consisting of 40 speakers, 20 males and 20 females, with a total of 2,620 utterances. For the VoxCeleb dataset, we selected 40 users from VoxCeleb1 to match the number of speakers in the LibriSpeech dataset. The dataset extracted from VoxCeleb1 comprises 25 males and 15 females, totaling 4,874 utterances. Table 1 represents the configuration of the train and testing datasets using the LibriSpeech dataset, while Table 2 illustrates the setup of the VoxCeleb dataset. Regardless of the dataset type or experimental approach, the training dataset consists of a total of 5 users, including one true-user and four false-users. Since each of the 5 speakers is trained with 10 voice data, the true-user’s training data consists of 10 utterances, while the false-users’ training data comprises 40 utterances.
When training the binary classification model and the ReLB model, there are two approaches to selecting the 5 training users. The first approach, corresponding to experiments (a), involves randomly selecting 5 users out of the total 40 speakers. This selection is done without regard to gender or nationality; instead, 5 users are randomly chosen and assigned as one true-user and four false-users. There are also two approaches to constructing the testing datasets. The first approach, regardless of gender, combines all the data from users not used in training, along with the data from the training users that was not used for training, and utilizes it for testing. In other words, all utterances except 50 used for training are included in the test dataset from the entire dataset. The second approach utilizes data only from the gender used for training. Specifically, in the second approach, the model trained exclusively on male users is tested using all male data except for the utterances used in training. And the model trained exclusively on female users is tested using the unused female utterances in training. By organizing the training and testing datasets in these ways, we conducted experiments, and detailed explanations for experiments (a) through (e) can be found in Sect. 4.3.
4.2 Performance metrics
To measure the performance of the proposed scheme precisely, we set four metrics: Accuracy, False Acceptance Rate (FAR), False Rejection Rate (FRR), and Cosine Similarity. Accuracy is a metric that indicates how precisely a system distinguishes users. It represents the ratio of correctly identifying true-users and false-users for approval or rejection and is expressed as the proportion of correctly classified users among the total number of users. FAR represents the ratio of false-users that the system fails to detect, with false-users typically referring to users who should be rejected by the system. The FAR is typically expressed as a percentage, calculated by dividing the number of false acceptances by the number of false-users. It can also be expressed as the ratio of the number of false positives to the sum of the number of true negatives and the number of false positives. FRR represents the rate at which the system fails to correctly authenticate true-users, where true-users refer to individuals who should legitimately access the system. The FRR is expressed as a percentage calculated by dividing the number of false negatives by the total number of true-users. Alternatively, it can be expressed as the ratio of false rejections to the sum of true positives and false negatives (Kim et al. 2010; Wang et al. 2019). In the context of authentication systems, sensitivity is adjusted to determine how precisely the system identifies and approves or rejects users. The sensitivity of a system is a crucial factor that reflects how the system operates or responds and the values may vary depending on the purpose of the system. In systems with high sensitivity, the FAR is typically low, but the FRR may be high. This means that the system effectively filters out false-users but has a higher likelihood of rejecting true-users. On the other hand, in systems with low sensitivity, the FAR is high, and the FRR is low. In such cases, the system is more lenient with true-users but may struggle to filter out false-users. Therefore, in system design, it is important to set the appropriate sensitivity and threshold values according to the system’s objectives. This allows for the adjustment of the FAR and the FRR and the implementation of a system with the desired level of sensitivity. Finally, Cosine similarity serves as a metric for quantifying the similarity between two non-zero vectors. It is defined by measuring the cosine of the angle between these vectors and calculated by taking the dot product of the two vectors and dividing it by the product of their magnitudes (norms). The cosine similarity values range from -1 to 1, with values closer to 1 indicating a higher degree of similarity between the two vectors (Zhang et al. 2021). In this paper, we utilized cosine similarity to compare the 128 bits ReLs generated by the ReLB model with the 128 bits ReL employed during the training of the true-user. The ReLs generated by the ReLB model were classified as true-user when the cosine similarity is 1, and as false-user when it fell below 1. The performance metrics are summarized as follows (see Eq. (2)-(5)):
4.3 Evaluation
In this section, we conduct experiments to assess the suitability of the proposed models, namely the binary classification model and the ReLB model. Before conducting the experiments, we determined the threshold for classifying the results of the binary classification model using FAR and FRR. In the training dataset, data belonging to true-users are labeled as 1, while data from false-users are labeled as 0. Moreover, the final output values of the binary classification network are decimal values ranging from 0 to 1. To classify users, it’s necessary to use a threshold to categorize these results as either 1 or 0, and this threshold needs to be set separately. If the threshold is set too low, there may be an increase in the number of cases where the results are classified as 1, potentially leading to mis-acceptances of false-users as true-users, resulting in a higher FAR. On the other hand, if the threshold is set too high, there may be an increase in cases where the results are classified as 0, potentially leading to mis-rejections of true-users as false-users and thus raising the FRR. Therefore, the most suitable threshold value is one that makes FAR and FRR equal. To achieve this, we incrementally increased the threshold value from 0 by 0.001 and measured FAR and FRR values, and an example of results can be seen in Fig. 6.
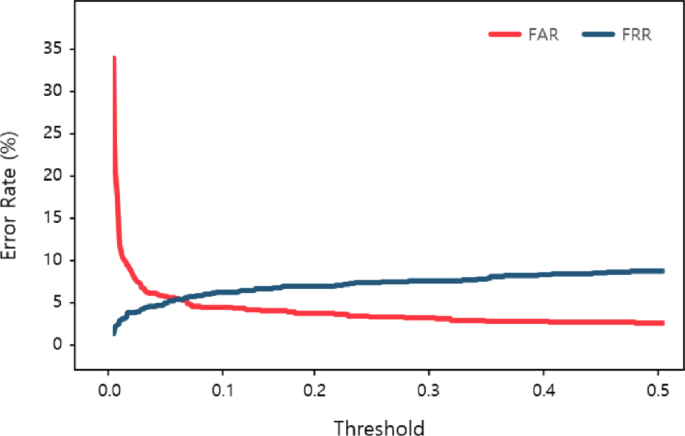
FAR and FRR changing as the threshold value
Figure 6 indicates the graph of FAR and FRR that change as the threshold value calculated through the data in Table 2 (a) increases. As the threshold increases, FAR gradually decreases, and FRR increases. In particular, Equal Error Rate (EER) means the point where the FAR and FRR values become equal. It occurs at the points where the threshold is approximately 0.065. As a result, the threshold of the classification model was set to 0.065, and the EER of the model is 4.9% based on the outcome. Consequentially, the classification model with the threshold set at 0.065 showed an accuracy of 90.18%, and the False Acceptance ratio and False Rejection ratio were 4.9% each, with 43 occurrences. Through this process, we established thresholds for each of the binary classification models and classified users as either true-users or false-users based on these thresholds. As shown in Fig. 6, the proposed network completed the classification model through the derived threshold, and tested the ReLB model. The result of the ReLB model is a key of 128 bits in binary form. Moreover, how similar the key is to the master key used as the correct answer in learning is compared.
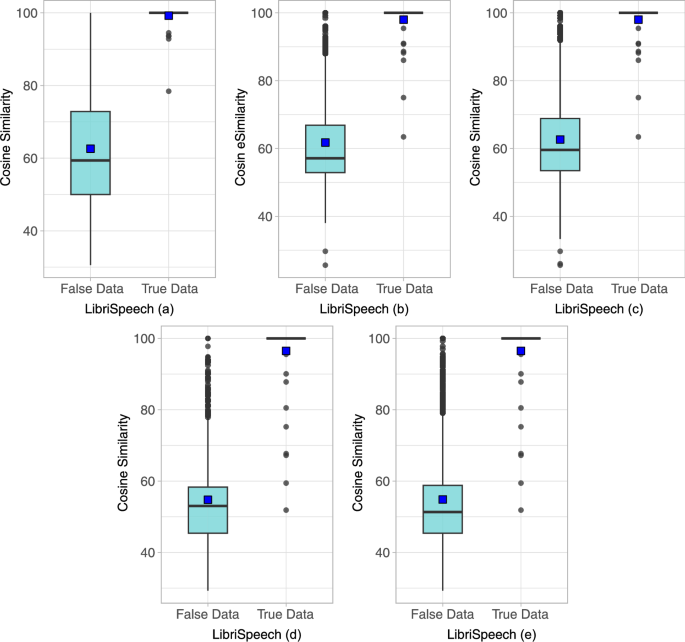
ReL cosine similarity between true-user data and false-user data from the LibriSpeech dataset
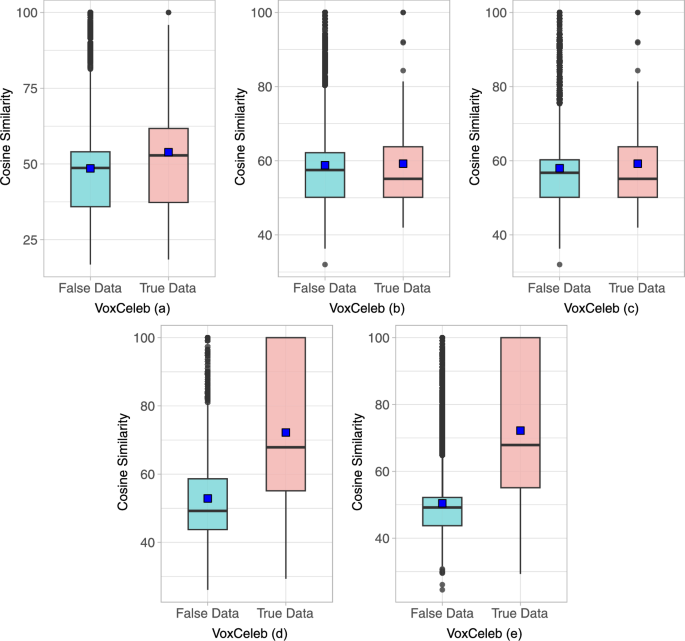
ReL cosine similarity between true-user data and false-user data from the VoxCeleb dataset
The experiments were conducted using both the LibriSpeech and VoxCeleb datasets, as mentioned in Sect. 4.1. Experiment (a) randomly selected one true-user and four false-users regardless of the speaker’s gender, trained them, and then tested using data that was not used for training. Similarly, experiment (b) was trained using only male data and then tested using male data that was not used for training. The third experiment (c) was trained with the same training data as the second experiment (b), and subsequently evaluated using all available data except for the data used during training, regardless of gender. In the fourth experiment (d), only female data were included in the training dataset, while the evaluation was performed on all available female data, exclusive of training data. The fifth experiment (e) used the same mechanism as the fourth, except that all available data, regardless of gender, was employed for evaluation. Since the master ReL is randomly generated during the training process, it is challenging to assert that the true-user and false-users ReL are similar when the result is around 50%. In simpler terms, the ReLB model’s network has the ability to extract a ReL that is similar to the true-user ReL when true-user data is inputted and a ReL that deviates when fake-user data is entered. The FA rate is the vital element of this test.
Let’s begin by examining the experimental results using the LibriSpeech dataset. Figure 7 shows the results of experiments (a) to (e) using the LibriSpeech dataset in the form of a box-plot. Experiment (a) shows that the average cosine similarity of ReL extracted from the whole dataset is 63.46%. The average cosine similarity of ReL for true-user data is 99.23%, whereas for false-users data, it is 62.59%. As shown in Fig. 7-(a), the ReLs cosine similarity extracted from true-user data is almost 100%, except for some outliers. On the contrary, the cosine similarity of ReLs extracted from false-users data is broadly distributed ranging between 50% and 72%. The median value for true-user data is 100%, while it is 59.38% for false-users data, indicating a notable difference. Additionally, the false acceptance rate (FAR) of the classification model is 18.68%, while the ReLB model has a FAR of 5.41%, indicating superior results compared to the classification model. In the experiment in (b), the average cosine similarity of ReLs extracted from the whole dataset is 63.63%. The average cosine similarity of ReLs for true-user data is 98.01%, and the average cosine similarity of ReLs for falses-user data is 61.76%. As shown in Fig. 7b, the cosine similarity of ReLs extracted from true-user data is 100% for almost all data except a few outliers, while the cosine similarity of ReLs extracted from false-users data is widely distributed between about 52.83% and 67%. We can see that the median value is 100% for the true-user data and 57.14% for the false-users data, and the FAR of the classification model is 11.52% and the FAR of the ReLB model is 2.20%, which is better than the classification model and shows a better FAR than the previous experiment (a). In the experiment in (c), the average cosine similarity of the ReLs extracted from the whole dataset is 63.48%. The average cosine similarity of the ReLs extracted from the true-user data is 98.01%, and the average cosine similarity of the ReLs extracted from the false-users data is 62.64%. As shown in Fig. 7c, the cosine similarity of the ReLs extracted from the true-user data is 100% for almost all data except a few outliers, while the cosine similarity of the ReLs extracted from the false-users data is widely distributed between about 53% and 68%. The median value is 100% for the true-user data and 59.59% for the false-users data, which is a significant difference in values. Furthermore, the FAR of the classification model is 16.38%, while the FAR of the ReLB model is 2.10%. We can see that the FAR of the classification model has increased compared to the previous experiment (b), while the FAR of the ReLB model has slightly decreased. In experiment (d), the average cosine similarity of the ReLs extracted from the whole dataset is 59.74%. The average cosine similarity of ReLs extracted from true-user data is 93.32%, and the average cosine similarity of ReLs extracted from false-users data is 58.06%. As shown in Fig. 7d, the cosine similarity of ReLs extracted from true-user data is 100% for almost all data except for a few outliers as in previous experiments, while the cosine similarity of ReLs extracted from false-users data is widely distributed between about 45% and 58%. The median value is 100% for true-user data and 59.59% for false-users data, which is a clear difference from previous experiments. The FAR of the classification model is 7.39%, while the FAR of the ReLB model is 1.79%, which shows a better FAR. In the experiment in (e), the average cosine similarity of ReLs extracted from the whole dataset is 55.88%. The average cosine similarity of ReLs for true-user data is 96.49%, and the average cosine similarity of ReLs for false-users data is 54.85%. As shown in Fig. 7e, the cosine similarity of ReLs extracted from true-user data is 100% for almost all data except a few outliers, while the cosine similarity of ReLs extracted from false-users data is widely distributed between about 45% and 58%, the median is 100% for true-user data and 51.32% for false-users data, which is a clear difference in values from previous experiments. The classification model has a FAR of 7.32%, while the ReLB model has a better FAR of 1.25%. The VoxCeleb dataset was also experimented with, as was the LibriSpeech dataset above, and the detailed performance can be seen in Fig. 8.
The previous experiments show that the FAR can be reduced more effectively by using ReLB networks. Therefore, the ReL extraction by ReLB networks proposed in this paper proves to be effective in distinguishing true-user. Taken together, the paper shows that the proposed deep learning-based voice authentication with a small training dataset can reduce fault acceptance to almost zero.
5 Conclusion
False acceptance in the authentication process for accessing various devices can be fatal to security threats because it induces unauthorized persons to gain illegal access logically or physically to networks, systems, applications, data resources, etc. Furthermore, it is more challenging to lower the fault acceptance rate in a mobile environment where training data is small due to the nature of a portable device. This paper proposes a deep learning-based network model that can dramatically reduce the fault acceptance rate even with small training data in voice recognition. To concretize and verify the overall structure of the proposed mechanism, we used the LibriSpeech and VoxCeleb datasets divided into a few partitions. The preprocessed output values, the context vectors, are trained and tested in the voice authentication networks, the binary classification network and the ReLB network. Lastly, the results generated by the network are used to determine whether the user accepts or rejects. The proposed ReLB model contributes to a lower FAR and a greater accuracy in the classification of unauthorized users as compared to the binary classification model. In particular, because the ReLB model generates the user’s label (ReL) through the network, the proposed model supports implementing a more robust authentication system. Provided that, our paper does not consider evaluating a voice authentication network model for voice files captured and recorded for malicious purposes. In future research, besides gender-based partitions, we plan to construct other dataset partitions such as occupation and nationality through cross-analysis of different audio-visual datasets, including the LibriSpeech and VoxCeleb datasets.