Article Content
Abstract
Context
Maintaining software projects over the long term requires controlling the accumulation of technical debt (TD). However, the time and cost associated with technical debt management (TDM) are often high, hindering practitioners from performing TDM tasks. Using tools for TDM has the potential to reduce the effort involved. Despite this, the adoption of such tools remains low, indicating a need for more efficient tool support.
Objective
This study aims to understand practitioners’ perspectives on tool support for TDM, specifically regarding the selection and use of these tools. Additionally, we identified potential requirements that could be implemented into existing or new TD tools.
Method
We surveyed practitioners and received 103 answers, from which 89 valid answers were analyzed using thematic synthesis and descriptive statistics.
Results
Practitioners’ decision-making processes regarding adopting tools are primarily driven by ten main concerns identified from practitioners’ responses (e.g., the load of information provided by tools). Additionally, we elicited 46 requirements and classified them into two main categories (“Information to be provided” and “Tool Usage”).
Conclusion
Practitioners aim to maintain control over tool execution and outputs. Our study then highlights the necessity of human-centered approaches for TDM automation, i.e., not only tools are essential, but the interaction between tools and practitioners is critical for a more efficient TDM.
Explore related subjects
Discover the latest articles and news from researchers in related subjects, suggested using machine learning.
- Database Management
- Knowledge Management
- Skills
- Software Management
- Theory and Algorithms for Application Domains
- Technological Infrastructures
1 Introduction
The term technical debt (TD) was proposed in the 1990 s to describe non-optimal decisions that software developers make (Cunningham 1992). Such decisions can be made due to a variety of reasons, such as insufficient resources, lack of knowledge, or tight deadlines (Rios et al. 2018). A few examples of TD items are code smells (Sas et al. 2021), requirements only partially implemented (Melo et al. 2022; Rios et al. 2018), and low-quality code (Digkas et al. 2022). When incurring TD, practitioners usually optimize short-term benefits, such as improving the speed of development or reducing its cost (Rios et al. 2020). However, in the long term, the accumulation of TD can harm the software’s maintainability and evolvability (Li et al. 2015). Hence, it is vital to keep TD under control promptly. To this end, several technical debt management (TDM) activities have been proposed to keep an acceptable level of TD accumulation on software systems (Li et al. 2015). Such activities include identifying TD items (e.g., by using source code analysis Zazworka et al. 2013 or machine learning Li et al. 2022), documenting them (e.g., by opening issues in an issue tracking system Kashiwa et al. 2022), and paying back the debt (e.g., by refactoring the source code Martini et al. 2015).
Although keeping TD under control is paramount, TDM is time-consuming. Recent literature indicates that TDM might consume from 25% to 42% of development time (Besker et al. 2019; Tornhill and Borg 2022; Xiao et al. 2022). The more time is spent in dealing with TD, the less time is available for developers to deliver new code and value (through features) to customers (Lim et al. 2012). This may partly explain why software development teams often do not perform any TDM activity despite being aware of the risks of TD (Rios et al. 2018; Martini et al. 2018). In such a context where TDM is crucial to keep the overall quality of software systems, but developers cannot afford to spend significant time dealing with TD, the usage of tools to efficiently support TDM activities is paramount (Khomyakov et al. 2019; Silva et al. 2022; Biazotto et al. 2023).
To explore how tools could support TDM more efficiently, researchers started to investigate practitioners’ needs and elicit requirements for TDM tools. Examples of such requirements include: (i) automated tracking of TD (Martini et al. 2018); (ii) identification and monitoring of TD based on historical data (Martini et al. 2018); and (iii) linking TD-related information to refactoring opportunities (Sas et al. 2021; Malakuti and Ostroumov 2020). However, this list is not exhaustive, and many other requirements remain implicit. Other works related to TDM in the industry also focus on practitioners’ understanding of TD (Codabux et al. 2017; Silva et al. 2019; Apa et al. 2020). Some studies also focus on investigating tools for TDM (Avgeriou et al. 2021), while others investigate the effort related to TDM (Besker et al. 2019). There is also evidence linking the level of TDM awareness with the usage of TDM tools.
Despite advancements in understanding practitioners’ perspectives on TDM automation and TD tools (or TDM tools), adopting such tools remains relatively low (Besker et al. 2019) which may compromise the efficiency of TDM. Furthermore, to the best of our knowledge, research on TD tools lacks a comprehensive understanding of why practitioners select and use TDM tools. Practitioners are responsible for decisions, such as tools to be adopted and their integration into development workflows. A deeper understanding of their reasoning processes can help improve existing tools and guide tool vendors to focus on what truly matters to practitioners. Finally, current research has yet to provide an extensive list of tool requirements that address practitioners’ concerns. Addressing this missing information is essential for enhancing existing tools, developing new ones, and ultimately improving TDM efficiency.
To tackle the aforementioned problem, this paper explains how practitioners reason about adopting TDM tools and elicits a comprehensive set of core requirements for such tools. This understanding can support the development of better TDM strategies and consequently make TDM more efficient. To this end, we conducted a survey with practitioners. Although other methods could have been applied (e.g., systematic literature reviews or mining software repository (MSR) studies), these methods present certain limitations. On the one hand, existing literature on tooling for TDM focuses on listing tools or reviewing their functionality, with limited attention to practitioners’ opinions. If we had opted for a review of existing surveys, most TDM surveys would concentrate on TDM activities, while they do not widely discuss tool adoption (e.g., Rios et al. 2020 and Besker et al. 2018). On the other hand, MSR studies focus on collecting data from software repositories to uncover interesting and actionable information about software systems, development processes, and developers (Hassan 2008). They typically analyze repositories, such as version control systems (e.g., GitHub, GitLab), issue tracking systems (e.g., Jira, Bugzilla), communication platforms (e.g., mailing lists, Stack Overflow, Slack), and code review tools (e.g., Gerrit, GitHub pull requests). To address our stated problem, we first had considered conducting an MSR study on TDM tools discussed in forums and blogs. However, existing literature that applied MSR to investigate TDM (e.g., Alfayez et al. 2023; Biazotto et al. 2025) shows that most discussions focus on SonarQube. A focus on SonarQube would limit the generalizability of our study, as it would restrict the range of tools and scenarios explored. Moreover, previous MSR studies have not found evidence regarding the reasoning process behind selecting and adopting TDM tools, which is one of the main gaps we identified. Considering these limitations, we deemed that a survey with practitioners was a more suitable method. It offers greater flexibility to explore relevant scenarios and allows us to combine different types of data and questions, enabling the collection of more comprehensive information.
In total, we received 103 responses from practitioners involved in both industry and open-source software (OSS), e.g., maintainers of projects in the Apache Software Foundation. From those, 89 valid responses were analyzed, and, based on them, we offer two main contributions:
- Practitioners’ rationale model for TDM tool adoption: The model contains a set of nine concepts and their relations and helps explain what practitioners consider when selecting and adopting tools for supporting TDM. For example, practitioners are highly interested in keeping control over tool execution and results; in contrast to recent studies (Martini et al. 2018), ours does not indicate a need for fully automated processes. In addition, our model can support: (i) the development and improvement of tools that align with practitioners’ concerns; and (ii) the development of new strategies and techniques to support TDM, potentially increasing the automation level of TDM; and
- Set of core requirements for TDM tools: This set contains 46 requirements and can be used to develop new tools or improve existing ones, potentially aligned with practitioners’ needs and concerns. Such requirements were clustered into two main categories, i.e., “Information to be Provided” and “Tool Usage”. Some literature also presents requirements for tools (Falessi et al. 2013; Malakuti and Heuschkel 2021; Li et al. 2023). Nonetheless, such requirements are limited and bounded to very specific contexts (e.g., identification of self-admitted technical debt). To the best of our knowledge, our study is the first one that formally elicits requirements for TDM tools and provides a comprehensive classification for them, so contributing to improving or developing new tools and leading to more efficient TDM.
The rest of this study is organized as follows. Section 2 describes the background and related work and compares related work to our study, also elaborating on our main contributions. Section 3 reports the study design, covering the research questions and data collection and analysis. Section 4 presents the survey results, while Section 5 discusses them. Section 6 discusses the threats to the validity of this study and the actions we took to mitigate these threats. Finally, Section 7 concludes this work and highlights future research directions.
2 Background and Related Work
In this section, we elaborate on the literature related to our study. Section 2.1 provides a brief overview of the background of this study, including key aspects of TD, its management, and the use of tools and automation to increase TDM efficiency. In addition, since our study reports a survey in TDM, in Section 2.3 we discuss recent surveys that use methods similar to those presented in this study; such methods were used as a basis for our study design.
2.1 TD and its Management
The TD present in a system can be introduced in various moments of the software development process since debt is not strictly related to the source code. Consequently, there are different TD types based on their source, e.g., source code, architectural decisions, tests, and infrastructure (Li et al. 2015; Alves et al. 2016; Jeronimo Junior and Travassos 2022). Li et al. (2015) defined ten types of TD:
- Requirements TD: it relates to requirements elicitation and can refer to, for instance, a lack of requirements or misunderstanding of some of them;
- Architectural TD: bad decisions related to architectural design that could compromise ‘internal’ quality attributes of the software, such as evolvability or maintainability;
- Design TD: poor decisions made during the design phase, e.g., the division of responsibility among different classes;
- Code TD: violations of code quality aspects, for instance, duplicate code, spaghetti code, and duplicated variables;
- Test TD: non-optimal decisions taken in elaboration or execution of tests, e.g., lack of tests;
- Build TD: bad decisions that can harm the software building process, e.g., bad dependencies management;
- Documentation TD: poor documentation in terms of correctness, completeness, and up-to-date aspects;
- Infrastructure TD: non-optimal decisions related to the selection of technologies for the software development, e.g., to use old technologies; and
- Versioning TD: problems in source code versioning, such as lack of multi-version support.
To keep TD under control, various activities have been proposed to help practitioners manage their TD (McGregor et al. 2012; Guo and Seaman 2011; Alves et al. 2016). Li et al. (2015) summarized nine main activities present in the literature. During identification, TD items are detected using several techniques, such as manual inspection or static code analysis. The identified items can be documented during the representation and documentation activities and stakeholders are informed about the TD items during the communication activity. The TD items can be then monitored during the monitoring activity, which ensures that unsolved TD items are under control. The measurement activity is used to quantify the amount of TD in a system and, in turn, enables the prioritization activity, i.e., ranking TD items that must be solved first. TD items can then be fixed during the repayment activity, which also deals with the problems caused by TD accumulation. Finally, it is also possible to avoid undesired TD through the prevention activity.
2.2 Software Development Tools and TD Tools
Software development tools play a critical role in modern software engineering practices, such as continuous software development, agile, and DevOps (Theunissen et al. 2021). They support nearly every phase of the software life cycle, from design to deployment and maintenance, and refer to diverse tools, like integrated development environments (IDEs), project management tools, static analyzers, and testing tools. These tools are essential for creating, analyzing, and managing software products (Theunissen et al. 2021).
Despite the widespread adoption and integration of general development tools into daily practices, TD tools remain under-utilized and face significant limitations (Martini et al. 2018). Systematic tracking of TD is still uncommon and, although TD tools often employ techniques such as static analysis to detect code issues, similar to some general-purpose tools, they frequently fall short in quantifying the consequences (interest) or likelihood of the debt, impairing communication and prioritization (Avgeriou et al. 2021).
Practitioners also report practical challenges with TD tools, including high error rates, complex configurations, poor integration with established workflows (e.g., IDEs and CI/CD pipelines), and lack of explainability (Biazotto et al. 2025). These shortcomings hinder their broad adoption and effectiveness. Addressing these issues can support (Biazotto et al. 2023; Jeronimo Junior and Travassos 2022; Biazotto et al. 2025): (i) development of more context-aware and user-friendly tools that can detect a broader range of TD types; (ii) leverage of multiple information sources; (iii) actionable insights, especially regarding the impact of debt; and (iv) seamless integration and greater automation within the modern software development ecosystem.
Several studies have investigated the usage of TD management tools, both in industry and OSS. Avgeriou et al. (2021) examined tools for TD measurement considering three types of TD (code, design, and architectural TD). The authors explored the tools’ features, popularity, and empirical evidence about tool’s accuracy (e.g., if the tool was evaluated in industry). While their study focused on identifying and reporting tools, our work focuses on investigating the concerns related to the usage of tools in industrial contexts, adding the practitioner’s point of view about TDM tools. Furthermore, we elicit a set of requirements for TD tools that is a new contribution compared to that previous work.
Other recent literature (Silva et al. 2022; Biazotto et al. 2023; Jeronimo Junior and Travassos 2022) states that stakeholders use isolated TDM tools. Jeronimo Junior and Travassos (2022) point to the need for easier integration of those tools within the current development toolset, towards a more holistic management of TD (i.e., performing more TDM activities and supporting them with tools). In the same direction, Biazotto et al. (2023) support the necessity of increasing the level of automation in TDM that could reduce developers’ workload during TDM. These recent contributions present theoretical aspects of tool usage but lack a practical perspective, which is addressed in our study.
2.3 Surveys on TDM
TDM in industrial contexts has been the focus of research since the early 2010 s, with numerous studies investigating best practices (Rios et al. 2020), causes and consequences of TD (Rios et al. 2018), and its impact on productivity (Besker et al. 2018). Although previous work has explored various aspects of TD, including development processes, tools, and practitioner practices, our study aims to delve deeper into the use of tools for TDM and the requirements necessary to better support practitioners.
Several foundational studies have highlighted the challenges and strategies in TDM. For example, research has identified agile practices such as code standards as effective in reducing TD, the types and severity of TD, and the reasons for its occurrence (Holvitie et al. 2014). In addition, some studies investigated TDM in OSS, especially in the identification of self-admitted TD (Li et al. 2022) and the procedures for repaying TD (Tan et al. 2023). However, the emphasis has largely been on processes rather than tools. Surveys have revealed that a significant proportion of practitioners do not use tools or rely on static analyzers, like SonarQube, Checkstyle, and Findbugs, without exploring the contextual factors influencing tool adoption and requirements (Ernst et al. 2015).
Other studies have examined TD measurement methods (e.g., person/hour metrics), risk analysis, and communication (Codabux et al. 2017). The findings show that the management of TD consumes a considerable portion of development time, with significant effort dedicated to understanding and measuring TD (Besker et al. 2018), particularly when related to architectural design (Besker et al. 2019). Despite these insights, there remains a gap in understanding how tools can reduce the effort required for TDM and enhance decision-making.
Furthermore, while some studies have proposed models for tracking TD (Martini et al. 2015) and explored regional practices in TDM (Apa et al. 2020; Silva et al. 2019), there is limited information on tool requirements, including features that support better interaction, automation, and efficiency. Our research addresses this gap by characterizing the concerns of practitioners and generating requirements that could improve the effectiveness and usability of TDM tools, ultimately enabling more efficient management practices.
It is also worth mentioning that all studies referenced in this section are successful examples of surveys that were conducted with practitioners to investigate TD, its management, and the use of tools to support it. Such studies are based on an online questionnaire, which, according to the authors of these studies, allowed them to reach more respondents in different countries and from a variety of backgrounds. In addition, most of these studies tend to balance quantitative and qualitative data to capture more knowledge about the TDM process. Regarding guidelines, the work of Kitchenham and Pfleeger (2008) and Wohlin et al. (2012) are used recurrently, indicating that they can be considered proper approaches for conducting online surveys. The guidelines presented in such approaches allow for a thorough planning phase, helping to define the target audience and design the survey instrument. We adopted the aforementioned guidelines and approaches in our study design, which is explained in detail in Section 3.
3 Study Design
Considering the main goal of this study (i.e., explanation of how practitioners reason about adopting TDM tools and elicitation of a comprehensive set of requirements for such tools) and the guidelines for selecting empirical methods in software engineering research (Easterbrook et al. 2008), we selected the survey method as the most suitable to achieve our goal. Specifically, surveys are suitable for studies that ask about the nature of a particular target population (Easterbrook et al. 2008). In our case, the population is software professionals, and we need to collect their opinions on how they reason and what they require from TDM tools. Our survey is then mainly qualitative. Qualitative surveys have been widely used as a tool for qualitative research (Braun et al. 2020). This type of survey focuses on collecting qualitative data using a variety of means (e.g., online questionnaires, via phone, printed sheets). Examples of qualitative surveys involve investigating phenomena such as the design of digital twins (Spyrou et al. 2023), Industry 4.0 (Duarte Alonso et al. 2024), and software requirements (Oliveira Neto et al. 2024). However, to the best of our knowledge, there is a lack of guidelines for qualitative surveys in software engineering. To avoid following an ad-hoc method that could aggravate the threats to the validity of our study and reduce its replicability, we opted to follow the main steps defined by Kitchenham and Pfleeger (2008) for the design of our study. We note that the core steps for designing our qualitative survey are the only aspects we share with a quantitative survey. We used a set of five online questionnaires to collect data. All questions in the questionnaires are open-ended, and the information we collected is qualitative. We followed the five phases (as illustrated in Fig. 1) to conduct our study:
- Phase 1: Setting the objectives (detailed in Section 3.1)
- Phase 2: Designing the survey (Section 3.2)
- Phase 3: Developing the survey instrument (Section 3.3)
- Phase 4: Obtaining data (Section 3.4)
- Phase 5: Analyzing data (Sections 3.5.1 and 3.6)
In the next sections, we decompose and explain the steps we followed in each phase, including the approach we followed to design the scenarios and carry out data analysis for our two research questions (RQ1 and RQ2 presented in Section 3.1) and the pilot study conducted to validate the data collection instrument and the data analysis methods (Section 3.3).

Overview of the main research method phases
3.1 Phase 1: Setting the Objectives
Taking into account our research problem and the gaps presented in Section 2, the objective of this study, structured according to the Goal-Question-Metric template (van Solingen et al. 2002), is to “ analyze practitioners’ opinions for the purpose of identifying requirements and rationale for adoption and usage with respect to TDM tools from the point of view of practitioners with varied roles in the context of both industrial and OSS development.” To achieve this objective, we defined the following research questions (RQ):
RQ1– How do practitioners reason about the adoption and usage of tools for TDM? In this RQ, we investigate the decision-making process behind the adoption of tools for TDM (i.e., how practitioners select tools), including factors regarding the tools’ usage (e.g., how practitioners prefer to execute certain tools). The practitioners’ reasons can provide insights into the perceived benefits of such tools, their concerns, and challenges to effective tool adoption.
RQ2– What are the requirements for tools that can support TDM? Practitioners can use information provided by tools for TD-related decision-making (e.g., prioritizing TD items to be repaid). Moreover, practitioners can use a variety of interfaces (e.g., dashboards and e-mail) to query such information. To complement the results of RQ1 (which focuses on the rationale for selecting and adopting tools), this RQ focuses on features (i.e., requirements) expected in TDM tools by practitioners. The answer to this RQ can support improving existing tools or developing new ones that fulfill the requirements.
3.2 Phase 2: Designing the Survey
According to Kitchenham and Pfleeger (2008)’s guidelines, there are two common types of surveys: (i) cross-sectional, which is a study that gathers information from participants at a single time; and (ii) longitudinal, which tracks changes within a population over time. Our study conducted a cross-sectional survey because practitioners base their opinions about tool usage on past experiences, a context in which such type of survey is suitable (Kitchenham and Pfleeger 2008). Moreover, a cross-sectional survey is efficient in terms of time and resources since it enables the collection of opinions of practitioners (with various profiles from industry and OSS development) in a single iteration.
3.3 Phase 3: Developing the Survey Instrument
This section describes the steps we followed during Phase 3 of our research method (i.e., Steps 3.1 to 3.4 shown in Fig. 2). Through these steps, we designed the scenarios and questionnaires to collect data.
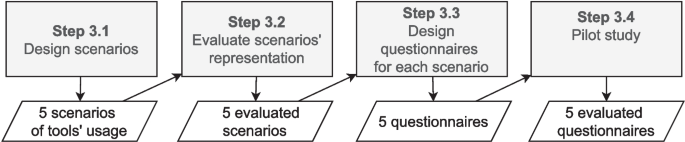
Steps to develop the survey instrument
As presented in a previous study (Codabux et al. 2017), practitioners are aware of the TD concept, but their understanding might differ from each other. To prevent misunderstanding, which could reduce the precision of practitioners’ insights, we decided to design the questionnaires based on concrete scenarios with examples of TDM approaches (Step 3.1 in Fig. 2), instead of the concepts of the TD metaphor (e.g., principal, interest, interest rate). We expected that this strategy would improve the communication with practitioners and potentially lead to more and better insights from them.
While using a set of concrete scenarios can improve communication with practitioners, we needed to ensure that the scenarios are sufficient to discuss all aspects of TDM. To achieve this, we designed five scenarios that cover all activities related to TDM. While there are many ways to address each activity, we chose the most common approaches for each activity (e.g., TD identification can be performed using source code or natural language (Biazotto et al. 2023) as the main input). Additionally, it is worth noting that some activities are more prominent in certain scenarios, while others are indirectly supported. For instance, Scenario 4 (S4) is primarily about communicating TD (as it represents a notification script). Since it also contains a quality gate (i.e., SonarCloudFootnote1), TD is also measured in this scenario to validate a threshold used for notifying practitioners; hence, TD measurement is also addressed in S4.
To select which tools would be presented in each scenario, we revisited the studies of Biazotto et al. (2023) and Silva et al. (2022), which present tools for TDM. We analyzed the tools considering for instance how they could be integrated with other technologies commonly used in modern software development (e.g., CI managers and code review platforms). For instance, SonarQubeFootnote2 was reported as one of the main tools for TDM (Silva et al. 2022) and can connect to GrafanaFootnote3, which is a well-known open-source dashboard. Based on such evidence, we proposed S2, which shows an alternative to visualize TD information (provided by SonarQube) within Grafana.
The scenarios were initially represented using the dynamic diagram of C4 ModelFootnote4 to check the technical feasibility of the scenario. This means we checked if the tools we represent in the scenarios could be integrated. C4 diagrams can capture both tools deployed as stand-alone (e.g., SonarCloud) and components deployed within other tools (e.g., a widget within Grafana Dashboard). It can also represent runtime interactions (e.g., an API call). Our initial goal was to use the C4 models as the visual aid in our questionnaires. Then, to check if the representations were clear, we requested feedback from researchers in our group (Step 3.2 in Fig. 2). Their feedback pointed to difficulties in analyzing the diagrams due to the abstraction level. To tackle this problem, we decided to represent the scenarios using mockups, which we assumed could reduce the abstract nature of the diagrams. This is because presenting a real screen brings the solution closer to practitioners’ usual interaction with tools (i.e., such interaction does not rely on architectural models as presented in our initial representation). The mockups were evaluated in a pilot study (see Section 3.3), from which we noted a better understanding of the scenarios. The final version of S2’s representation is presented in Fig. 3 to exemplify the mockups. Due to space constraints, details about all five scenarios (including representations using C4) are omitted here and can be found in our replication packageFootnote5.
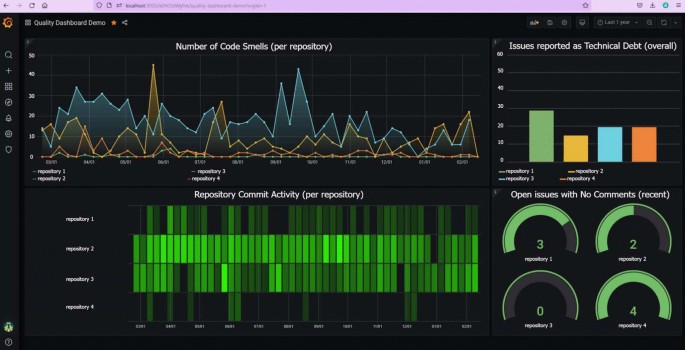
Example of S2’s mockup
It is worth highlighting that we cannot claim that those scenarios capture all possible usages of tools. Our goal is to provide examples closer to modern software development activities in practice and can drive improvements on existing tools and strategies for TDM. We also acknowledge that using such scenarios might pose threats to the validity of this study that were mitigated using several strategies (see Section 6).
The five following scenarios to support the data collection for our study are (in parentheses, we state which TDM activities each scenario addresses):
- S1 (identification, documentation, and prioritization): As stated by Martini et al. (2018), one of the requirements posed by practitioners is the automated tracking of TD items. The authors also state Jira is one of the most cited tools to support TD tracking. Jira issues have also been used as a source to identify TD items. More specifically, several machine learning models have been proposed and tested to identify TD items using natural language (Li et al. 2022). Consequently, an automated solution for identifying TD in Jira issues and labeling them could be useful for prioritizing TD items to be repaid. Thus, S1 presents a bot that automatically labels issues within Jira.
- S2 (communication and monitoring): Communicating information about TD is paramount for decision-making. The use of dashboards in software development can help the visualization of quality issues. There are at least a few studies that investigate the usage of dashboards for TDM (Arvanitou et al. 2019; Mendes et al. 2019; Li et al. 2023), since TD relates to quality issues and presenting information about TD in a dashboard would help keep TD items visible for maintenance purposes. S2 shows a dashboard that contains information that might help in TDM (see Fig. 3).
- S3 (identification and repayment): Refactoring is a well-known task for paying back TD and is commonly performed by practitioners (Rios et al. 2020). There is evidence in literature stating that the suggestion of refactoring opportunities can help practitioners decide which TD items should be repaid (Martini et al. 2018). To support this process, plugins could be installed in IDEs to support the identification of code smells and suggest refactored code. Hence, S3 shows an IDE plugin that suggests refactoring actions.
- S4 (communication and measurement): Continuous integration and continuous deployment (CI/CD) is a practice widely used in software development (Fitzgerald and Stol 2017). This practice focuses on automating parts of the deployment process such as integration tests. Since CI/CD is sometimes completely automated and happens every time new code is submitted to the production environment, integrating a TDM strategy as a step in the CI/CD process could be a good alternative to raise awareness about TD. In fact, recent literature (Lunde and Colomo-Palacios 2020) explored how DevOps techniques can support TDM. Considering this example, in S4, we present a bot that submits reports to mailing lists after CI cycles.
- S5 (identification and prevention): Code review is a task performed in a new patch to ensure that it is correct to be merged into a software project. This task is performed in industrial and open-source projects, and some TD items can be identified during code review, preventing them from being inserted in source code (Kashiwa et al. 2022). S5 presents a bot that supports code review by providing a report about the amount of code smells in the new patch.
In Step 3.3 (see Fig. 2), we developed five questionnaires (one per scenario) using Google FormsFootnote6 and distributed them online, in order to reach as many respondents as possible from our target population, that is, software practitioners from both industry and open source projects. Since the scenarios cover aspects commonly present in open-source settings (e.g., code review in pull requests) and industrial settings (e.g., dashboards), collecting opinions of practitioners who work in both settings helps enhance the generalizability of our study. The questionnaire starts with questions on practitioners’ requirements and rationale regarding TD tools, followed by open-ended questions to capture more insights and nuances on opinions about both requirements and rationale. An example of an open-ended question in S4 is: “When would this type of notification [about TD] be useful? For example, after each CI cycle, or if a criterion is met (e.g., the amount of code smells exceeds a threshold). Please justify your answer”. With this question, we explored the requirements (condition for using the notification) and also the rationale (asking practitioners to justify the answer). Hence, we collected data to answer RQ1 (rationale) and RQ2 (requirements).
While the collected data is mainly qualitative, quantitative data was collected to evaluate the overall usefulness of each scenario (using Likert scale). According to our pilot study, each questionnaire would take around 10 minutes to be answered. The full questionnaires can be accessed in our replication packageFootnote7.
In Step 3.4, as depicted in Fig. 2, we executed a pilot study to test our scenarios and questionnaires. This pilot study aimed at assuring the understandability, relevance, and feasibility of our survey instruments before performing the full-scale conduct. The participants in this pilot were five researchers from our research groups at the University of Groningen and the University of São Paulo. Each participant was assigned only one specific scenario to evaluate, which ensured a focused and extensive review of individual elements.
To carry out the evaluation, participants had to simulate to be the real survey respondents. They were asked to observe the time they took to complete a scenario and questionnaires. Moreover, they were invited to note any problems experienced while accomplishing their task, such as questions that were not clear or vague, the incomprehensible meaning of a question, or when the descriptions in the scenario were incomplete. According to the results of the pilot, we can find out that each case could be finished in about 10 minutes. Such a length is proper because it is long enough to ensure that meaningful data could be gathered but short enough to raise the response rate.
Based on the issues identified, several refinements were made to the scenarios and questionnaires. The most important changes were rewording the question text for better clarity. For example, the term “technical debt” was avoided in some questions because, feedback, showed that some participants might misunderstand it, leading to inconsistent responses.
A new question was added to the questionnaire to S1: “If not, are there specific circumstances (e.g., when reaching a certain threshold) where notifications about issues would be beneficial?”. Based on this pilot feedback, the original set of questions was unable to capture opinions about when and how notifications could turn out to be useful. With this question, we tried to get more detailed information about the preferences and expectations of the responders concerning issue notifications.
Finally, we acknowledge that the data from this pilot study were not part of the analyzed dataset, which comprised 89 valid answers.
3.4 Phase 4: Obtaining Data
To recruit respondents (i.e., Phase 4 in Fig. 1) and considering our population, the study used convenience sampling (Linåker et al. 2015), a non-probabilistic sampling in which it is not possible to observe randomness on the selected units from the population. Specifically, an invitation to participate and further disseminate the survey was distributed by e-mail across the personal networks of the authors, to contributors of well-known OSS projects (e.g., from the Apache Software Foundation) and using LinkedIn private messages. We also posted the invitation on LinkedIn and X/Twitter feeds as an alternative to reach more practitioners.
3.5 Phase 5: Analyzing Data
We adopted two different data analysis methods to answer our RQs. Specifically, thematic synthesis (Cruzes and Dyba 2011) is used for answering RQ1, while requirements elicitation is used in RQ2. The next two subsections describe in detail the data analysis procedures.
3.5.1 Step 5.1: Analyzing Data for RQ1
For answering RQ1, we used thematic synthesis for recognizing, interpreting, and presenting patterns (themes) within data in qualitative research. Since the data we collected are mainly qualitative, we deemed thematic synthesis as an appropriate method to use in our context. Figure 4 depicts the steps followed in such a process.
Steps to carry data analysis for RQ1
We performed five tasks, aligned with the guidelines by Cruzes and Dyba (2011):
- Extract data: In our study, the data extraction step was the collection of responses, i.e., we extracted the data by collecting 103 responses, from which 89 were valid. Hence, there is an overlap between Step 4 (Obtaining data) and this first sub-step of thematic synthesis. Thus, both activities are represented in Fig. 1 as Phase 4.
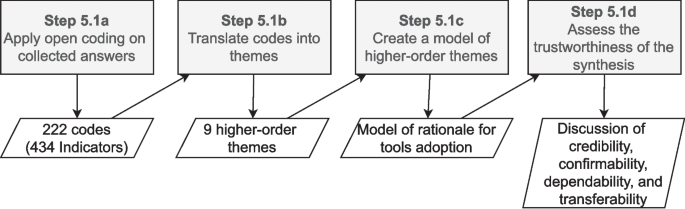
- Code data: We started applying open coding to break down practitioners’ answers into smaller pieces of information, which are called “indicators” (Step 5.1a in Fig. 4). Those are represented by a code (i.e., a word, phrase, label, etc.), which is used to navigate over different indicators and compare them using constant comparison. For instance, one answer from the survey states that: “s1_r2: In general, such notifications should not become yet another source of useless spam everyone automatically ignores.” During open coding, we assigned the code 1-notifications are not useful to that indicator (the number 1 refers to S1), which helped us compare that indicator with other ones. We used an integrated approach (Cruzes and Dyba 2011) to code the data. Initially, three authors coded a sample of 30 answers (which were randomly selected), generating as many codes as possible from the data. After that, they discussed the generated codes until reaching an agreement. Next, the first author and an external collaborator coded all the answers, using both the previously generated set of codes and proposing new codes, which were necessary to better represent indicators. After all, the data was coded by the first author and the external collaborator, all four coders (the three authors that were involved in the open coding and the external collaborator) discussed the codes and reached an agreement on the indicators and codes to represent them. Considering that we have five different scenarios, we assigned the scenario number to the codes (e.g.,“2-dedicated TD dashboard is useful” is a code in S2) to help us check if any of the scenarios is biasing the data analysis (i.e., a certain concept in the model is only supported by indicators form a specific scenario). The open coding sub-step resulted in a set of 222 codes and 425 indicators. Each scenario resulted in a different number of codes, i.e., S1=33, S2=75, S3=28, S4=35, S5=51. Table 1 presents a few examples of codes and indicators generated during the open coding sub-step.
- Translate codes into themes: A theme emerges through the process of coding, categorization, and reflective analysis. They represent abstract constructs that imbue recurring experiences with meaning and coherence. In this study, we followed three steps of coding (open, selective, and theoretical coding) for translating the code into themes (Step 5.1b in Fig. 4). The emphasis of this approach is constant comparison, which aids in mitigating potential biases and enhancing data exploration. It is important to note that we did not adhere strictly to all its steps of Grounded Theory (Strauss and Corbin 1990) and, therefore, the resulting themes cannot be claimed as a fully developed theory. Interactive data collection and analysis were not employed, thus theoretical saturation cannot be guaranteed, a point further discussed in Section 6.
- Create a model of higher-order themes: The themes that emerged in the previous steps were further explored and interpreted to create a model consisting of higher-order themes and the relationships among them (Step 5.1c in Fig. 4). In this study, we propose a model that captures the main concerns that practitioners have while reasoning about tools’ adoption (see Section 4.2).
- Assess the trustworthiness of the synthesis: Assessing the reliability of interpretations derived from thematic synthesis involves constructing arguments supporting the most plausible interpretations (Step 5.1d in Fig. 4). Research findings do not have a singular correct interpretation but rather the most probable interpretation from a specific standpoint. Therefore, enhancing trustworthiness entails presenting findings in a manner that encourages readers to consider alternative interpretations. To evaluate the reliability of the results, we examined the concepts of credibility, confirmability, dependability, and transferability. The assessment of trustworthiness is detailed in Section 6.
3.6 Step 5.2: Analyzing data for RQ2
To answer RQ2, we elicited a set of requirements for TDM tools, following the steps illustrated in Fig. 5. For eliciting such requirements, we reviewed the codes/indicators previously created during open coding for RQ1 (Step 5.1a in Fig. 4) and filtered those presenting information that could be translated to a requirement (Step 5.2a in Fig. 5). For instance, the code “2-group smells by type” represents indicators such as “s2_r8: maybe a classification of which types of code smells are more common in each repository” and “s2_r13: A list with smells grouped by type”. Such indicators point to a feature that could be implemented in a dashboard, thus it was included for the next step of the requirements elicitation process. For this step, we considered all codes generated during open coding, even those with few indicators, because our goal was to report any requirement pointed out by practitioners. Although requirements pointed out by few or even a single respondent have a low level of consensus within our sample, such requirements may represent concerns common to other practitioners who were not surveyed.
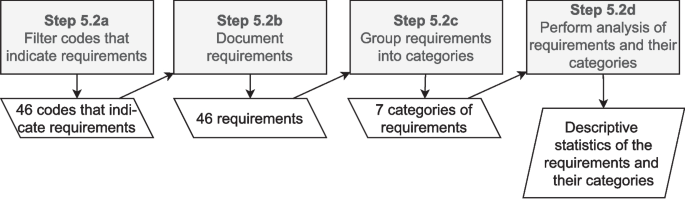
Steps to carry data analysis for RQ2
After filtering codes and indicators, we documented the requirements using Pohl (2016)’s template (Step 5.2b in Fig. 5), as presented in Fig. 6. The template is composed of five elements:
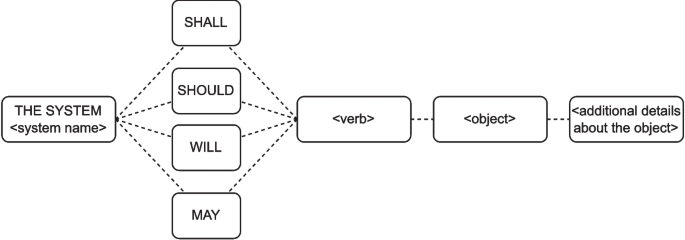
Template for documenting requirements using natural language (Adapted from Pohl 2016)
- system name: It indicates the tool presented in the scenario from which the requirement was extracted;
- modal verb: A modal verb that indicates the obligation for each requirement, i.e., legally obligatory requirements (shall), urgently recommended (should), future requirements (will), and desirable requirements (may). We decided to use the verb “will” to document all the requirements. This is because we cannot prioritize the requirements from the data we have available. We can, however, claim that all requirements are future requirements. It is worth highlighting that these requirements must be prioritized in the future, and we discuss this in Section 5;
- verb: It refers to the core of each requirement, i.e., the functionality that it specifies (e.g., present, enable, notify, etc.). The verb depicts the system behavior using a requirement;
- object: Some verbs need an object to be complete. For instance, the verb “present” is amended by the information of what is being presented and where it is presented; and
- additional details about the object: It refers to details about the object that make the requirement clearer, for instance, the font size of the printed text.
We chose this template for three main reasons. First, it is specific for documenting requirements using natural language, which was the data we had available to elicit requirements. Second, it is a well-known template, widely accepted and cited by the requirements engineering community (it was cited more than 600 times on Google Scholar). Finally, it enabled us to map several aspects of the requirements (e.g., system and process), enhancing the replicability of the process.
Considering the previous example (“2-group smells by type”), we identified the following elements: (i) a dashboard is the system since it was the example presented in S2, from where the code/indicators were collected; (ii) the modal verb is “will” since it is a future requirement; (iii) the verb is “present”, since the list of smells is presented in a dashboard; and (iv) “a list of code smells grouped by type” is the object and represents “what” may be presented. Finally, we did not identify additional information for this requirement. Grouping all the elements of the model, we ended up with the following requirement: “The dashboard will present a list of code smells grouped by type.”
To enable better analysis and discussion of the requirements, we also grouped them into categories and sub-categories, considering the verb and object in each requirement (Step 5.2c in Fig. 5). We also identified and analyzed the requirements considering both the TDM activities and TD types. Since the implementation of these requirements may impact the quality attributes of TD tools (e.g., requirements for integrating tools might impact the tool’s interoperability), we also provide an analysis showing which quality attribute of ISO 25010 (ISO/IEC 25010 2023) are related to each requirement.
After grouping the requirements, we used descriptive statistics to analyze both the requirements (e.g., number of respondents supporting each requirement) and the categories (e.g., number of requirements per category) (Step 5.2d in Fig. 5).
4 Results
4.1 Demographics of Respondents
Considering all scenarios (i.e., S1–S5), we received 103 responses, from which 11 were blank and then excluded. Considering the population of this survey (software practitioners), we also excluded three more answers, in which respondents informed their roles as PhD Students, Students, and Researchers. Thus, we considered 89 valid responses to address our RQs.
Each scenario is independent, thus practitioners filled in questionnaires for one or more scenarios, which resulted in different amounts of responses per scenario, i.e., S1 had 21 responses (n=21), S2 n=18, S3 n=18, S4 n=11, and S5 n=21. Table 2 shows the demographics per scenario and practitioners profile characteristic (i.e., role, experience, and education). It is worth highlighting that the responses were anonymous, and we cannot determine how many individuals participated in the survey. Hence, the demographics can be interpreted as the amount of responses provided by practitioners with a certain profile characteristic.
The practitioners were asked about their roles in software development. To collect their roles, we provided a set of options based on previous surveys related to TD in industry and OSS (Rios et al. 2020) (i.e., Software Architect/Designer, Software Developer, Project Manager, Quality Assurance). Practitioners could also indicate their roles in an “Other” field if the pre-defined roles did not describe their current position. According to Table 2, around 66% (59/89) of the responses were provided by software developers, while software architects/designers accounted for 21% (19/89). Other roles, such as customer engineer and project manager, also responded to our survey. This indicates that our sample might reflect developers’ point of view, and this might be taken into account when interpreting our results (we further elaborate on this aspect in Sections 5 and 6). However, we note that, as we mentioned in the previous section, our main goal is to provide initial evidence on the rationale of practitioners for adopting tools and the requirements for those tools, and such rationale and requirements must be further explored.
Regarding practitioner’s experience, more than 72% of the responses (64/89) were provided by practitioners with more than 5 years of experience, with around 60% of the responses (53/89) being provided by those with more than 10 years. Since many responses came from experienced practitioners, we expected the derived insights to also reflect this characteristic. Nonetheless, since newcomers, with less than one year of experience, are under-represented (around 1% of the responses), requirements that support the needs of these individuals may be lacking.
Most responses were provided by graduates of bachelors (34/89) or Master’s (28/89) degrees. Moreover, 11% of the responses (10/89) were provided by practitioners who have not finished their bachelor’s degree. Since most respondents have an academic background, we conjecture that they have some understanding of the TD metaphor (e.g., what is TD, what causes TD, how to measure TD, etc.). This is because the TD metaphor is usually covered in software engineering courses (Avgeriou et al. 2023).
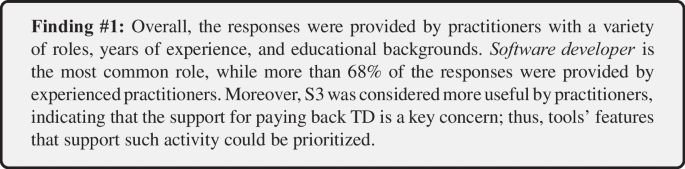
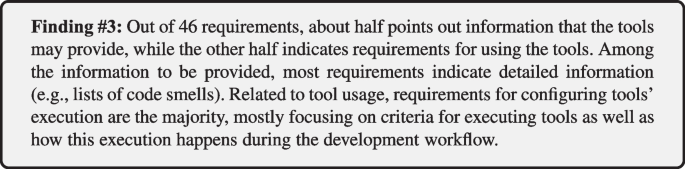
We also investigated the overall perception of the scenarios’ usefulness. The results were collected with a Likert scale related to the following statement: “I consider this scenario useful”. Most practitioners considered S1, S2, S3, and S5 useful, as presented in Table 3. For S4, the same amount of practitioners consider it useful and not useful. Among all scenarios, S3 is the one considered most useful, with 9/18 practitioners strongly agreeing with the statement. This might indicate that the support for paying back TD (represented in S3) is a key concern for practitioners. S4 and S5, on the other side, are the ones with the highest number of practitioners disagreeing or strongly disagreeing with the statement (total of 5 = 3+2). In summary, our first finding is the following:
4.2 RQ1 – Tool Adoption Rationale
We aimed to understand how practitioners reason about tools for automating TDM and identify factors that influence decision-making processes regarding tool selection and usage. Figure 7 presents a model derived from the answers and composed of 10 themes and their relationships. These themes and relationships were defined using constant comparison. We compared codes and indicators to define themes, grouping them based on their main topic. For instance, consider the following indicators: “s3_r8: A patch needs to be applied to get reviewed, because auto-patches (from my experience) always require human validation,” and “s1_r8: Auto-labeling in principle seems a bit interesting, but I tend to think that issue triage is best done as a human process.” When analyzing and reflecting on these indicators, we observed that they both highlight the need for humans to review tools’ execution and outputs, guiding us to define the theme of .
The relationships were defined during Step 3 of thematic synthesis (Step 5.1c in Fig. 4). Essentially, a relationship is defined and supported in two cases: (a) two or more indicators in the same answer point to two different themes suggesting a link between them, and (b) a single indicator is related to two different themes, also pointing to a link between them. To exemplify these two cases, consider the relationship between and :
- (a)the indicators “s1_r4: What label should the bot use in that case? Can it assess the situation properly and propose more than 1 labels?” and “s1_r4: users might want the bot to wait for confirmation on the labels” came from the same answer and were related to and , respectively.
- (b)the indicator “s3_r7: Depends on what such refactoring proposal tool actually does. One of my colleagues seems to blindly accept all of those and the result is a pure DRY code that is hard to read.” was related to both and , because it indicates that code proposed by tools are usually “dry” (i.e., low quality) and must be manually reviewed.
The examples in both cases support the relationship between and , indicating that practitioners intervene in tools execution and output due to concerns regarding the quality of the tool.
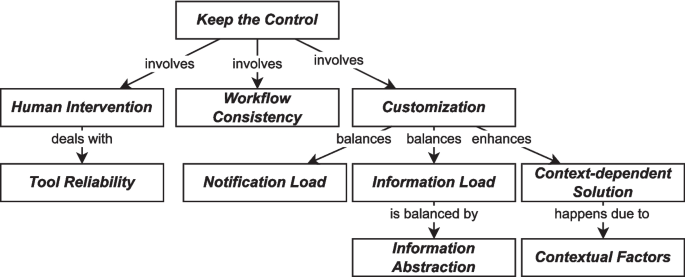
Model of practitioners’ rationale of tool adoption
The central theme of the model is , a theme that conveys the desire of developers to maintain authority and oversight over the execution and outputs of tools used for TDM. It reflects a context in which developers acknowledge the benefits of automation but want to retain control over when, how, and what changes are applied to their code by tools. This reflects, for instance, a preference for manual intervention in the process rather than complete automation: “s3_r14: I prefer to execute at my discretion, simply because I prefer to have more control over my code.” The theme also points to a preference for human judgment over automated processes, especially when it comes to code changes: “s3_r18: Leave the decision of accepting the suggestion to the developer and don’t fill Git with automated patches.” Overall, respondents emphasized the importance of human judgment and intervention in the development process, even in the face of increasing automation.
To help practitioners keep control over tools, is highly used. It refers to the practice of manually executing tools rather than relying solely on automated solutions: “s1_r8: Auto-labeling in principle seems a bit interesting, but I tend to think that issue triage is best done as a human process.” The theme emphasizes the importance of human judgment in tasks such as issue triage, labeling, prioritization, and reviewing code changes. Another way to look at it is that TD, by nature, causes degradation in software quality, which in turn hinders control over software development execution. TDM through manual intervention (e.g., issue triage) can help practitioners to improve (or regain) control over software development. The following types of intervention could be identified:
- Manual issue labeling and triage: Practitioners prefer to add labels to tickets related to TD manually, recognizing the importance of accurate labeling for effective organization and reporting: “s1_r3: however if the ticket is related to TD, the creator itself can add the label. It is not so realistic that the description mentions tech debt, but the label is not added, especially if reports/filters depend on it.”
- Issue prioritization: Practitioners express a preference for human-driven prioritization over automated solutions, citing humans’ superior ability to assess and prioritize issues effectively: “s1_r8: Prioritization should be done by the team or the individual that owns a component.”
- Choosing the information to be visualized: Practitioners claim that it is important that a tool enables the selection of which information is presented: “s2_r20: the dashboard could get bloated if the number of repositories gets too big, but you could filter by a specific project.”
- Obtaining and reviewing refactoring suggestions: Reviewing refactoring suggestions is also necessary to tackle potential mistakes that tools can make: “s3_r3: I would prefer an IDE plugin and would not prefer automatic patches AT ALL. I may not want to apply the suggestions, and the tool can also make mistakes. I want control over when, how, and what I apply.”
Some practitioners claim that is one of the main concerns that lead to the need for human intervention. Practitioners are often skeptical about the quality of suggestions provided by tools: “s1_r11: Not useful for me, as I’d not trust the bot to properly label the issue by simply looking at the description.” They also claim that suggestions provided by tools are often too simplistic, and it is not worth developers’ time to review them: “s3_r2: In my experience such [refactoring] suggestions are either too simplistic, miss the mark or don’t detect most interesting situations worthy of developer attention.” Overall, the practitioners claim that the usefulness of a tool depends on how good its output is: “s5_r8: This [usefulness] would depend heavily on the quality of the reported problems.”
Another concern regarding the reliability of tools is the performance, which must be good enough: “s3_r5: Proactively [providing refactoring suggestions] since it’d be good to see suggestions on the fly. The performance must be good though.”. Performance is also a concern due to potential disturbance in developers’ workflow (e.g., practitioners have to stop coding to wait for automated suggestions). To avoid such disturbances, practitioners would prefer for the tool to be executed later on the development cycle (e.g., at commit time) and not in real-time (e.g., while practitioners are coding): “s3_r18: Proactively if not at a relevant performance cost. Otherwise, it could be triggered at commit time.” This points to another concept: .
The refers to how easily TDM tools are integrated with existing tooling (e.g., IDE), and the level of disturbance that these tools cause on the current workflow: “s2_r15: Moreover, even if you propose them [practitioners] a valid solution, they might not want to because it might alter their workflow.” The consistency of workflow can be achieved with two strategies. In the first case, developers use TDM tools within other tools already used by them (e.g., IDEs): “s3_r14: I don’t like to install external tools when working on an IDE.” This means that practitioners tend to integrate tools within other tools (including TDM tools), for instance, a plugin in an IDE) to avoid having many tools to manage: “s3_r16: At code level I will prefer within the IDE primary due to its usability features, such as Copilot, CodeGPT, and similar aids.” The second strategy to keep workflow consistency is using steps on the CI cycle, i.e., centralize the solution in a single tool instead of installing and managing multiple TDM tools individually: “s5_r12: Another option [instead of executing a bot] is to have a step in CI so it can inform or break the build (depending on the context/type of project).”
Keeping control over the execution of tools and the output also involves , a theme that indicates practitioners’ concerns regarding tailoring tools for their development environment and workflow: “s1_r2: The idea [of automated issue labeling] sounds good on the surface, but I highly doubt it would be useful without extensive intelligent customization options.” The customization options involve many aspects (e.g., results of tools, people to notify, etc.) and vary in different scenarios. For example, one of the main concerns in S1 is about the frequency of notifications (also see below): “s1_r22: You should be able to configure queries and notifications based on labels, for example.”. Similarly, in S4, one concern related to customization is what threshold should trigger reports: “s4_r10: I’m not too fond of e-mail for this kind of checks [code smells checks], but if I need to consider e-mails I’d appreciate a setup in which I get an e-mail after a threshold for a project I’m interested in is breached and a summary of the tracked metrics once every week.” Overall, tailoring tools helps practitioners to extract more value from TDM tools: “s1_r21: Yes, depending on the label it would be cool [to have such a bot that labels issues], maybe just add a control so it doesn’t notify for not so important labels?”.
The need for configuration options to a large extent points to another concern: the number of notifications and information provided by the tools, leading to the themes and , respectively. Regarding , it refers to the number of notifications sent by tools (e.g., sending e-mails that report problems during CI). Practitioners highlighted that very often the amount of notifications is too high and can cause stress: “s4_r7: Today I turn off any kind of automatic notifications to not become stressed.” Besides, too many notifications can distract developers, leading them to ignore even the important ones: “s4_r1: CI are notoriously hard to get all green reliably, another source of constant CI notifications would distract from what matters.”
relates to the amount of information and suggestions provided by tools. Practitioners claim that dashboards presenting many different pieces of information are not very useful: “s2_r16: Depends on the UI, but if the UI isn’t too bloated, maybe widgets and graphs would be fine.” Overall, practitioners are interested in receiving less information, but more valuable pieces of information: “s2_r19: Maybe you can create an algorithm to suggest a bite-sized list of smells that could be tackled next.”
To deal with information load, practitioners tend to summarize information to facilitate the analysis, which refers to the theme of . For example, rather than dealing with long lists of code smells, practitioners prefer to analyze code smells in groups and then identify areas of interest in the project: “s2_r12: [group by package/file] because the package/file division would help on prioritize the issues on focusing the team efforts in specific parts of the software.” In addition, summarizing information on a temporal basis is a preference to check the evolution of the project’s overall quality:“s4_r6: More than time, it would be desirable to see the evolution of the numbers over time to show progress/degradation of the software.”
Another concern related to customization is , which indicates that practitioners find it impossible to have a solution that fits all companies: “s2_r15: Every company has its metrics and its ways of keeping track of issues and technical debt (some don’t even do it). Therefore I think it’s very hard to find a solution that fits all.” Thus, helps achieve a , enabling a certain tool to cater to the varying demands of different organizations. For instance, practitioners claim that: “s1_r4: That [a notification about a TD label] would make sense in the scenario where a developer or a company is highly focused on a particular feature. Adding a label that notifies the manager and the developer of an issue around that feature would help them.”.
Finally, a context-dependent solution is highly impacted by : characteristics of the company, team, and project that determine how a tool should be tailored (i.e., which customization options need to be updated). For instance, the maturity of a team impacts the usefulness of TD labels: “s1_r22: the bot offering the label might be good to help teams that don’t tackle tech debt yet”. Another factor that impacts the tool usage is the severity of the issue: “s1_r18: This is a matter I consider highly context-dependent. Notification would be very useful in critical scenarios that require immediate action. Otherwise, I don’t find it as useful because issues are typically monitored with some frequency in software development projects.” Overall, the themes and capture a concern that companies’ policies and decisions regarding TDM might change, and tools should be prepared to address such changes with customization options. Such themes also help elaborate on the theme , helping in the understanding and usefulness of the model.
We analyzed how many indicators per scenario support each one of the themes, as presented in Table 4. According to the table, the most common theme is , which is supported by 34 indicators. In addition, , , and are supported by indicators from all five scenarios, indicating that such concerns are always present, regardless of the tools used.
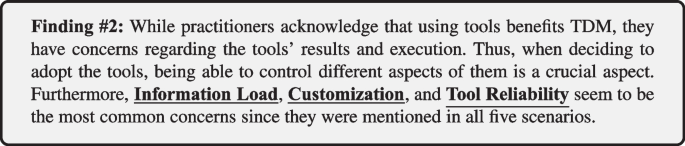
Analyzing how each scenario contributes to the model, we see that S1, S2, and S3 contribute with around 50 indicators each, while fewer indicators were collected from S5 (33 indicators). For S4, the lower amount of indicators (11 indicators) might be explained by the lower amount of responses (12 responses) compared to the other scenarios (which had around 20 responses each). Next, our second finding is:
List of elicited requirements, the categories and subcategories of requirements, and the related TDM activities
4.3 RQ2 – Tool Requirements
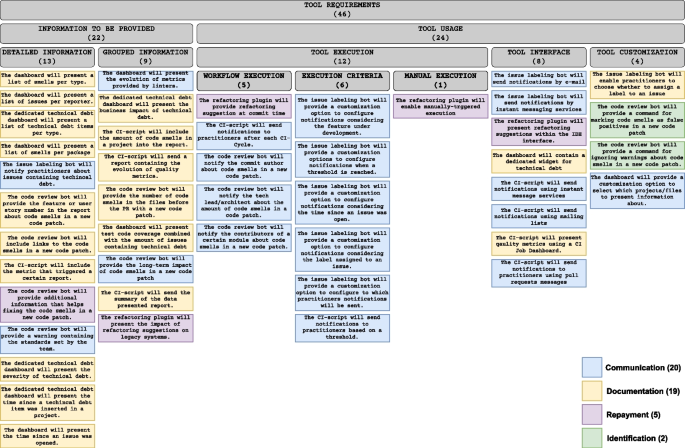
To answer RQ2, we elicited and documented 46 requirements for TDM tools. To facilitate the understanding of the requirements, we categorized them by comparing their verb and object (refer to Section 3.6 for more details). For example, in the requirements “The dashboard will present a list of smells grouped by package” and “The CI script will include the amount of code smells in a project into the report,” both objects refer to information that practitioners want to query from tools (i.e., list of smells and amount of code smells, respectively). Hence, we grouped them into the category “information to be provided”. We further refined the categories into subcategories that could capture the nuances between the requirements in the same category. In the previous examples, “list of smells” belongs to detailed information about each smell in a project, and “amount of code smells” represents grouped information. Figure 8 presents the list of requirements and grouping structure. It is worth highlighting that the requirements and categories are related to the themes presented in RQ1; we will discuss this relationship in Section 5. In the following, we present the requirements grouped according to the aforementioned categories. It is not possible to infer priorities among the requirements because of three main reasons: (i) our main goal was to collect requirements for TDM tools in general, so practitioners suggested improvements on tools but did not provide any additional information on priorities; (ii) respondents did not have access to all requirements, i.e., the information that they would need for prioritizing requirements, so their prioritization analysis would be partial; and (iii) we note that prioritizing the requirements involves analyzing context-specific information (e.g., the needs for a given project), which falls out of the scope of this study. Nonetheless, we see value in prioritizing the requirements and plan to do it in future work (we further discuss this in Section 7). The two categories and their subcategories are:
Information to be provided/Detailed Information (13/46):
This subcategory includes tool requirements pointing to the need for information with finer levels of granularity. The category consists of requirements such as sending notifications for each issue with a certain label (e.g., “The issue labeling bot will notify practitioners about issues containing technical debt”), listing code smells (e.g., “The dashboard will present a list of smells per package”), and listing of issues (e.g., “The dashboard will present a list of issues per reporter”). Detailed information can enable practitioners, for instance, to compare code smells and prioritize them.
Information to be provided/Grouped Information (9/46)
This subcategory focuses on functionalities aimed at presenting aggregated information related to TD. It includes requirements that point to clustering information to enable decisions, for example, regarding the part of the project that should be the focus of maintenance actions. Grouping information enables stakeholders to gain an understanding of the overall state of TD in the project. Examples of such requirements are related to the number of code smells (“The CI-script will include the amount of code smells in a project into the report.”), business impact, i.e., TD interest (e.g., “The dedicated technical debt dashboard will present the interest of technical debt”), and code coverage (“The dashboard will present test code coverage combined with the number of issues containing technical debt”). The category also includes requirements for metrics and trends, such as the evolution of code quality metrics provided by linters (e.g., “The dashboard will present the evolution of metrics provided by linters.”) In contrast to the detailed information, grouped information requirements help stakeholders to discern software areas that demand attention, prioritize actions based on such areas, and formulate strategies to address TD on those areas, as stated in one of the answers:“s2_r12: Y”es, because the package/file division would help prioritize issues to focus team efforts in specific parts of the software.
Tool usage/Tool execution/Workflow execution (5/46)
This subcategory encompasses requirements for executing tools alongside the workflows within a software development process (e.g., continuous integration steps). Essentially, workflow-execution-related requirements focus on: (a) reducing the complexity related to the integration between TDM tools (e.g., SonarQube) and development tools (IDEs) and (b) reducing the disturbance that TDM tools may cause to developers. Essential requirements include optimizing refactoring to avoid bothering developers (e.g., “The refactoring plugin will provide refactoring suggestion at commit time”), using existing CI steps as triggers for running analysis and notifications (“The CI script will send notifications to practitioners after each CI cycle.”) and triggering notifications based on existing development steps, such as committing code to repositories (“The code review bot will notify the commit author about code smells in a new code patch.”).
Tool usage/Tool execution/Execution criteria (6/46)
This subcategory focuses on configuring tools such as the issue labeling bot and CI scripts to trigger notifications or actions based on specific criteria. Examples include notifying practitioners when a new issue related to a certain feature/file is open (e.g., “The issue labeling bot will provide a customization option to configure notifications considering the feature under development”) and the time since an issue was opened (e.g., “The issue labeling bot will provide a customization option to configure notifications considering the time since an issue was open”). The requirements in this category indicate that some tools could be configured to execute proactively (i.e., with more automation). This suggests that higher levels of TDM automation are helpful for some tasks (e.g., notifications about TD).
Tool usage/Tool execution/Manual execution (1/46)
In addition to automated functionality, practitioners also pointed out to manual execution. This subcategory indicates that practitioners also want to exercise control over when actions are executed within the development process (e.g., “The refactoring plugin will enable manually-triggered execution”). This manual execution capability provides flexibility and autonomy in managing TD according to practitioners’ judgment.
Tool usage/Tool interface (8/46)
This subcategory refers to how tools present information to practitioners. Some requirements include communication channels such as e-mail (e.g., “The issue labeling bot will send notifications by e-mail”) or instant messaging services (e.g., “The issue labeling bot will send notifications by instant messaging services”). Another type of interface is a dashboard, which should present a dedicated widget for TD, offering practitioners easy access to relevant information (e.g., “The dashboard will contain a dedicated widget for technical debt”). Practitioners may also demand a CI Job Dashboard to show the quality metrics collected during CI cycles. IDEs are also appropriate, especially when querying data such as refactoring suggestions (e.g., “The refactoring plugin will present refactoring suggestions within the IDE interface”). Overall, this subcategory emphasizes the importance of user-friendly and goal-appropriate interfaces in enhancing the usability and effectiveness of tools within the software development process.
Tool usage/Customization (4/46)
Requirements in this subcategory focus on implementing new (customized) tool features. For instance, commands that increase practitioners’ control over the tool execution (e.g., “The issue labeling bot will enable practitioners to choose whether to assign a label to an issue”) or customization options that enable practitioners to consult only relevant data (e.g., “The dashboard will provide a customization option to select which projects/files to present information about.”).
It is worth mentioning that each of the requirements we elicited supports one TDM activity. Based on Li et al. (2015) and Alves et al. (2016), we identified the TDM activity to which each requirement refers, as per Fig. 8. After analyzing each requirement, we found that 20/46 requirements are related to communication. Such requirements specify either a channel for communicating TD (e.g., email) or the information that must be communicated (e.g., amount of smells). In 2/46 requirements, practitioners manifest the need for support TD identification, mainly related to ignoring false positive instances of TD. Repayment is related to 5/46 requirements, specifically showing the need for automated refactoring. Finally, 19/46 requirements are related to representation/documentation, specifically using dashboards or reports sent by email.
When it comes to TD support, we note that the requirements were elicited to be TD-type-agnostic. This means that such requirements could be implemented in tools regardless of the TD type intended to be managed. However, as per Table 5, it is possible to identify some requirements that are specific for certain TD types. Specifically, in 14/46 requirements, we could identify a TD type. Code debt is related to 12/46 requirements, which are mainly related to presenting code metrics and code smells. In 1/46 requirement, the term “smell” is mentioned. Thus, code, design, and architectural debt could be supported by that requirement. Finally, 1/46 requirement is related to test debt.
This list of requirements may also impact the quality attributes of the TDM tools. Based on ISO/IEC 25010 (ISO/IEC 25010 2023), we identified the quality attribute to which each requirement pertains. Figure 9 shows the number of requirements per quality attribute, as well as an example of a requirement in each category. The list with all requirements per quality attribute can be found in our replication packageFootnote8. Specifically, we found that 7/46 requirements are related to interoperability, i.e., they convey the interaction between the TDM tool and other technologies (e.g., mail servers). Operability, which refers to how easily users can operate the system, is related to 20/46 requirements. It is worth highlighting that 12/20 of requirements related to operability are also related to adaptability. This is because those requirements are related to configuration options that a tool must provide. Finally, 19/46 requirements are related to user engagement, which refers to user interface demands such as the types of data that should be presented in a report.
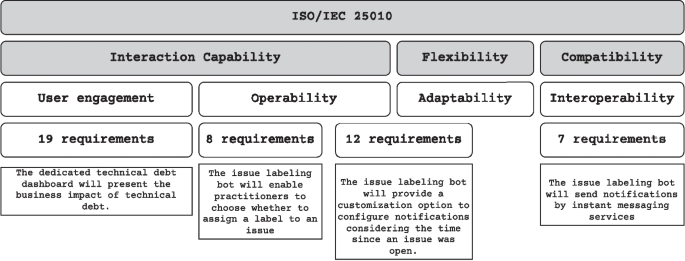
Number of requirements per quality attribute of ISO 25010
While the previously presented categories provide an overview of the practitioners’ demands, we also investigate the most common requirements. Table 6 shows the top 10 most cited requirements. 8/10 are related to information that tools may provide. Among them, the most common requirement is that “The issue labeling bot will notify practitioners about issues containing technical debt,” which was reported by 11 respondents in S1. Besides, 7 respondents in S2 stated that a dashboard should include a dedicated widget for TD. Overall, 24/46 requirements were supported by at least two respondents, while 22/46 were supported by a single respondent (as we mentioned in Section 3.6, our goal is to report any requirement pointed out by practitioners, regardless of the number of indicators). This information reflects a broader variety of preferences and opinions when it comes to tool usage. Thus, it is fair to argue that highly customizable tools are necessary to suit as many practitioners as possible. Following is our third finding.
5 Discussion
5.1 Interpretation of the Results of RQ1
The results of RQ1 indicate that controlling tool execution is a crucial concern for practitioners. This evidence points to a new perspective not identified in the existing literature about TDM automation, such as the ones presented by Martini et al. (2015) and Biazotto et al. (2023). On the one hand, previous literature and also our study indicate the need for higher levels of automation; besides, our study identified the importance of keeping the practitioners at the center of the automation process. Increasing TDM automation levels must be then aligned with human-centered approaches, enabling practitioners to control and monitor tools’ execution constantly. Customization options are pragmatic solutions to enhance practitioners’ control since they allow tailoring for specific contexts such as project characteristics and team maturity. In addition, approaches that involve human intervention and customization options may result in enhancing practitioners’ trust in tool quality and performance, potentially increasing the usage of tools.
Another finding is that practitioners are highly concerned about the potential disturbance that tools may cause. This disturbance may occur because of excessive information and notification load or because of interfering with development workflows. Previous studies have shown that most TDM tools present interfaces to integrate with IDEs or CI managers (Silva et al. 2022; Biazotto et al. 2023; Avgeriou et al. 2021). The evidence we presented in our study shows a good reason to use those interfaces: practitioners prefer solutions attached to the existing development tools because they cause less disturbance. Regarding the disruption caused by information load, our results point to the need for tools that provide targeted and tailored information instead of many diverse pieces of information that do not add value to practitioners.
E.1. Another aspect that deserves attention concerns the similarities and differences between TD tools and software development tools. We note that a deeper and comprehensive comparison between these types of tools is important but still requires empirical effort and evidence, while the current state-of-the-art literature lacks such a comparison. Development tools involve a wide range of tools with various purposes (e.g., testing, build management, dependency management, coding, among others), and mapping their characteristics and comparing these tools with TD tools will require extensive empirical studies, e.g., a thorough comparison based on tools’ features and goals, also including practitioners’ feedback. Considering the current body of knowledge, a possible comparison can address only general characteristics expected and common for those tools. Concerning similarities, customization needs are often required to tailor any tools into development contexts, such as technologies in place and developers’ personal interface preferences (e.g., presented information) (Mendes et al. 2019; Theunissen et al. 2021; Li et al. 2023). In addition, performance and reliability are a shared concern, as practitioners tend to avoid tools without expected performance or reliable results (Avgeriou et al. 2021; Yetistiren et al. 2022). Regarding differences, the adoption of TD tools may face resistance due to their perceived complexity and the long-term investment often required to address TD (Martini et al. 2018). General development tools are usually adopted based on immediate productivity gains (Weber et al. 2024). Furthermore, TD tools need to be significantly adapted to different company policies and project characteristics (e.g., budget, priorities) (Besker et al. 2019). At the same time, there is also a lack of tools specific to TDM, and most adopted for TDM management are general-purpose tools (e.g., SonarQube) (Biazotto et al. 2025). On the contrary, general software development tools tend to have more standardized applications with minimal need for contextual adaptation (Luo et al. 2021).
As we mentioned in Section 4.1, around 66% of the answers we received came from developers, and our model may mainly reflect the preferences of practitioners with that role. It is worth mentioning that, when using and exploring our model, it might better suit decisions that are more closely related to writing coding, for instance, aid the selection of plugins to be installed in IDEs.
5.2 Interpretation of the Results of RQ2
In RQ2, we elicited 46 requirements for TDM tools, which mainly address the concerns reported in RQ1 by formulating what the tools should offer concretely. In the following, we elaborate on how this is done.
One of the main goals of using tools for TDM is to gather data to support decision-making about managing TD (e.g., measuring TD or choosing TD items to be paid back). Considering that TD has many facets, ranging from specific problems in source code (e.g., long methods) to architectural problems (e.g., cyclomatic dependencies), many types of data are required to analyze TD accumulation from different perspectives, leading to informed decisions. The need for data is evident in the requirements we collected, with half of them related to the category Information to be provided. These requirements address the concerns and , which focus on the amount and type of data provided by tools.
We also noticed that practitioners may resort to executing a tool manually to avoid potential disturbances caused by it and also to check the output of such a tool; thus, manual execution shows a pragmatic approach to address the Human Intervention concern. Regarding the concern Keep the Control, our data also shows that keeping control over tools mostly concerns how practitioners configure the tool’s execution and usage (i.e., using configuration options). For instance, when practitioners configure an analysis to be automatically carried out after each CI cycle (i.e., workflow execution), they are exercising control over tools. Hence, the categories and are directly related to the core theme in our model, indicating that 35% of the requirements (i.e., 16/46) reflect the concern , i.e., practitioners want to control how and when tools will be executed.
To avoid changes in the development workflow (e.g., waiting for a tool to analyze code in real time), practitioners prefer to configure when tools should be executed. This is reflected by the identification of several requirements about Workflow Execution and Execution Criteria. Such requirements are aligned with practitioners’ concerns about .
Several requirements indicate that flexibility is a critical aspect of tool usage. Since software development is a dynamic process in which priorities change frequently, tools for TDM must be able to adapt to those changes. Interestingly, requirements in all categories point to tool configuration options, such as choosing data to be presented on dashboards and choosing criteria to execute static code analyzers. Hence, most requirements pointed out by practitioners are related to . This emphatically shows that customization options are the main solution for keeping control over tools.
Regarding TDM activities, the results show that TD communication is the most emphasized activity, highlighting that sharing information between all stakeholders is crucial to more efficient and precise TDM. This aspect (i.e., precise information sharing) is also confirmed by the fact that representation/documentation shows strong demand. This result is aligned with recent literature that shows that TD dashboards are helpful for decision-making (Mendes et al. 2019; Li et al. 2023). Repayment and identification appear less frequently, suggesting that these activities might be harder to support or that the available tools support these activities sufficiently.
Regarding the TD types present in the requirements, although most requirements were framed to be TD-type-agnostic, a subset was linked to specific TD types, primarily code debt, pointing to a natural focus on more tangible or detectable issues like code smells and metrics. This distribution suggests a practical emphasis on visibility and communication in TDM, with opportunities for further research and tool development targeting underrepresented activities (e.g., prioritization) and debt types (e.g., architectural).
5.3 Implications for Practitioners
The model presented in RQ1 outlines common concerns related to the adoption, selection, and use of TDM tools. Practitioners can use this model to make informed decisions on how to automate TDM, particularly how to select tools. This is because the model can raise awareness of potential problems involving tools (such as workflow consistency). For instance, instead of focusing only on the features that a tool offers (e.g., identifying TD items), the model helps practitioners to remember that other aspects are also important while choosing tools, such as how easily they can be integrated with the existing development environment (e.g., IDEs). The model can also facilitate communication among practitioners by defining a common terminology. For example, the concerns present in the model could be used as categories to document tool-related decisions.
The most significant implications of our work are for tool vendors. We provide a model that can help vendors develop tools aligned with the concerns of practitioners and a list of requirements that can be directly implemented. The model and the requirements can support the improvement of existing tools and the development of new ones that address developers’ concerns, achieve higher levels of automation, and reduce TDM effort. Specifically, vendors should pay extra attention to the provided configuration options (e.g., when a tool should run an analysis); this could increase the control practitioners have over the tools and potentially lead to higher adoption. In addition, on top of increasing tools’ analysis precision (e.g., identifying more TD items), transparency (e.g., explicitly presenting current precision scores) is crucial to increasing tools’ trustworthiness.
Vendors should also consider the interoperability aspects of tools. A fair share of the requirements suggests a need for integrating TDM tools and other development tools (e.g., with IDEs), and such an integration could increase the adoption of tools. Finally, some requirements point to information that could help in TD prioritization (e.g., business impact, risk, or severity of TD items), which might indicate a need for better support for this activity. Hence, vendors could include TD prioritization approaches into TDM tools (e.g., automatically ranking identified smells); this could help practitioners plan payment actions more effectively.
Regarding the requirements, potential future work involves prioritizing them. Since the priorities depend on the context in which such requirements will be implemented, practitioners and researchers could plan case studies or technical action research to prioritize and implement requirements in TDM tools. To provide more details on how the prioritization could be carried out, we reviewed 49 prioritization approaches, as reported in Achimugu et al. (2014), and found Hierarchy AHP (Karlsson et al. 1998) as a feasible technique that prioritizes requirements in a hierarchical order based on the accumulated scores of each requirement across relevant stakeholders. Since stakeholders with multiple roles (e.g., managers, tech leads, developers) have an interest in managing TD, this technique could capture more concerns and address them into priorities. Moreover, combining Hierarchy AHP with a multi-criteria matrix (which considers the business value, the implementation effort, and the technical impact of each requirement) seems to be also valid. In addition, a feasibility analysis is necessary when implementing such requirements. In particular, a structured analysis using a framework that evaluates technical feasibility, resource requirements, and constraints for each requirement could be used for the feasibility analysis.
5.4 Implications for Researchers
The results of our study highlight some aspects of TDM and its automation that require further investigation, which provides significant implications for researchers. Firstly, there is a need to explore solutions that address the concerns presented in RQ1, not only from a technical perspective but also from a socio-technical one. Our study indicates that while automating TDM is essential for practitioners, maintaining the human element in the automation process is crucial. Researchers could then investigate automated TDM approaches that involve human intervention, for example, having tools to support TD prioritization that receive constant feedback from practitioners, increasing the reliability of the tool (which is also related to the concern ). Moreover, other non-technical factors, such as team maturity, development processes (e.g., Scrum), and budget, influence tool usage, and a deeper understanding of how these aspects should be addressed while adopting tools is necessary.
From a technical perspective, we identified several requirements related to customizing tool execution (e.g., executing a tool at commit time). Such requirements can potentially increase the level of automation of TDM since tools can operate autonomously once they are configured. Hence, researchers could implement some requirements related to tool execution and conduct empirical studies to evaluate the efficacy of TDM approaches through higher levels of automation.
Researchers can also contribute to improving the accuracy of tools’ output; this was identified in RQ1 as one of the major concerns that practitioners have while adopting tools (i.e., . Potential directions include the development of more precise techniques for identifying TD (e.g., based on graph machine learning Tommasel and Diaz-Pace 2022) and improving the estimation of the effort required to repay TD (e.g., combining multiple TD metrics collected from different sources where TD is identified Tsoukalas et al. 2022). Furthermore, strategies that combine multiple inputs from different tools and triangulate results (such as the ATD Indexes presented by Verdecchia et al. 2020 and Sas and Avgeriou 2023) could improve the precision of tools and encourage their adoption by practitioners.
Our study also contributes, to some extent, to the body of empirical methods in software engineering. As we stated in Section 2, to the best of our knowledge, there is a lack of guidelines for qualitative surveys in software engineering. To address this gap, we adapted the guidelines proposed by Kitchenham and Pfleeger (2008). Reusing the core phases presented in those guidelines proved to be a viable alternative for planning and conducting qualitative surveys. We encourage researchers not only to reuse our approach but also to improve and refine it. One suggestion in this direction is to enhance Phase 3 (Developing survey instruments) with guidelines that support the structured design of questionnaires.
6 Threats to Validity
As in any empirical study, there are several threats to the validity of our study. Considering our research method, which includes the design and execution of a qualitative survey combined with thematic synthesis, we deemed the interpretive criteria, as per Cruzes and Dyba (2011), as a suitable set of threat types to organize this section. Hence, we discuss threats to credibility, confirmability, dependability, and transferability, as well as the actions we took to mitigate these threats.
Credibility deals with the focus of the research and refers to the confidence that can be placed in how well data and processes of analysis address the intended focus. To some extent, the study’s findings depend on how the participants were selected and how they interpreted the questions on the questionnaires. Regarding the focus of our study, we intended to understand practitioners’ concerns about TDM tools. To enhance credibility, we decided not to restrict the roles of practitioners (e.g., focusing only on developers). This enabled us to collect opinions from practitioners with different roles and reflect a variety of concerns in our model.
Practitioners’ understanding of the scenarios and the questions might impact their answers, thus both scenarios and the questionnaires’ design are potential threats in our study. To mitigate this threat, we first based the scenarios on existing literature (such as Martini et al. 2018 and Silva et al. 2022). In addition, we reviewed the represented technologies (e.g., Grafana Dashboard) to ensure that the scenario is aligned with industrial practice. Finally, we had two rounds of reviews to refine the scenarios (pre-pilot and pilot). Nonetheless, we acknowledge that the results of our study are directly impacted by the scenarios, and results could be different if other scenarios were used.
The questions we asked practitioners are largely based on the scenarios, which can introduce bias in the responses. Moreover, key concerns that could have been identified using other relevant scenarios might be missing. To mitigate these threats, we followed four main actions: First, all nine TDM activities were represented; thus, it is fair to assume that the set of scenarios we provided is representative. Second, to design the scenarios, we selected types of tools that have been previously discussed in studies about TDM (e.g., bots for identifying TD Phaithoon et al. 2021). Third, we included a question about the relevance of each scenario, and practitioners acknowledged that they were relevant (see Section 4.1). Finally, we also included open-ended questions that provided respondents with the opportunity to express their unique views on the scenarios.
Confirmability focuses on how the extracted data are classified and organized and whether different researchers and experts agree with the methods used to code and sort the data. In our study, we adopted an integrated approach (Cruzes and Dyba 2011) to code the data. Initially, three authors independently coded a randomly selected sample of 30 responses, generating as many codes as possible based on the data. They then discussed the generated codes until they reached a consensus. We followed a similar process for defining the themes and building the model: The first author proposed the themes based on indicators from the data, which were subsequently discussed and reviewed by the other three authors. We consider that this approach helped mitigate potential threats and enhanced the confirmability of our study.
Dependability refers to the stability of the data over time, the degree to which the data vary, and any changes made to the researchers’ decisions throughout the synthesis process. To enhance dependability, we defined and refined the themes through discussions between all four authors. In addition, we were concerned with defining themes that captured all aspects of the data. For example, the theme represents indicators related to CI/CD pipelines as well as the usage of plugins in IDE, covering a wide range of concerns related to tool chains and development processes.
Transferability concerns the degree to which the findings can be transferred to other settings or groups. Participant recruitment is a potential threat since we rely on convenience sampling. It is possible that the knowledge of the selected group is not representative of the whole population, and the results might change if different participants were selected. The non-probabilistic sampling design used for data collection is a potential threat to the study. For instance, there is a risk of a biased sample, which is not representative of the target population, or with a dominant participation of a certain practitioner profile (e.g., software developers). To mitigate this threat, we disseminated the survey using social media (e.g., LinkedIn) and also to developers who contribute to OSS projects (such as the ones in Apache Software Foundation), trying to reach as many diverse practitioners as possible. As we collected the opinions from different points of view, as reported in Section 4.1, we believe the results are valid for practitioners with other roles (e.g., managers) and could be further transferred. However, we acknowledge that our findings are deeply bound to our sample (as any other survey), and the results might not represent the entire population (i.e., software practitioners). Specifically for our survey, developers account for around 66% of the answers. Thus, the rationale model and the requirements might mainly reflect their concerns, and some other relevant concerns might be missing due to other underrepresented roles (e.g., testers and managers). Further research is needed in this regard to improve the overall generalizability of our results.
To specify the requirements, we also relied on a well-established template by Pohl (2016), which helped define a common terminology to document the requirements. Besides that, the second and third authors reviewed the requirements and the categories documented by the first author and discussed the disagreements until reaching a consensus.
Regarding our methods to build the model of concerns, although we used coding, which is a technique present in Grounded Theory (Strauss and Corbin 1990) to analyze the answers and define the themes (as presented in Section 3.5.1), not all steps of Grounded Theory were followed. Specifically, data collection and analysis steps were not concurrent (i.e., we collected all the data before analyzing it), which prevented us from claiming the theoretical saturation of our model of concerns. Hence, replications of our study can help capture potential concerns not identified in RQ1 and move the model toward theoretical saturation. To support such replications and reproductions, we created a replication packageFootnote9 with all the necessary data and scripts to run the analyses.
Although thematic synthesis (Cruzes and Dyba 2011) does not enforce the validation of our model of concerns, the lack of validation in a real setting could be seen as a limitation in our study. We then intend to evaluate the model in future work. Since the model focuses mainly on the point of view of practitioners, a focus group (Kontio et al. 2008; Wohlin and Runeson 2021) can be applied for this purpose. In this focus group, we can use real cases as a source of discussion, such as the one reported by Verdecchia et al. (2024), which shows TD in a migration process. Considering this case, the model could be applied to discuss how the tools could be helpful for migration. Furthermore, a TAM-based (Davis et al. 1989) approach could be used to check the usefulness, completeness, and ease of use of the model.
7 Conclusion
The management of TD is crucial for the success of software projects, and the use of tools that support TDM can reduce the workload of this process through automation. This study surveyed practitioners’ perceptions, concerns, and requirements for TDM tools, which can help them use TDM tools more efficiently. In total, we obtained 103 responses (89 valid) from which we proposed a model that presents the main concerns of practitioners about TDM tools (as previously shown in Fig. 7). In addition, we obtained 46 requirements that can be used as a basis to improve existing tools or develop new ones. Overall, the results point to the need for highly customizable tools, which can support and balance the potential disturbance that tools can cause to practitioners (e.g., many notifications or changes in the development workflow). In addition, customized options can enhance practitioners’ control over tools.
As part of our future work, we intend to refine the model of concerns, especially by interviewing practitioners with roles other than the ones listed in Table 2. This future work would help capture more concerns that might have been missed due to roles that were under-represented in our sample (e.g., testers and managers). This would increase the generalizability of the model and its overall usefulness. We also intend to evaluate the model of concerns in real-world projects, for example, by interviewing practitioners about past experiences in selecting tools. We can then assess the effectiveness and correctness of the model, especially to support decision-making, and capture more concerns not identified in the present study. This evaluation would also support the proposal of guidelines that benefit practitioners while using the model, such as decision trees based on the concerns.
Finally, it is also important to investigate the correlation between the requirements for TDM tools and the profiles of practitioners. Practitioners with different roles might have specific perceptions of TDM automation, including the activities that should be automated, information to be provided by tools, and the essential configuration options (e.g., when to be notified about TD accumulation). Understanding such preferences may also help tailor solutions and facilitate tool adoption for TDM.
Data Availability Statement
The generated datasets and scripts for data analysis are available in a Zenodo repository: https://doi.org/10.5281/zenodo.14785590.
Notes
-
https://www.sonarsource.com/products/sonarcloud/
-
https://www.sonarsource.com/products/sonarqube/
-
https://grafana.com/
-
https://c4model.com/
-
https://doi.org/10.5281/zenodo.14785590
-
https://www.google.com/forms/
-
https://doi.org/10.5281/zenodo.14785590
-
https://doi.org/10.5281/zenodo.14785590
-
https://doi.org/10.5281/zenodo.14785590
References
-
Achimugu P, Selamat A, Ibrahim R, Mahrin MN (2014) A systematic literature review of software requirements prioritization research. Inf Softw Technol 56(6):568–585. https://doi.org/10.1016/j.infsof.2014.02.001
-
Alfayez R, Ding Y, Winn R, Alfayez G, Harman C, Boehm B (2023) What is asked about technical debt (td) on stack exchange question-and-answer (q &a) websites? an observational study. Empir Softw Eng 35. https://doi.org/10.1007/s10664-022-10269-5
-
Alves NSR, Mendes TS, Mendonça MG, Spínola RO, Shull F, Seaman C (2016) Identification and management of technical debt: A systematic mapping study. Inf Softw Technol 100–121. https://doi.org/10.1016/j.infsof.2015.10.008
-
Apa C, Solari M, Vallespir D, Travassos GH (2020) A taste of the software industry perception of technical debt and its management in uruguay: A survey in software industry. In: 14th ACM/IEEE International symposium on empirical software engineering and measurement (ESEM), pp 1–9. https://doi.org/10.1145/3382494.3421463
-
Arvanitou E-M, Ampatzoglou A, Bibi S, Chatzigeorgiou A, Stamelos I (2019) Monitoring technical debt in an industrial setting. In: Evaluation and assessment on software engineering (EASE), pp 123–132. https://doi.org/10.1145/3319008.3319019
-
Avgeriou P, Taibi D, Ampatzoglou A, Fontana FA, Besker T, Chatzigeorgiou A, Lenarduzzi V, Martini A, Moschou A, Pigazzini I, Saarimaki N, Sas DD, Toledo SS, Tsintzira AA (2021) An overview and comparison of technical debt measurement tools. IEEE Softw 38(3):61–71. https://doi.org/10.1109/ms.2020.3024958
-
Avgeriou P, Ozkaya I, Chatzigeorgiou A, Ciolkowski M, Ernst NA, Koontz RJ, Poort E, Shull F (2023) Technical debt management: The road ahead for successful software delivery. In: IEEE/ACM International conference on software engineering: future of software engineering (ICSE-FoSE), pp 15–30. https://doi.org/10.1109/ICSE-FoSE59343.2023.00007
-
Besker T, Martini A, Bosch J (2018) Technical debt cripples software developer productivity: A longitudinal study on developers’ daily software development work. In: International conference on technical debt (TechDebt), pp 105–114. https://doi.org/10.1145/3194164.3194178
-
Besker T, Martini A, Bosch J (2019) Software developer productivity loss due to technical debt—a replication and extension study examining developers’ development work. J Syst Softw 156:41–61. https://doi.org/10.1016/j.jss.2019.06.004
-
Biazotto JP, Feitosa D, Avgeriou P, Nakagawa EY (2023) Technical debt management automation: State of the art and future perspectives. Inf Softw Technol 1–20. https://doi.org/10.1016/j.infsof.2023.107375
-
Biazotto J, Feitosa D, Avgeriou P, Nakagawa E (2025) Automating technical debt management: Insights from practitioner discussions in stack exchange. In: 2025 IEEE/ACM International conference on technical debt (TechDebt), pp 1–12. https://doi.org/10.48550/arXiv.2502.03153
-
Braun V, Clarke V, Boulton E, Davey L, McEvoy C (2020) The online survey as a qualitative research tool. Int J Soc Res Methodol 24(6):641–654. https://doi.org/10.1080/13645579.2020.1805550
-
Codabux Z, Williams BJ, Bradshaw GL, Cantor M (2017) An empirical assessment of technical debt practices in industry. J Softw Evol Process 29(10):1894. https://doi.org/10.1002/smr.1894
-
Cruzes DS, Dyba T (2011) Recommended steps for thematic synthesis in software engineering. In: International symposium on empirical software engineering and measurement (ESEM), pp 275–284. https://doi.org/10.1109/ESEM.2011.36
-
Cunningham W (1992) The wycash portfolio management system. In: Addendum to the proceedings on object-oriented programming systems, languages, and applications (OOPSLA), pp 29–30. https://doi.org/10.1145/157709.157715
-
Davis FD, Bagozzi RP, Warshaw PR (1989) User acceptance of computer technology: A comparison of two theoretical models. Management Sci 35(8):982–1003. https://doi.org/10.1287/mnsc.35.8.982
-
Digkas G, Chatzigeorgiou A, Ampatzoglou A, Avgeriou P (2022) Can clean new code reduce technical debt density? IEEE Trans Softw Eng 48(5):1705–1721. https://doi.org/10.1109/TSE.2020.3032557
-
Duarte Alonso A, Kim OVT, Tran TD, Minh Le T, Nguyen TD, Nguyen TT (2024) Exploring the relationships between industry 4.0 adoption and business model: The case of vietnamese hospitality organisations. Int J Hosp Tourism Adm 1–30. https://doi.org/10.1080/15256480.2024.2312477
-
Easterbrook S, Singer J, Storey M-A, Damian D (2008) Selecting Empirical Methods for Software Engineering Research, pp 285–311. Springer, London, UK. https://doi.org/10.1007/978-1-84800-044-5_11
-
Ernst NA, Bellomo S, Ozkaya I, Nord RL, Gorton I (2015) Measure it? manage it? ignore it? software practitioners and technical debt. In: 10th Joint meeting on foundations of software engineering (ESEC/FSE), pp 1–11. https://doi.org/10.1145/2786805.2786848
-
Falessi D, Shaw MA, Shull F, Mullen K, Keymind MS (2013) Practical considerations, challenges, and requirements of tool-support for managing technical debt. In: 4th International workshop on managing technical debt (MTD), pp 16–19. https://doi.org/10.1109/MTD.2013.6608673
-
Fitzgerald B, Stol K-J (2017) Continuous software engineering: A roadmap and agenda. Journal of Systems and Software 123:176–189. https://doi.org/10.1016/j.jss.2015.06.063
-
Guo Y, Seaman C (2011) A portfolio approach to technical debt management. In: 2nd Workshop on managing technical debt (MTD), pp 31–34. https://doi.org/10.1145/1985362.1985370
-
Hassan AE (2008) The road ahead for mining software repositories. In: Frontiers of software maintenance, pp 48–57. https://doi.org/10.1109/fosm.2008.4659248
-
Holvitie J, Leppänen V, Hyrynsalmi S (2014) Technical debt and the effect of agile software development practices on it – an industry practitioner survey. In: 6th International workshop on managing technical debt (MTB), pp 35–42. https://doi.org/10.1109/MTD.2014.8
-
ISO/IEC 25010: ISO/IEC 25010:2023, Systems and Software Engineering — Systems and Software Quality Requirements and Evaluation (SQuaRE) — System and Software Quality Models
-
Jeronimo Junior H, Travassos GH (2022) Consolidating a common perspective on technical debt and its management through a tertiary study. Inf Softw Technol 149:106964. https://doi.org/10.1016/j.infsof.2022.106964
-
Karlsson J, Wohlin C, Regnell B (1998) An evaluation of methods for prioritizing software requirements. Inf Softw Technol 39(14–15):939–947. https://doi.org/10.1016/s0950-5849(97)00053-0
-
Kashiwa Y, Nishikawa R, Kamei Y, Kondo M, Shihab E, Sato R, Ubayashi N (2022) An empirical study on self-admitted technical debt in modern code review. Inf Softw Technol 146:106855. https://doi.org/10.1016/j.infsof.2022.106855
-
Khomyakov I, Makhmutov Z, Mirgalimova R, Sillitti A (2019) Automated measurement of technical debt: A systematic literature review. In: 21st International conference on enterprise information systems (ICEIS), pp 95–106. https://doi.org/10.5220/0007675900950106
-
Kitchenham BA, Pfleeger SL (2008) Personal Opinion Surveys, pp 63–92. Springer, London, UK. https://doi.org/10.1007/978-1-84800-044-5_3
-
Kontio J, Bragge J, Lehtola L (2008) The Focus Group Method as an Empirical Tool in Software Engineering, pp 93–116. Springer. https://doi.org/10.1007/978-1-84800-044-5_4
-
Li Z, Avgeriou P, Liang P (2015) A systematic mapping study on technical debt and its management. J Syst Softw 101:193–220. https://doi.org/10.1016/j.jss.2014.12.027
-
Li Y, Soliman M, Avgeriou P, Somers L (2023) Self-admitted technical debt in the embedded systems industry: An exploratory case study. IEEE Trans Softw Eng 49(4):2545–2565. https://doi.org/10.1109/TSE.2022.3224378
-
Lim E, Taksande N, Seaman C (2012) A balancing act: What software practitioners have to say about technical debt. IEEE Softw 29(6):22–27. https://doi.org/10.1109/MS.2012.130
-
Linåker J, Sulaman S, Host M, Mello R (2015) Guidelines for Conducting Surveys in Software Engineering. Lund University, Lund, Sweden
-
Li Y, Soliman M, Avgeriou P (2022) Identifying self-admitted technical debt in issue tracking systems using machine learning. Emp Softw Eng 27(6). https://doi.org/10.1007/s10664-022-10128-3
-
Li Y, Soliman M, Avgeriou P, Van Ittersum M (2023) Debtviz: A tool for identifying, measuring, visualizing, and monitoring self-admitted technical debt. In: 2023 IEEE International conference on software maintenance and evolution (ICSME), pp 558–562. https://doi.org/10.1109/ICSME58846.2023.00072
-
Lunde BA, Colomo-Palacios R (2020) Continuous practices and technical debt: a systematic literature review. In: 20th International conference on computational science and its applications (ICCSA), pp 40–44. https://doi.org/10.1109/ICCSA50381.2020.00018
-
Luo L, Schäf M, Sanchez D, Bodden E (2021) Ide support for cloud-based static analyses. In: ACM Joint meeting on european software engineering conference and symposium on the foundations of software engineering, pp 1178–1189. https://doi.org/10.1145/3468264.3468535
-
Malakuti S, Heuschkel J (2021) The need for holistic technical debt management across the value stream: Lessons learnt and open challenges. In: 2021 IEEE/ACM International conference on technical debt (TechDebt), pp 109–113. https://doi.org/10.1109/TechDebt52882.2021.00021
-
Malakuti S, Ostroumov S (2020) The quest for introducing technical debt management in a large-scale industrial company. In: 12th European conference on software architecture (ECSA), pp 296–311. https://doi.org/10.1007/978-3-030-58923-3_20
-
Martini A, Bosch J, Chaudron M (2015) Investigating architectural technical debt accumulation and refactoring over time: A multiple-case study. Inf Softw Technol 67:237–253. https://doi.org/10.1016/j.infsof.2015.07.005
-
Martini A, Besker T, Bosch J (2018) Technical debt tracking: Current state of practice: A survey and multiple case study in 15 large organizations. Sci Comput Program 163:42–61. https://doi.org/10.1016/j.scico.2018.03.007
-
McGregor JD, Monteith JY, Zhang J (2012) Technical debt aggregation in ecosystems. In: 3rd International workshop on managing technical debt (MTD), Zurich, Switzerland, pp 27–30. https://doi.org/10.1109/MTD.2012.6225996
-
Melo A, Fagundes R, Lenarduzzi V, Santos WB (2022) Identification and measurement of requirements technical debt in software development: A systematic literature review. J Syst Softw 194:111483. https://doi.org/10.1016/j.jss.2022.111483
-
Mendes TS, Gomes FGS, Gonçalves DP, Mendonça MG, Novais RL, Spínola RO (2019) Visminertd: a tool for automatic identification and interactive monitoring of the evolution of technical debt items. J Braz Comput Soc 25(1). https://doi.org/10.1186/s13173-018-0083-1
-
Oliveira Neto R, Rocha L, Carvalho Filho M, Ramos R (2024) Addressing visual impairments: Essential software requirements for image caption solutions. Assist Technol 1–16. https://doi.org/10.1080/10400435.2024.2413650
-
Phaithoon S, Wongnil S, Pussawong P, Choetkiertikul M, Ragkhitwetsagul C, Sunetnanta T, Maipradit R, Hata H, Matsumoto K (2021) Fixme: A github bot for detecting and monitoring on-hold self-admitted technical debt. In: 36th IEEE/ACM International conference on automated software engineering (ASE), pp 1257–1261. https://doi.org/10.1109/ase51524.2021.9678680
-
Pohl K (2016) Requirements Engineering Fundamentals: a Study Guide for the Certified Professional for Requirements Engineering Exam-foundation level-IREB Compliant. Rocky Nook Inc, Santa Barbara, US
-
Rios N, Mendonça Neto MG, Spínola RO (2018) A tertiary study on technical debt: Types, management strategies, research trends, and base information for practitioners. Inf Softw Technol 102:117–145. https://doi.org/10.1016/j.infsof.2018.05.010
-
Rios N, Spínola RO, Mendonça M, Seaman C (2020) The practitioners’ point of view on the concept of technical debt and its causes and consequences: a design for a global family of industrial surveys and its first results from Brazil. Empir Softw Eng 25(5):3216–3287. https://doi.org/10.1007/s10664-020-09832-9
-
Rios N, Spínola RO, Mendonça M, Seaman C (2018) The most common causes and effects of technical debt: First results from a global family of industrial surveys. In: 12th ACM/IEEE International symposium on empirical software engineering and measurement (ESEM), pp 1–10. https://doi.org/10.1145/3239235.3268917
-
Sas D, Avgeriou P (2023) An architectural technical debt index based on machine learning and architectural smells. IEEE Trans Softw Eng 49(8):4169–4195. https://doi.org/10.1109/TSE.2023.3286179
-
Sas D, Pigazzini I, Avgeriou P, Fontana FA (2021) The perception of architectural smells in industrial practice. IEEE Softw 38(6):35–41. https://doi.org/10.1109/MS.2021.3103664
-
Silva JDS, Neto JG, Kulesza U, Freitas G, Rebouças R, Coelho R (2022) Exploring technical debt tools: A systematic mapping study. In: International conference on enterprise information systems (ICEIS), pp 280–303. https://doi.org/10.1007/978-3-031-08965-7_14
-
Silva VM, Junior HJ, Travassos GH (2019) A taste of the software industry perception of technical debt and its management in Brazil. J Softw Eng Res Dev 7:1–16. https://doi.org/10.5753/jserd.2019.19
-
Solingen R, Basili V, Caldiera G, Rombach HD (2002) Goal Question Metric (GQM) Approach. John Wiley & Sons, Inc. https://doi.org/10.1002/0471028959.sof142
-
Spyrou O, Hurst W, Verdouw C (2023) Virtual reality-based digital twins: A case study on pharmaceutical cannabis. Big Data Cognit Comput 7(2):95. https://doi.org/10.3390/bdcc7020095
-
Strauss A, Corbin J (1990) Basics of Qualitative Research: Grounded Theory Procedures and Techniques. Sage Publications, Thousand Oaks, US
-
Tan J, Feitosa D, Avgeriou P (2023) The lifecycle of technical debt that manifests in both source code and issue trackers. Inf Softw Technol 159:107216. https://doi.org/10.1016/j.infsof.2023.107216
-
Theunissen T, Hoppenbrouwers S, Overbeek S (2021) In continuous software development, tools are the message for documentation. In: 23rd International conference on enterprise information systems. SCITEPRESS – Science and Technology Publications. https://doi.org/10.5220/0010367901530164
-
Tommasel A, Diaz-Pace JA (2022) Identifying emerging smells in software designs based on predicting package dependencies. Eng Appl Artif Intell 115:105209. https://doi.org/10.1016/j.engappai.2022.105209
-
Tornhill A, Borg M (2022) Code red: the business impact of code quality – a quantitative study of 39 proprietary production codebases. In: 2021 IEEE/ACM International conference on technical debt (TechDebt), pp 11–20. https://doi.org/10.1145/3524843.3528091
-
Tsoukalas D, Mittas N, Chatzigeorgiou A, Kehagias D, Ampatzoglou A, Amanatidis T, Angelis L (2022) Machine learning for technical debt identification. IEEE Trans Softw Eng 48(12):4892–4906. https://doi.org/10.1109/TSE.2021.3129355
-
Verdecchia R, Maggi K, Scommegna L, Vicario E (2024) Technical Debt in Microservices: A Mixed-Method Case Study, pp 217–236. Springer. https://doi.org/10.1007/978-3-031-66326-0_14
-
Verdecchia R, Lago P, Malavolta I, Ozkaya I (2020) Atdx: Building an architectural technical debt index. In: 15th International conference on evaluation of novel approaches to software engineering (ENASE), pp 1–8. https://doi.org/10.5220/0009577805310539
-
Weber T, Brandmaier M, Schmidt A, Mayer S (2024) Significant productivity gains through programming with large language models. Proc ACM Hum-Comput Interact 8(EICS). https://doi.org/10.1145/3661145
-
Wohlin C, Runeson P (2021) Guiding the selection of research methodology in industry–academia collaboration in software engineering. Inf Softw Technol 140:106678. https://doi.org/10.1016/j.infsof.2021.106678
-
Wohlin C, Runeson P, Höst M, Ohlsson MC, Regnell B, Wesslén A (2012) Experimentation in Software Engineering. Springer, Heidelberg, Germany. https://doi.org/10.1007/978-3-642-29044-2
-
Xiao L, Cai Y, Kazman R, Mo R, Feng Q (2022) Detecting the locations and predicting the maintenance costs of compound architectural debts. IEEE Trans Softw Eng 48(9):3686–3715. https://doi.org/10.1109/TSE.2021.3102221
-
Yetistiren B, Ozsoy I, Tuzun E (2022) Assessing the quality of github copilot’s code generation. In: 18th International conference on predictive models and data analytics in software engineering. PROMISE 2022, pp 62–71. Association for Computing Machinery, New York, NY, USA. https://doi.org/10.1145/3558489.3559072
-
Zazworka N, Vetro’ A, Izurieta C, Wong S, Cai Y, Seaman C, Shull F (2013) Comparing four approaches for technical debt identification. Software Qual J 22(3):403–426. https://doi.org/10.1007/s11219-013-9200-8
Acknowledgements
This study was financed in part by the Brazilian Federal Agency for Support and Evaluation of Graduate Education (CAPES) – Finance Code 001, São Paulo Research Foundation (FAPESP) 2023/0488-5, and National Council for Scientific and Technological Development (CNPq) 313245/2021-5.
Funding
This study was financed in part by the Brazilian Federal Agency for Support and Evaluation of Graduate Education (CAPES) – Finance Code 001, São Paulo Research Foundation (FAPESP) 2023/0488-5, and National Council for Scientific and Technological Development (CNPq) 313245/2021-5.
Ethics declarations
Ethical Approval
Not applicable.
Informed Consent
Not applicable.
Conflict of Interest
The authors declared that they have no conflict of interest.
Additional information
Communicated by: Irit Hadar.
Publisher’s Note
Springer Nature remains neutral with regard to jurisdictional claims in published maps and institutional affiliations.
Rights and permissions
Open Access This article is licensed under a Creative Commons Attribution 4.0 International License, which permits use, sharing, adaptation, distribution and reproduction in any medium or format, as long as you give appropriate credit to the original author(s) and the source, provide a link to the Creative Commons licence, and indicate if changes were made. The images or other third party material in this article are included in the article’s Creative Commons licence, unless indicated otherwise in a credit line to the material. If material is not included in the article’s Creative Commons licence and your intended use is not permitted by statutory regulation or exceeds the permitted use, you will need to obtain permission directly from the copyright holder. To view a copy of this licence, visit http://creativecommons.org/licenses/by/4.0/.
Reprints and permissions
About this article
Cite this article
Biazotto, J.P., Feitosa, D., Avgeriou, P. et al. Understanding practitioners’ reasoning and requirements for efficient tool support in technical debt management. Empir Software Eng 30, 134 (2025). https://doi.org/10.1007/s10664-025-10691-5
- Accepted
- Published
- DOI https://doi.org/10.1007/s10664-025-10691-5
Keywords
- Technical debt
- Technical debt management
- Tool support
- Survey
- Thematic synthesis